
|
|||||
|
 | |
| |
| |
| |
| |
| |
|
Gene: NAGPA |
Gene summary for NAGPA |
| Gene information | Species | Human | Gene symbol | NAGPA | Gene ID | 51172 |
| Gene name | N-acetylglucosamine-1-phosphodiester alpha-N-acetylglucosaminidase | |
| Gene Alias | APAA | |
| Cytomap | 16p13.3 | |
| Gene Type | protein-coding | GO ID | GO:0005975 | UniProtAcc | Q9UK23 |
Top |
Malignant transformation analysis |
| Identification of the aberrant gene expression in precancerous and cancerous lesions by comparing the gene expression of stem-like cells in diseased tissues with normal stem cells |
| Entrez ID | Symbol | Replicates | Species | Organ | Tissue | Adj P-value | Log2FC | Malignancy |
| 51172 | NAGPA | LZE24T | Human | Esophagus | ESCC | 2.42e-05 | 2.07e-01 | 0.0596 |
| 51172 | NAGPA | P1T-E | Human | Esophagus | ESCC | 4.28e-08 | 2.94e-01 | 0.0875 |
| 51172 | NAGPA | P2T-E | Human | Esophagus | ESCC | 4.27e-23 | 4.15e-01 | 0.1177 |
| 51172 | NAGPA | P4T-E | Human | Esophagus | ESCC | 2.84e-05 | 1.17e-01 | 0.1323 |
| 51172 | NAGPA | P5T-E | Human | Esophagus | ESCC | 1.73e-03 | 7.15e-02 | 0.1327 |
| 51172 | NAGPA | P8T-E | Human | Esophagus | ESCC | 6.61e-08 | 1.60e-01 | 0.0889 |
| 51172 | NAGPA | P10T-E | Human | Esophagus | ESCC | 1.18e-02 | 6.15e-02 | 0.116 |
| 51172 | NAGPA | P11T-E | Human | Esophagus | ESCC | 4.69e-12 | 3.44e-01 | 0.1426 |
| 51172 | NAGPA | P12T-E | Human | Esophagus | ESCC | 1.90e-16 | 3.50e-01 | 0.1122 |
| 51172 | NAGPA | P15T-E | Human | Esophagus | ESCC | 4.02e-08 | 2.12e-01 | 0.1149 |
| 51172 | NAGPA | P16T-E | Human | Esophagus | ESCC | 3.34e-11 | 2.00e-01 | 0.1153 |
| 51172 | NAGPA | P17T-E | Human | Esophagus | ESCC | 1.34e-03 | 2.19e-01 | 0.1278 |
| 51172 | NAGPA | P19T-E | Human | Esophagus | ESCC | 5.70e-06 | 4.44e-01 | 0.1662 |
| 51172 | NAGPA | P20T-E | Human | Esophagus | ESCC | 3.86e-13 | 2.20e-01 | 0.1124 |
| 51172 | NAGPA | P21T-E | Human | Esophagus | ESCC | 8.20e-18 | 2.81e-01 | 0.1617 |
| 51172 | NAGPA | P22T-E | Human | Esophagus | ESCC | 1.70e-16 | 2.50e-01 | 0.1236 |
| 51172 | NAGPA | P23T-E | Human | Esophagus | ESCC | 1.21e-13 | 2.92e-01 | 0.108 |
| 51172 | NAGPA | P24T-E | Human | Esophagus | ESCC | 5.26e-10 | 1.70e-01 | 0.1287 |
| 51172 | NAGPA | P26T-E | Human | Esophagus | ESCC | 1.82e-10 | 2.08e-01 | 0.1276 |
| 51172 | NAGPA | P27T-E | Human | Esophagus | ESCC | 2.54e-12 | 2.20e-01 | 0.1055 |
| Page: 1 2 3 4 |
| Tissue | Expression Dynamics | Abbreviation |
| Esophagus | 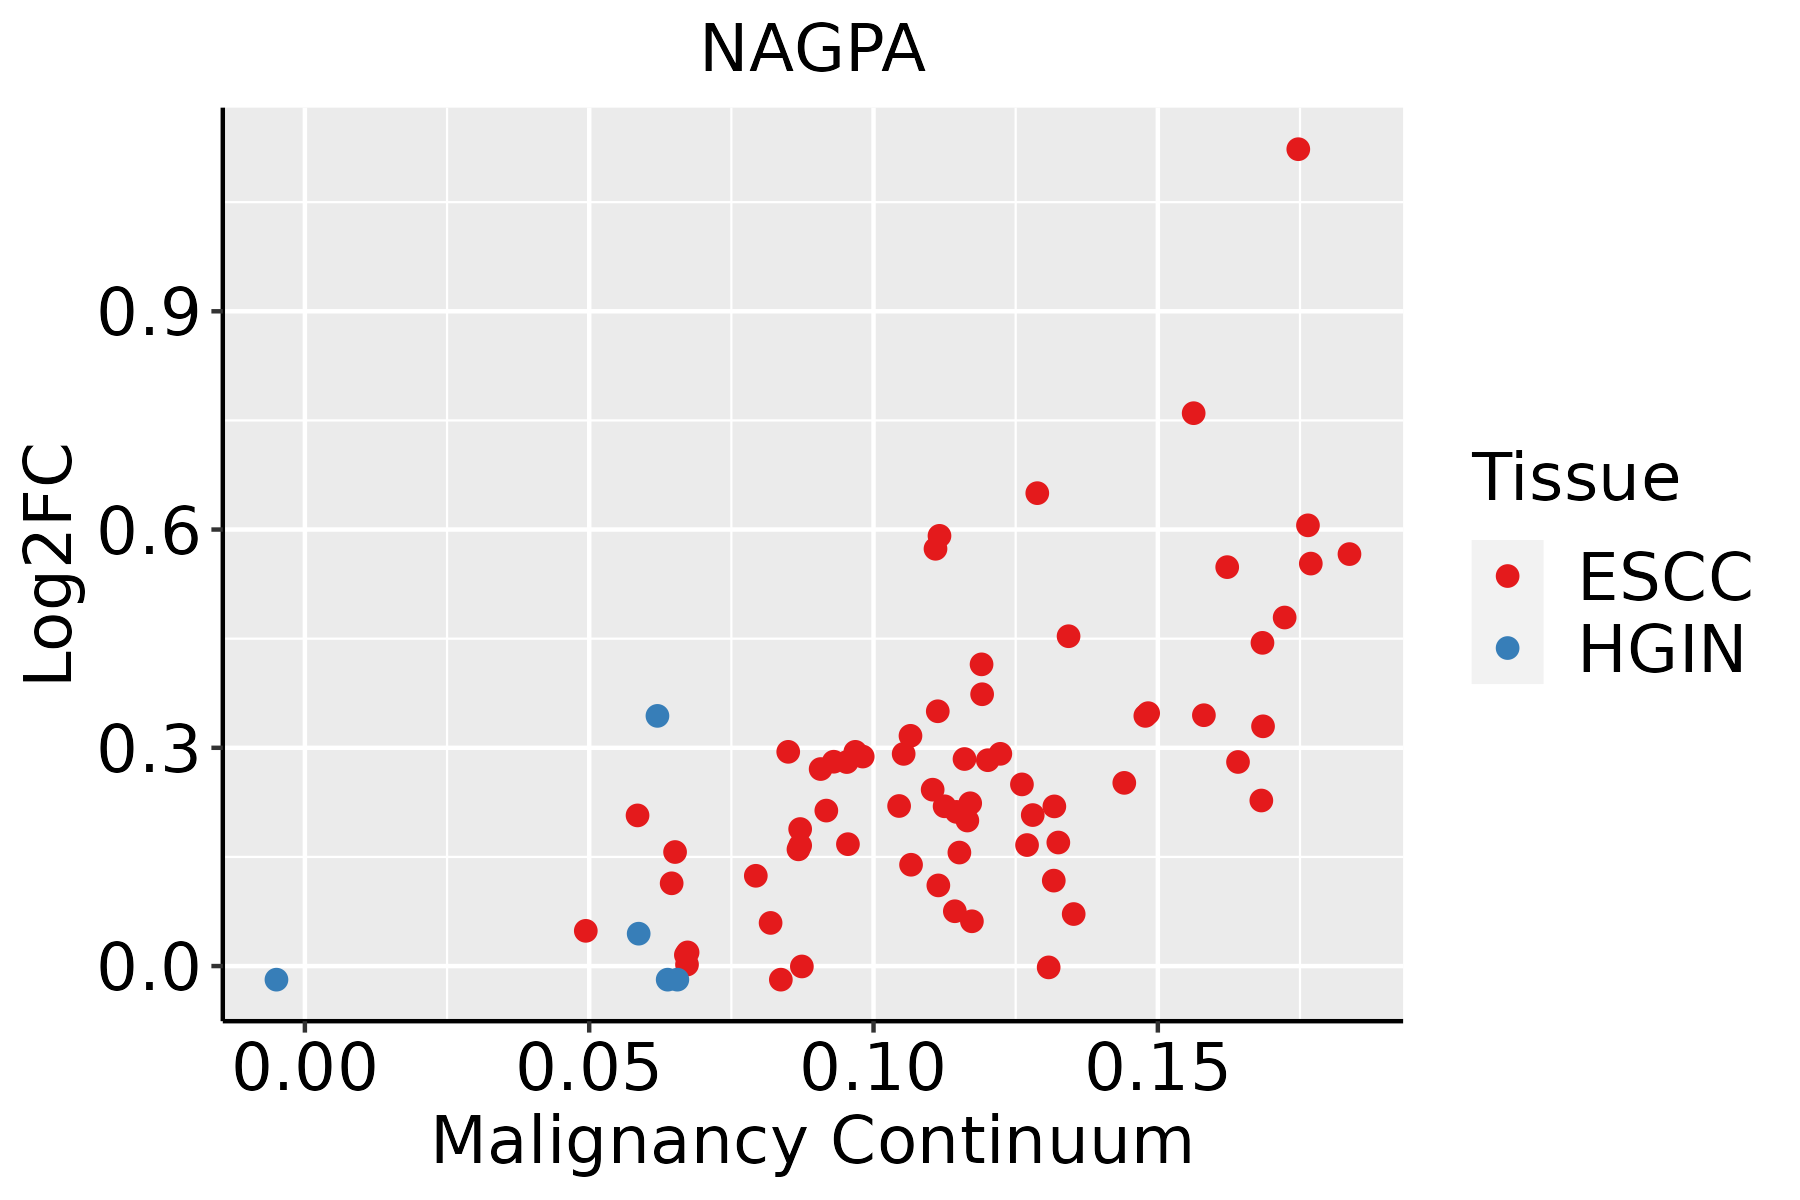 | ESCC: Esophageal squamous cell carcinoma |
| HGIN: High-grade intraepithelial neoplasias | ||
| LGIN: Low-grade intraepithelial neoplasias | ||
| Liver | 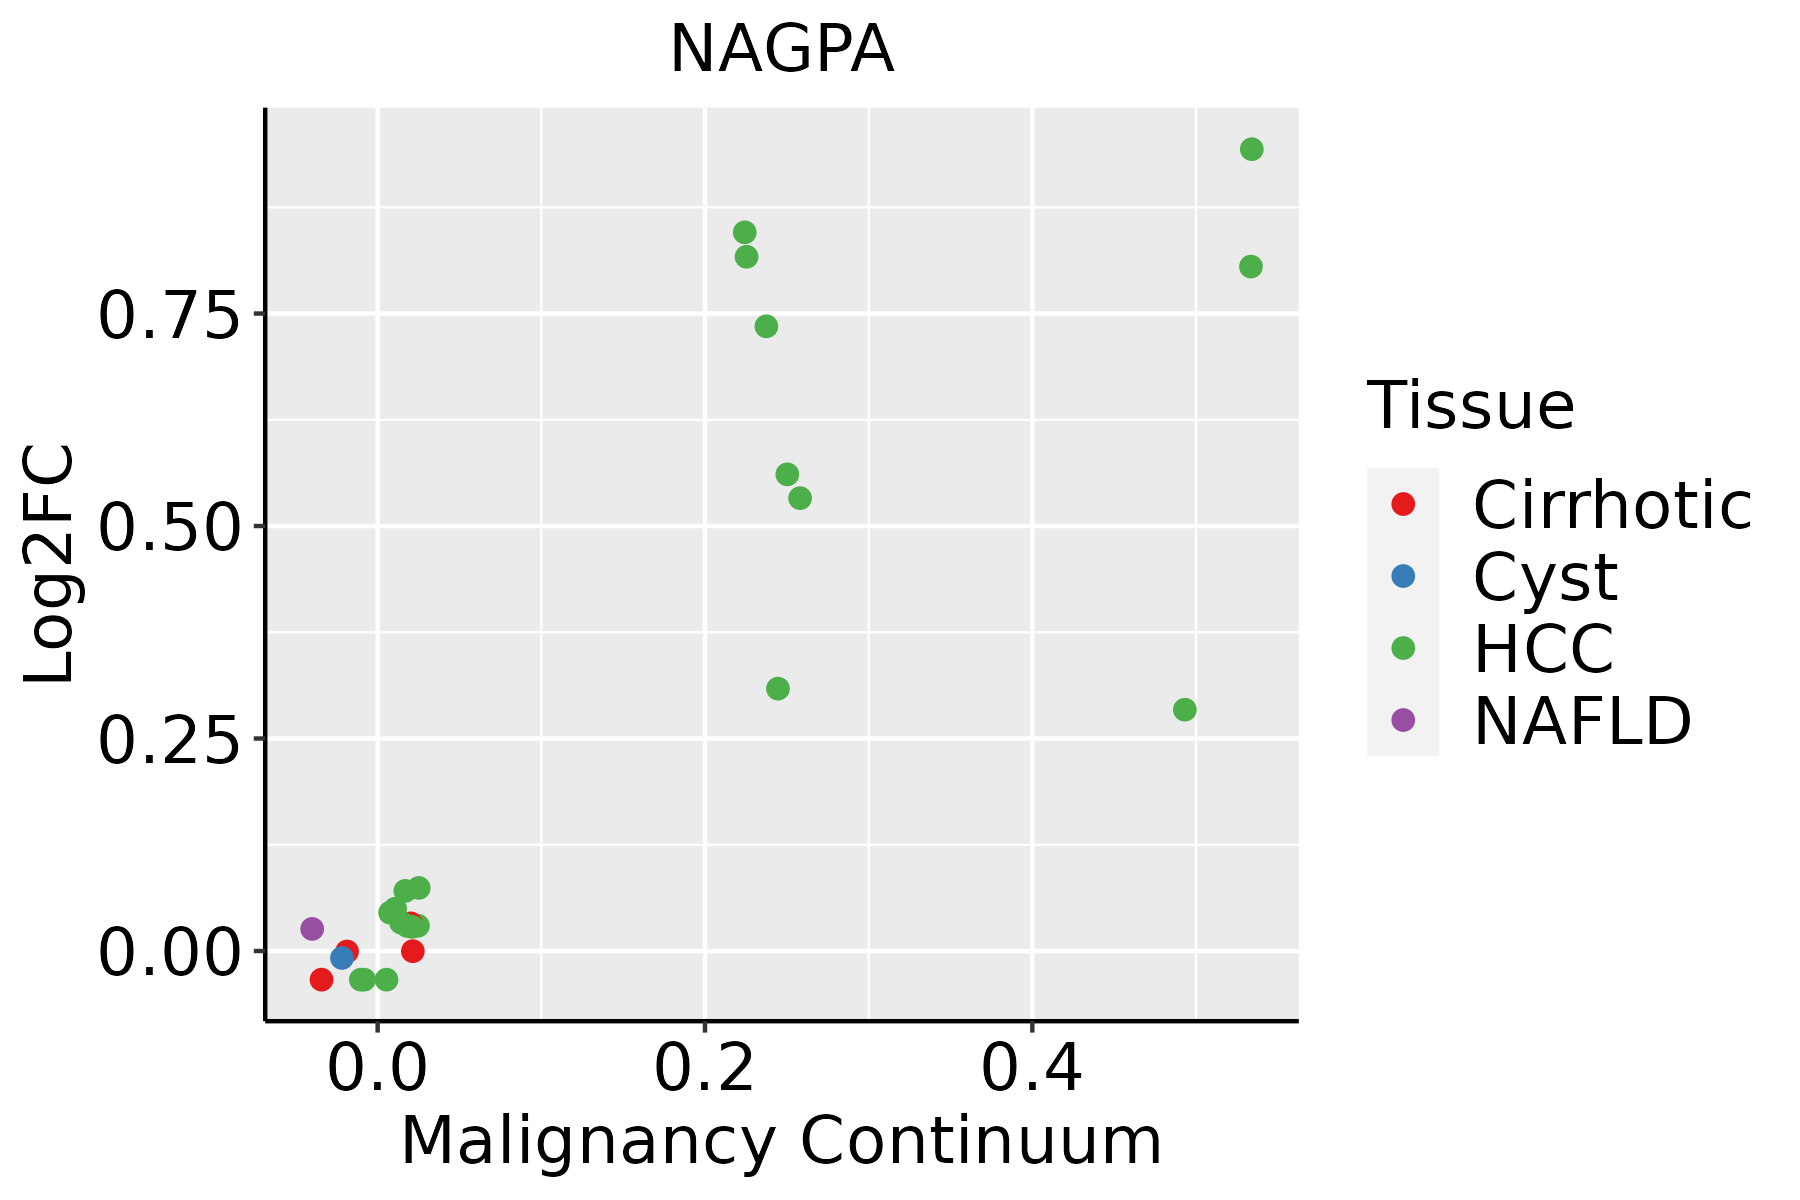 | HCC: Hepatocellular carcinoma |
| NAFLD: Non-alcoholic fatty liver disease | ||
| Oral Cavity | 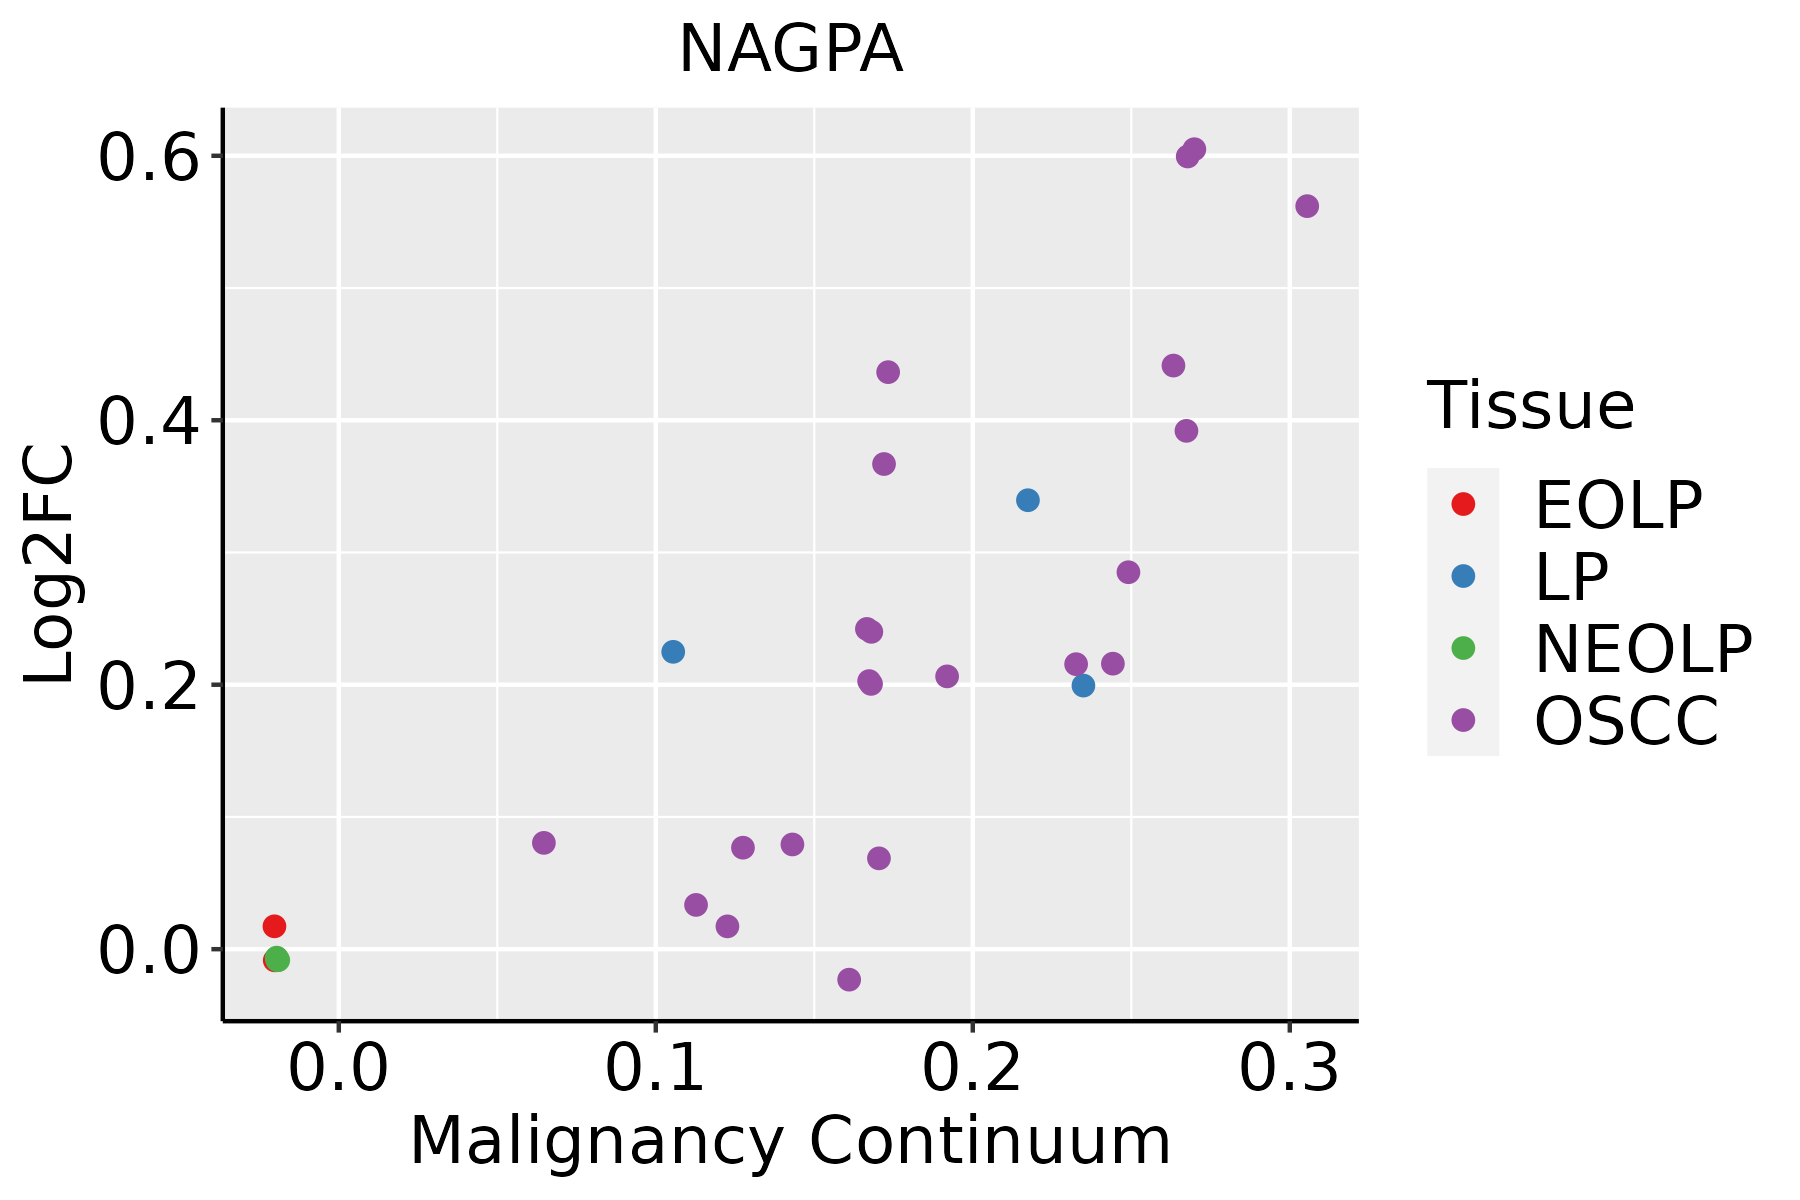 | EOLP: Erosive Oral lichen planus |
| LP: leukoplakia | ||
| NEOLP: Non-erosive oral lichen planus | ||
| OSCC: Oral squamous cell carcinoma |
| ∗log2FC in expression of this searched gene in stem-like cells from each diseased tissue sample relative to stem-like cells in normal samples in each tissue plotted against the malignancy continuum. Samples are colored based on if they are from different disease stage. |
Top |
Malignant transformation related pathway analysis |
| Find out the enriched GO biological processes and KEGG pathways involved in transition from healthy to precancer to cancer |
| Tissue | Disease Stage | Enriched GO biological Processes |
| Colorectum | AD |  |
| Colorectum | SER |  |
| Colorectum | MSS |  |
| Colorectum | MSI-H |  |
| Colorectum | FAP |  |
| ∗Top 15 enriched GO BP terms are showed in the bar plot of each disease state in each tissue. Each row represents a significant GO biological process which is colored according to the -log10(p.adjust). |
| Page: 1 2 3 4 5 6 7 8 9 |
| GO ID | Tissue | Disease Stage | Description | Gene Ratio | Bg Ratio | pvalue | p.adjust | Count |
| GO:0072594110 | Esophagus | ESCC | establishment of protein localization to organelle | 311/8552 | 422/18723 | 3.02e-32 | 2.13e-29 | 311 |
| GO:0006605111 | Esophagus | ESCC | protein targeting | 229/8552 | 314/18723 | 4.93e-23 | 1.01e-20 | 229 |
| GO:000703417 | Esophagus | ESCC | vacuolar transport | 119/8552 | 157/18723 | 1.16e-14 | 6.30e-13 | 119 |
| GO:000703314 | Esophagus | ESCC | vacuole organization | 127/8552 | 180/18723 | 1.04e-11 | 3.85e-10 | 127 |
| GO:00070419 | Esophagus | ESCC | lysosomal transport | 83/8552 | 114/18723 | 3.52e-09 | 7.41e-08 | 83 |
| GO:00726659 | Esophagus | ESCC | protein localization to vacuole | 52/8552 | 67/18723 | 9.14e-08 | 1.52e-06 | 52 |
| GO:00091002 | Esophagus | ESCC | glycoprotein metabolic process | 226/8552 | 387/18723 | 2.64e-07 | 3.94e-06 | 226 |
| GO:00066238 | Esophagus | ESCC | protein targeting to vacuole | 31/8552 | 37/18723 | 1.95e-06 | 2.26e-05 | 31 |
| GO:00700854 | Esophagus | ESCC | glycosylation | 144/8552 | 240/18723 | 5.12e-06 | 5.38e-05 | 144 |
| GO:00070403 | Esophagus | ESCC | lysosome organization | 53/8552 | 74/18723 | 5.34e-06 | 5.57e-05 | 53 |
| GO:00801713 | Esophagus | ESCC | lytic vacuole organization | 53/8552 | 74/18723 | 5.34e-06 | 5.57e-05 | 53 |
| GO:00064865 | Esophagus | ESCC | protein glycosylation | 135/8552 | 226/18723 | 1.36e-05 | 1.24e-04 | 135 |
| GO:00434135 | Esophagus | ESCC | macromolecule glycosylation | 135/8552 | 226/18723 | 1.36e-05 | 1.24e-04 | 135 |
| GO:00726668 | Esophagus | ESCC | establishment of protein localization to vacuole | 37/8552 | 49/18723 | 2.05e-05 | 1.78e-04 | 37 |
| GO:00091012 | Esophagus | ESCC | glycoprotein biosynthetic process | 181/8552 | 317/18723 | 2.54e-05 | 2.15e-04 | 181 |
| GO:00066226 | Esophagus | ESCC | protein targeting to lysosome | 20/8552 | 23/18723 | 4.97e-05 | 3.86e-04 | 20 |
| GO:00614626 | Esophagus | ESCC | protein localization to lysosome | 34/8552 | 46/18723 | 9.39e-05 | 6.70e-04 | 34 |
| GO:000930617 | Esophagus | ESCC | protein secretion | 190/8552 | 359/18723 | 3.22e-03 | 1.34e-02 | 190 |
| GO:003559217 | Esophagus | ESCC | establishment of protein localization to extracellular region | 190/8552 | 360/18723 | 3.77e-03 | 1.53e-02 | 190 |
| GO:007169210 | Esophagus | ESCC | protein localization to extracellular region | 193/8552 | 368/18723 | 5.01e-03 | 1.92e-02 | 193 |
| Page: 1 2 3 |
| Pathway ID | Tissue | Disease Stage | Description | Gene Ratio | Bg Ratio | pvalue | p.adjust | qvalue | Count |
| hsa0414222 | Esophagus | ESCC | Lysosome | 102/4205 | 132/8465 | 5.11e-11 | 7.13e-10 | 3.65e-10 | 102 |
| hsa0414232 | Esophagus | ESCC | Lysosome | 102/4205 | 132/8465 | 5.11e-11 | 7.13e-10 | 3.65e-10 | 102 |
| hsa041422 | Liver | HCC | Lysosome | 100/4020 | 132/8465 | 2.32e-11 | 4.31e-10 | 2.40e-10 | 100 |
| hsa041423 | Liver | HCC | Lysosome | 100/4020 | 132/8465 | 2.32e-11 | 4.31e-10 | 2.40e-10 | 100 |
| hsa041425 | Oral cavity | OSCC | Lysosome | 87/3704 | 132/8465 | 1.97e-07 | 1.35e-06 | 6.86e-07 | 87 |
| hsa0414212 | Oral cavity | OSCC | Lysosome | 87/3704 | 132/8465 | 1.97e-07 | 1.35e-06 | 6.86e-07 | 87 |
| Page: 1 |
Top |
Cell-cell communication analysis |
| Identification of potential cell-cell interactions between two cell types and their ligand-receptor pairs for different disease states |
| Ligand | Receptor | LRpair | Pathway | Tissue | Disease Stage |
| Page: 1 |
Top |
Single-cell gene regulatory network inference analysis |
| Find out the significant the regulons (TFs) and the target genes of each regulon across cell types for different disease states |
| TF | Cell Type | Tissue | Disease Stage | Target Gene | RSS | Regulon Activity |
| ∗The dot plots of a searched regulon are shown for all cell subpopulations in each disease state of each tissue based on the regulon specific score inferred using pySCENIC and by calculating the average expression. |
| Page: 1 |
Top |
Somatic mutation of malignant transformation related genes |
| Annotation of somatic variants for genes involved in malignant transformation |
| Hugo Symbol | Variant Class | Variant Classification | dbSNP RS | HGVSc | HGVSp | HGVSp Short | SWISSPROT | BIOTYPE | SIFT | PolyPhen | Tumor Sample Barcode | Tissue | Histology | Sex | Age | Stage | Therapy Types | Drugs | Outcome |
| NAGPA | SNV | Missense_Mutation | c.1225N>A | p.Glu409Lys | p.E409K | Q9UK23 | protein_coding | possibly_damaging(0.549) | TCGA-AC-A23H-01 | Breast | breast invasive carcinoma | Female | >=65 | I/II | Unknown | Unknown | PD | ||
| NAGPA | SNV | Missense_Mutation | rs201559606 | c.1504N>C | p.Glu502Gln | p.E502Q | Q9UK23 | protein_coding | probably_damaging(0.915) | TCGA-BH-A18P-01 | Breast | breast invasive carcinoma | Female | <65 | I/II | Unknown | Unknown | PD | |
| NAGPA | SNV | Missense_Mutation | rs762778282 | c.836T>A | p.Val279Glu | p.V279E | Q9UK23 | protein_coding | probably_damaging(0.986) | TCGA-AA-3837-01 | Colorectum | colon adenocarcinoma | Male | >=65 | I/II | Unknown | Unknown | SD | |
| NAGPA | SNV | Missense_Mutation | c.787C>T | p.Arg263Cys | p.R263C | Q9UK23 | protein_coding | probably_damaging(0.998) | TCGA-AD-A5EJ-01 | Colorectum | colon adenocarcinoma | Female | >=65 | I/II | Unknown | Unknown | SD | ||
| NAGPA | SNV | Missense_Mutation | rs765209071 | c.1525N>A | p.Ala509Thr | p.A509T | Q9UK23 | protein_coding | benign(0) | TCGA-D5-6928-01 | Colorectum | colon adenocarcinoma | Male | >=65 | I/II | Unknown | Unknown | SD | |
| NAGPA | SNV | Missense_Mutation | novel | c.1441N>T | p.Arg481Cys | p.R481C | Q9UK23 | protein_coding | benign(0.332) | TCGA-A5-A0G2-01 | Endometrium | uterine corpus endometrioid carcinoma | Female | <65 | III/IV | Unknown | Unknown | SD | |
| NAGPA | SNV | Missense_Mutation | novel | c.1246N>T | p.Pro416Ser | p.P416S | Q9UK23 | protein_coding | probably_damaging(0.942) | TCGA-A5-A0G2-01 | Endometrium | uterine corpus endometrioid carcinoma | Female | <65 | III/IV | Unknown | Unknown | SD | |
| NAGPA | SNV | Missense_Mutation | c.1301A>C | p.Glu434Ala | p.E434A | Q9UK23 | protein_coding | benign(0) | TCGA-AP-A0LF-01 | Endometrium | uterine corpus endometrioid carcinoma | Female | >=65 | III/IV | Unknown | Unknown | SD | ||
| NAGPA | SNV | Missense_Mutation | novel | c.1412N>C | p.Leu471Ser | p.L471S | Q9UK23 | protein_coding | possibly_damaging(0.518) | TCGA-AX-A3FS-01 | Endometrium | uterine corpus endometrioid carcinoma | Female | >=65 | I/II | Unknown | Unknown | SD | |
| NAGPA | SNV | Missense_Mutation | rs199604440 | c.1345N>A | p.Ala449Thr | p.A449T | Q9UK23 | protein_coding | benign(0) | TCGA-D1-A17A-01 | Endometrium | uterine corpus endometrioid carcinoma | Female | <65 | I/II | Unknown | Unknown | SD |
| Page: 1 2 3 |
Top |
Related drugs of malignant transformation related genes |
| Identification of chemicals and drugs interact with genes involved in malignant transfromation |
| (DGIdb 4.0) |
| Entrez ID | Symbol | Category | Interaction Types | Drug Claim Name | Drug Name | PMIDs |
| Page: 1 |

Copyright 2023-Present -The University of Texas Health Science Center at Houston |