
|
|||||
|
 | |
| |
| |
| |
| |
| |
|
Gene: NAGLU |
Gene summary for NAGLU |
| Gene information | Species | Human | Gene symbol | NAGLU | Gene ID | 4669 |
| Gene name | N-acetyl-alpha-glucosaminidase | |
| Gene Alias | CMT2V | |
| Cytomap | 17q21.2 | |
| Gene Type | protein-coding | GO ID | GO:0001654 | UniProtAcc | A0A140VJE4 |
Top |
Malignant transformation analysis |
| Identification of the aberrant gene expression in precancerous and cancerous lesions by comparing the gene expression of stem-like cells in diseased tissues with normal stem cells |
| Entrez ID | Symbol | Replicates | Species | Organ | Tissue | Adj P-value | Log2FC | Malignancy |
| 4669 | NAGLU | HCC1_Meng | Human | Liver | HCC | 6.46e-61 | 2.00e-01 | 0.0246 |
| 4669 | NAGLU | HCC2_Meng | Human | Liver | HCC | 8.31e-16 | 1.44e-01 | 0.0107 |
| 4669 | NAGLU | HCC2 | Human | Liver | HCC | 7.73e-04 | 1.53e+00 | 0.5341 |
| 4669 | NAGLU | Pt13.b | Human | Liver | HCC | 2.19e-04 | 1.41e-01 | 0.0251 |
| 4669 | NAGLU | S014 | Human | Liver | HCC | 2.72e-02 | 2.31e-01 | 0.2254 |
| 4669 | NAGLU | S015 | Human | Liver | HCC | 8.73e-03 | 2.77e-01 | 0.2375 |
| 4669 | NAGLU | S016 | Human | Liver | HCC | 3.30e-06 | 2.64e-01 | 0.2243 |
| 4669 | NAGLU | S027 | Human | Liver | HCC | 6.59e-04 | 4.85e-01 | 0.2446 |
| 4669 | NAGLU | S028 | Human | Liver | HCC | 6.41e-22 | 6.21e-01 | 0.2503 |
| 4669 | NAGLU | S029 | Human | Liver | HCC | 1.78e-12 | 5.34e-01 | 0.2581 |
| 4669 | NAGLU | C04 | Human | Oral cavity | OSCC | 1.88e-04 | 2.57e-01 | 0.2633 |
| 4669 | NAGLU | C21 | Human | Oral cavity | OSCC | 1.15e-06 | 1.90e-01 | 0.2678 |
| 4669 | NAGLU | C30 | Human | Oral cavity | OSCC | 7.73e-28 | 1.31e+00 | 0.3055 |
| 4669 | NAGLU | C51 | Human | Oral cavity | OSCC | 1.08e-08 | 5.45e-01 | 0.2674 |
| 4669 | NAGLU | C06 | Human | Oral cavity | OSCC | 4.46e-02 | 5.45e-01 | 0.2699 |
| 4669 | NAGLU | C08 | Human | Oral cavity | OSCC | 1.27e-16 | 3.44e-01 | 0.1919 |
| 4669 | NAGLU | LN46 | Human | Oral cavity | OSCC | 8.33e-06 | 2.80e-01 | 0.1666 |
| 4669 | NAGLU | SYSMH1 | Human | Oral cavity | OSCC | 8.86e-14 | 2.71e-01 | 0.1127 |
| 4669 | NAGLU | SYSMH2 | Human | Oral cavity | OSCC | 3.86e-20 | 3.91e-01 | 0.2326 |
| 4669 | NAGLU | SYSMH3 | Human | Oral cavity | OSCC | 1.43e-15 | 3.41e-01 | 0.2442 |
| Page: 1 2 |
| Tissue | Expression Dynamics | Abbreviation |
| Liver | 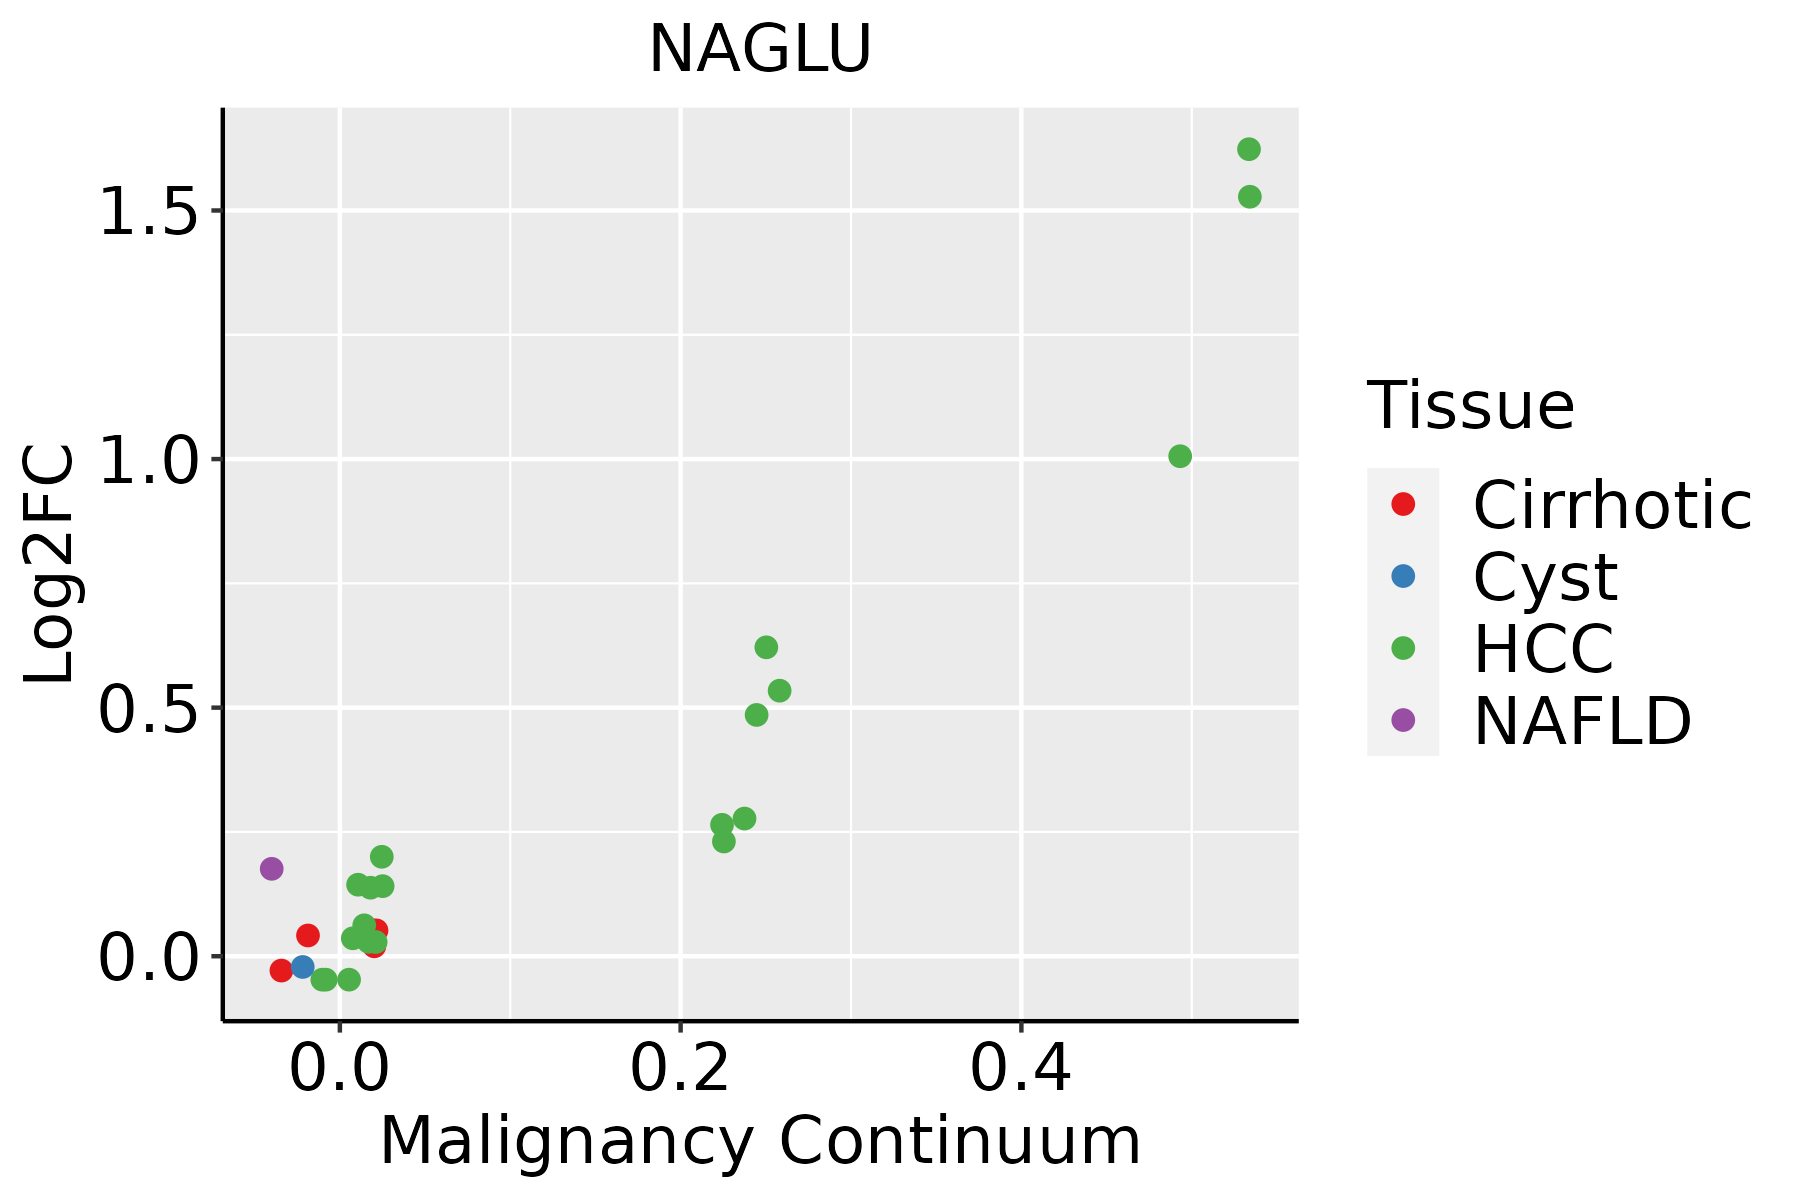 | HCC: Hepatocellular carcinoma |
| NAFLD: Non-alcoholic fatty liver disease | ||
| Oral Cavity | 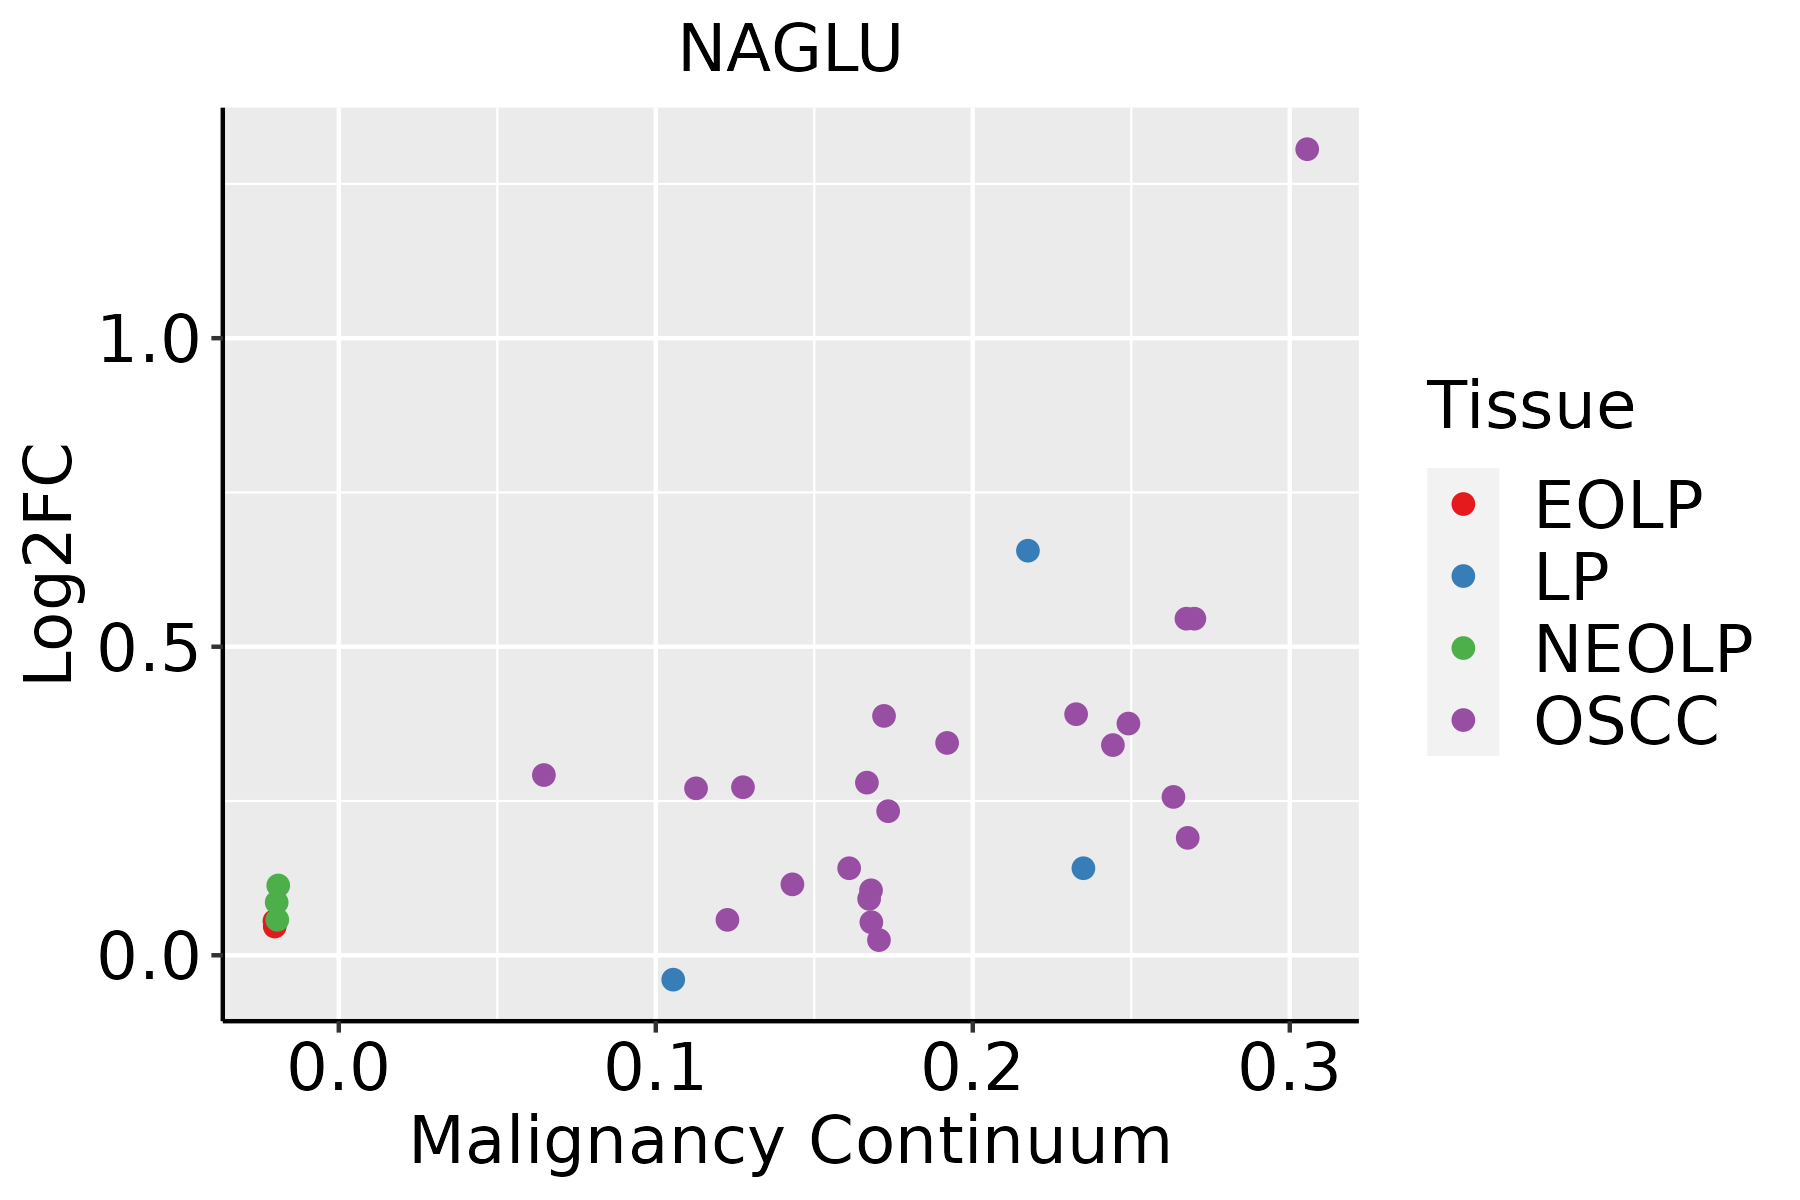 | EOLP: Erosive Oral lichen planus |
| LP: leukoplakia | ||
| NEOLP: Non-erosive oral lichen planus | ||
| OSCC: Oral squamous cell carcinoma | ||
| Thyroid | 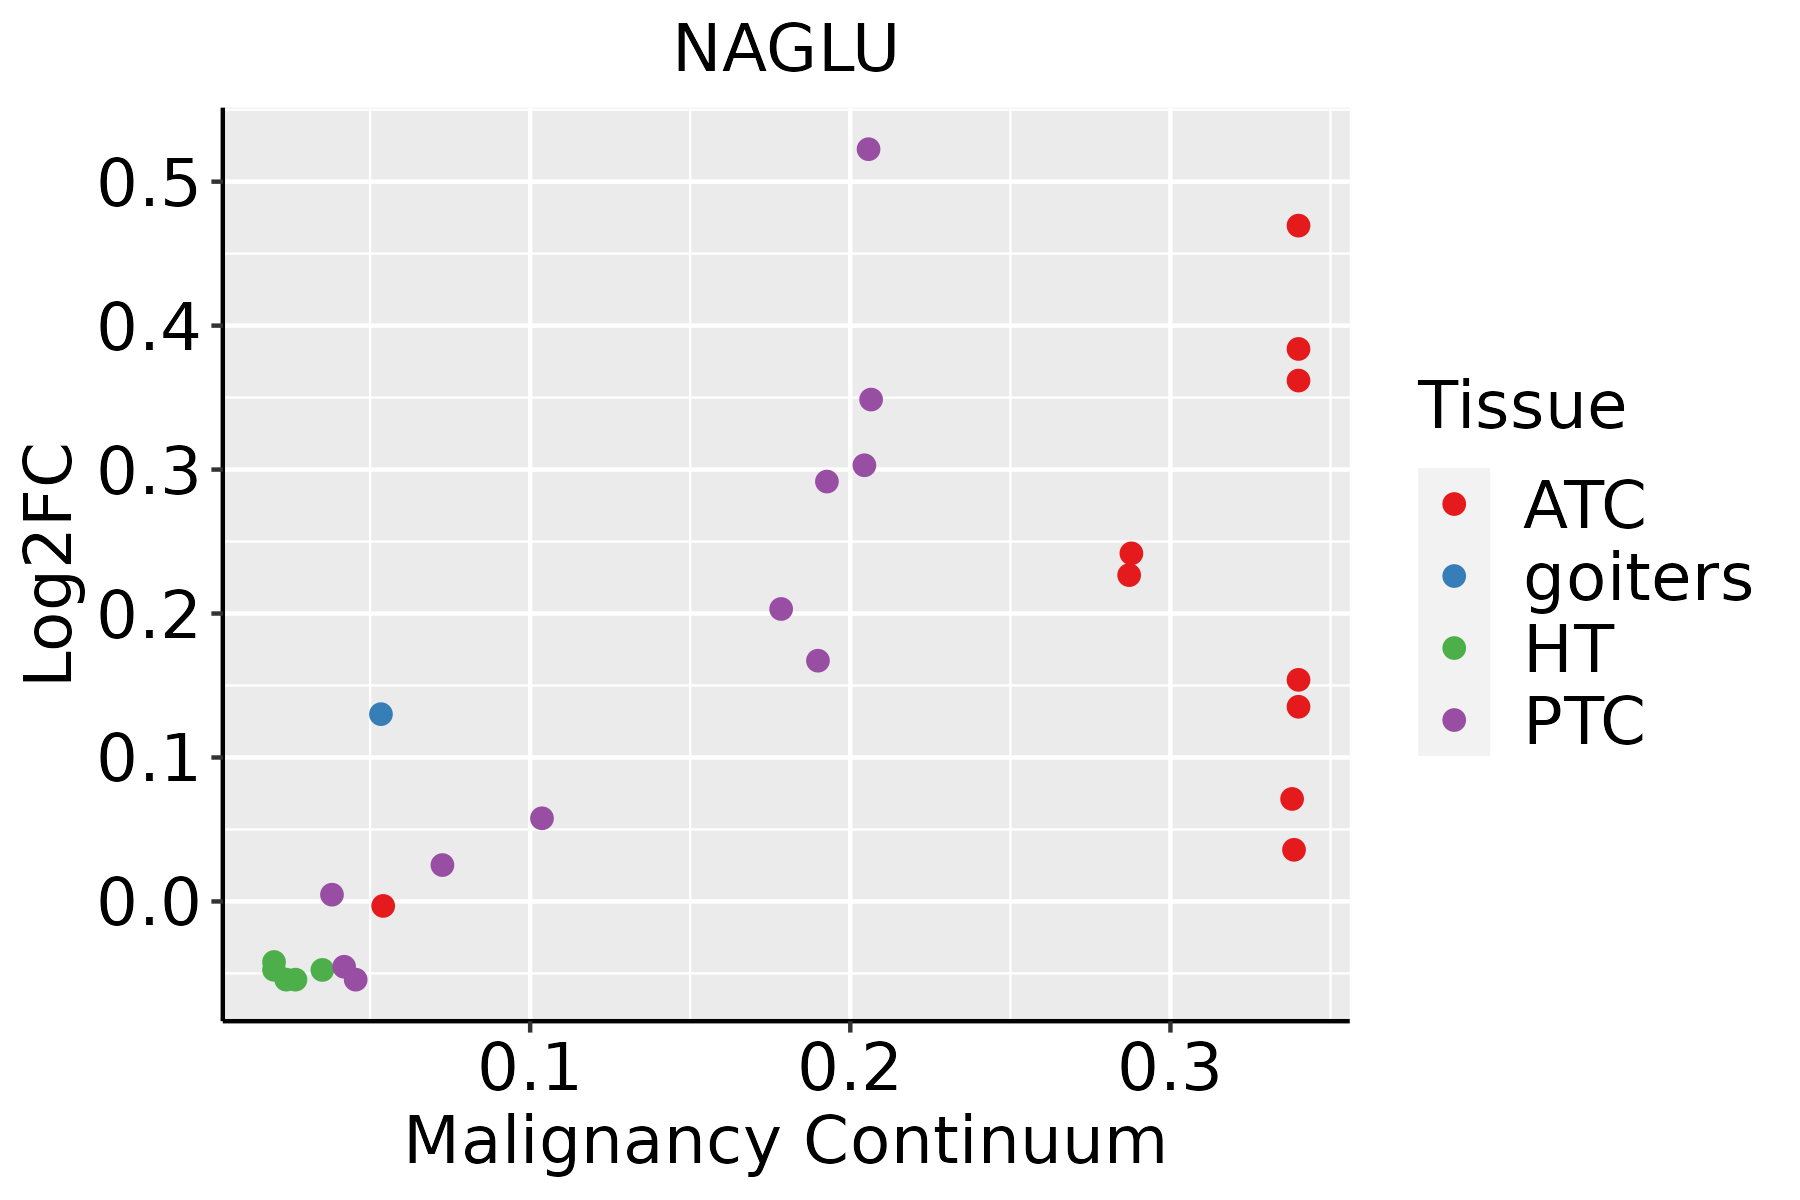 | ATC: Anaplastic thyroid cancer |
| HT: Hashimoto's thyroiditis | ||
| PTC: Papillary thyroid cancer |
| ∗log2FC in expression of this searched gene in stem-like cells from each diseased tissue sample relative to stem-like cells in normal samples in each tissue plotted against the malignancy continuum. Samples are colored based on if they are from different disease stage. |
Top |
Malignant transformation related pathway analysis |
| Find out the enriched GO biological processes and KEGG pathways involved in transition from healthy to precancer to cancer |
| Tissue | Disease Stage | Enriched GO biological Processes |
| Colorectum | AD |  |
| Colorectum | SER |  |
| Colorectum | MSS |  |
| Colorectum | MSI-H |  |
| Colorectum | FAP |  |
| ∗Top 15 enriched GO BP terms are showed in the bar plot of each disease state in each tissue. Each row represents a significant GO biological process which is colored according to the -log10(p.adjust). |
| Page: 1 2 3 4 5 6 7 8 9 |
| GO ID | Tissue | Disease Stage | Description | Gene Ratio | Bg Ratio | pvalue | p.adjust | Count |
| GO:000703311 | Liver | HCC | vacuole organization | 119/7958 | 180/18723 | 1.22e-10 | 4.25e-09 | 119 |
| GO:000762321 | Liver | HCC | circadian rhythm | 117/7958 | 210/18723 | 7.29e-05 | 6.54e-04 | 117 |
| GO:1901136 | Liver | HCC | carbohydrate derivative catabolic process | 98/7958 | 172/18723 | 8.71e-05 | 7.62e-04 | 98 |
| GO:00070401 | Liver | HCC | lysosome organization | 47/7958 | 74/18723 | 2.13e-04 | 1.63e-03 | 47 |
| GO:00801711 | Liver | HCC | lytic vacuole organization | 47/7958 | 74/18723 | 2.13e-04 | 1.63e-03 | 47 |
| GO:004851121 | Liver | HCC | rhythmic process | 156/7958 | 298/18723 | 3.54e-04 | 2.46e-03 | 156 |
| GO:00070335 | Oral cavity | OSCC | vacuole organization | 115/7305 | 180/18723 | 1.11e-11 | 4.00e-10 | 115 |
| GO:00070402 | Oral cavity | OSCC | lysosome organization | 51/7305 | 74/18723 | 1.77e-07 | 2.87e-06 | 51 |
| GO:00801712 | Oral cavity | OSCC | lytic vacuole organization | 51/7305 | 74/18723 | 1.77e-07 | 2.87e-06 | 51 |
| GO:004851116 | Oral cavity | OSCC | rhythmic process | 157/7305 | 298/18723 | 1.00e-06 | 1.36e-05 | 157 |
| GO:000762316 | Oral cavity | OSCC | circadian rhythm | 110/7305 | 210/18723 | 5.40e-05 | 4.48e-04 | 110 |
| GO:19011361 | Oral cavity | OSCC | carbohydrate derivative catabolic process | 89/7305 | 172/18723 | 4.52e-04 | 2.73e-03 | 89 |
| GO:000703315 | Thyroid | PTC | vacuole organization | 96/5968 | 180/18723 | 1.80e-09 | 5.13e-08 | 96 |
| GO:0048511111 | Thyroid | PTC | rhythmic process | 131/5968 | 298/18723 | 7.06e-06 | 8.33e-05 | 131 |
| GO:0007623111 | Thyroid | PTC | circadian rhythm | 96/5968 | 210/18723 | 1.74e-05 | 1.82e-04 | 96 |
| GO:00070405 | Thyroid | PTC | lysosome organization | 38/5968 | 74/18723 | 3.84e-04 | 2.58e-03 | 38 |
| GO:00801715 | Thyroid | PTC | lytic vacuole organization | 38/5968 | 74/18723 | 3.84e-04 | 2.58e-03 | 38 |
| GO:000703322 | Thyroid | ATC | vacuole organization | 100/6293 | 180/18723 | 1.07e-09 | 2.71e-08 | 100 |
| GO:004851124 | Thyroid | ATC | rhythmic process | 141/6293 | 298/18723 | 5.58e-07 | 7.93e-06 | 141 |
| GO:000762325 | Thyroid | ATC | circadian rhythm | 100/6293 | 210/18723 | 1.67e-05 | 1.54e-04 | 100 |
| Page: 1 2 |
| Pathway ID | Tissue | Disease Stage | Description | Gene Ratio | Bg Ratio | pvalue | p.adjust | qvalue | Count |
| hsa041422 | Liver | HCC | Lysosome | 100/4020 | 132/8465 | 2.32e-11 | 4.31e-10 | 2.40e-10 | 100 |
| hsa041423 | Liver | HCC | Lysosome | 100/4020 | 132/8465 | 2.32e-11 | 4.31e-10 | 2.40e-10 | 100 |
| hsa041425 | Oral cavity | OSCC | Lysosome | 87/3704 | 132/8465 | 1.97e-07 | 1.35e-06 | 6.86e-07 | 87 |
| hsa0414212 | Oral cavity | OSCC | Lysosome | 87/3704 | 132/8465 | 1.97e-07 | 1.35e-06 | 6.86e-07 | 87 |
| Page: 1 |
Top |
Cell-cell communication analysis |
| Identification of potential cell-cell interactions between two cell types and their ligand-receptor pairs for different disease states |
| Ligand | Receptor | LRpair | Pathway | Tissue | Disease Stage |
| Page: 1 |
Top |
Single-cell gene regulatory network inference analysis |
| Find out the significant the regulons (TFs) and the target genes of each regulon across cell types for different disease states |
| TF | Cell Type | Tissue | Disease Stage | Target Gene | RSS | Regulon Activity |
| ∗The dot plots of a searched regulon are shown for all cell subpopulations in each disease state of each tissue based on the regulon specific score inferred using pySCENIC and by calculating the average expression. |
| Page: 1 |
Top |
Somatic mutation of malignant transformation related genes |
| Annotation of somatic variants for genes involved in malignant transformation |
| Hugo Symbol | Variant Class | Variant Classification | dbSNP RS | HGVSc | HGVSp | HGVSp Short | SWISSPROT | BIOTYPE | SIFT | PolyPhen | Tumor Sample Barcode | Tissue | Histology | Sex | Age | Stage | Therapy Types | Drugs | Outcome |
| NAGLU | SNV | Missense_Mutation | rs779942563 | c.2144N>C | p.Tyr715Ser | p.Y715S | P54802 | protein_coding | deleterious(0) | probably_damaging(0.967) | TCGA-A7-A0DA-01 | Breast | breast invasive carcinoma | Female | <65 | I/II | Chemotherapy | adriamycin | SD |
| NAGLU | SNV | Missense_Mutation | novel | c.1448N>G | p.Tyr483Cys | p.Y483C | P54802 | protein_coding | deleterious(0) | probably_damaging(1) | TCGA-A8-A07R-01 | Breast | breast invasive carcinoma | Female | >=65 | III/IV | Ancillary | zoledronic | SD |
| NAGLU | insertion | Frame_Shift_Ins | novel | c.1376_1377insCAGGAAGGGAACAGATCAGCTCAGCCTTTCT | p.Glu460ArgfsTer11 | p.E460Rfs*11 | P54802 | protein_coding | TCGA-A2-A0CX-01 | Breast | breast invasive carcinoma | Female | <65 | I/II | Chemotherapy | adriamycin | SD | ||
| NAGLU | insertion | Frame_Shift_Ins | novel | c.394_395insGTTTC | p.Tyr132CysfsTer25 | p.Y132Cfs*25 | P54802 | protein_coding | TCGA-A8-A06X-01 | Breast | breast invasive carcinoma | Female | >=65 | I/II | Unknown | Unknown | SD | ||
| NAGLU | insertion | In_Frame_Ins | novel | c.395_396insCCGTGTTAG | p.Tyr132_Gln133insArgValSer | p.Y132_Q133insRVS | P54802 | protein_coding | TCGA-A8-A06X-01 | Breast | breast invasive carcinoma | Female | >=65 | I/II | Unknown | Unknown | SD | ||
| NAGLU | insertion | Frame_Shift_Ins | novel | c.1278_1279insTGGAGCACAGTGGCACAATCTCATCTCACTGCAACCTTCGTCT | p.Pro427TrpfsTer48 | p.P427Wfs*48 | P54802 | protein_coding | TCGA-AN-A0AM-01 | Breast | breast invasive carcinoma | Female | <65 | I/II | Unknown | Unknown | SD | ||
| NAGLU | insertion | Frame_Shift_Ins | novel | c.901_902insTC | p.Lys301IlefsTer39 | p.K301Ifs*39 | P54802 | protein_coding | TCGA-AO-A0JM-01 | Breast | breast invasive carcinoma | Female | <65 | I/II | Chemotherapy | doxorubicin | SD | ||
| NAGLU | insertion | Nonsense_Mutation | novel | c.903_904insGATCACGCCATTGCACTCCAGCCTGGGTGAC | p.Glu302AspfsTer10 | p.E302Dfs*10 | P54802 | protein_coding | TCGA-AO-A0JM-01 | Breast | breast invasive carcinoma | Female | <65 | I/II | Chemotherapy | doxorubicin | SD | ||
| NAGLU | SNV | Missense_Mutation | novel | c.1955N>C | p.Glu652Ala | p.E652A | P54802 | protein_coding | tolerated(0.41) | benign(0.061) | TCGA-DS-A1OB-01 | Cervix | cervical & endocervical cancer | Female | <65 | I/II | Chemotherapy | carboplatin | PD |
| NAGLU | SNV | Missense_Mutation | rs781410675 | c.2125N>A | p.Val709Ile | p.V709I | P54802 | protein_coding | tolerated(0.43) | benign(0.012) | TCGA-EA-A3HS-01 | Cervix | cervical & endocervical cancer | Female | <65 | I/II | Unknown | Unknown | SD |
| Page: 1 2 3 4 5 6 |
Top |
Related drugs of malignant transformation related genes |
| Identification of chemicals and drugs interact with genes involved in malignant transfromation |
| (DGIdb 4.0) |
| Entrez ID | Symbol | Category | Interaction Types | Drug Claim Name | Drug Name | PMIDs |
| 4669 | NAGLU | ENZYME, DRUGGABLE GENOME | N-Acetyl-D-glucosamine |
| Page: 1 |

Copyright 2023-Present -The University of Texas Health Science Center at Houston |