
|
|||||
|
 | |
| |
| |
| |
| |
| |
|
Gene: NAGK |
Gene summary for NAGK |
| Gene information | Species | Human | Gene symbol | NAGK | Gene ID | 55577 |
| Gene name | N-acetylglucosamine kinase | |
| Gene Alias | GNK | |
| Cytomap | 2p13.3 | |
| Gene Type | protein-coding | GO ID | GO:0005975 | UniProtAcc | C9JEV6 |
Top |
Malignant transformation analysis |
| Identification of the aberrant gene expression in precancerous and cancerous lesions by comparing the gene expression of stem-like cells in diseased tissues with normal stem cells |
| Entrez ID | Symbol | Replicates | Species | Organ | Tissue | Adj P-value | Log2FC | Malignancy |
| 55577 | NAGK | LZE4T | Human | Esophagus | ESCC | 6.20e-13 | 3.17e-01 | 0.0811 |
| 55577 | NAGK | LZE5T | Human | Esophagus | ESCC | 1.71e-03 | 4.10e-01 | 0.0514 |
| 55577 | NAGK | LZE7T | Human | Esophagus | ESCC | 3.70e-07 | 2.87e-01 | 0.0667 |
| 55577 | NAGK | LZE8T | Human | Esophagus | ESCC | 1.32e-04 | 1.42e-01 | 0.067 |
| 55577 | NAGK | LZE20T | Human | Esophagus | ESCC | 3.61e-03 | 1.49e-01 | 0.0662 |
| 55577 | NAGK | LZE22T | Human | Esophagus | ESCC | 2.33e-05 | 4.34e-01 | 0.068 |
| 55577 | NAGK | LZE24T | Human | Esophagus | ESCC | 5.49e-15 | 4.10e-01 | 0.0596 |
| 55577 | NAGK | LZE21T | Human | Esophagus | ESCC | 6.98e-04 | 5.59e-01 | 0.0655 |
| 55577 | NAGK | LZE6T | Human | Esophagus | ESCC | 2.22e-04 | 2.01e-01 | 0.0845 |
| 55577 | NAGK | P1T-E | Human | Esophagus | ESCC | 2.38e-04 | 3.99e-01 | 0.0875 |
| 55577 | NAGK | P2T-E | Human | Esophagus | ESCC | 5.13e-28 | 7.03e-01 | 0.1177 |
| 55577 | NAGK | P4T-E | Human | Esophagus | ESCC | 1.27e-31 | 6.66e-01 | 0.1323 |
| 55577 | NAGK | P5T-E | Human | Esophagus | ESCC | 1.30e-20 | 4.32e-01 | 0.1327 |
| 55577 | NAGK | P8T-E | Human | Esophagus | ESCC | 5.57e-20 | 4.17e-01 | 0.0889 |
| 55577 | NAGK | P9T-E | Human | Esophagus | ESCC | 4.18e-15 | 3.05e-01 | 0.1131 |
| 55577 | NAGK | P10T-E | Human | Esophagus | ESCC | 1.55e-19 | 4.52e-01 | 0.116 |
| 55577 | NAGK | P11T-E | Human | Esophagus | ESCC | 3.53e-18 | 6.77e-01 | 0.1426 |
| 55577 | NAGK | P12T-E | Human | Esophagus | ESCC | 3.34e-27 | 5.30e-01 | 0.1122 |
| 55577 | NAGK | P15T-E | Human | Esophagus | ESCC | 8.64e-24 | 4.63e-01 | 0.1149 |
| 55577 | NAGK | P16T-E | Human | Esophagus | ESCC | 2.53e-21 | 4.73e-01 | 0.1153 |
| Page: 1 2 3 4 5 6 |
| Tissue | Expression Dynamics | Abbreviation |
| Esophagus | 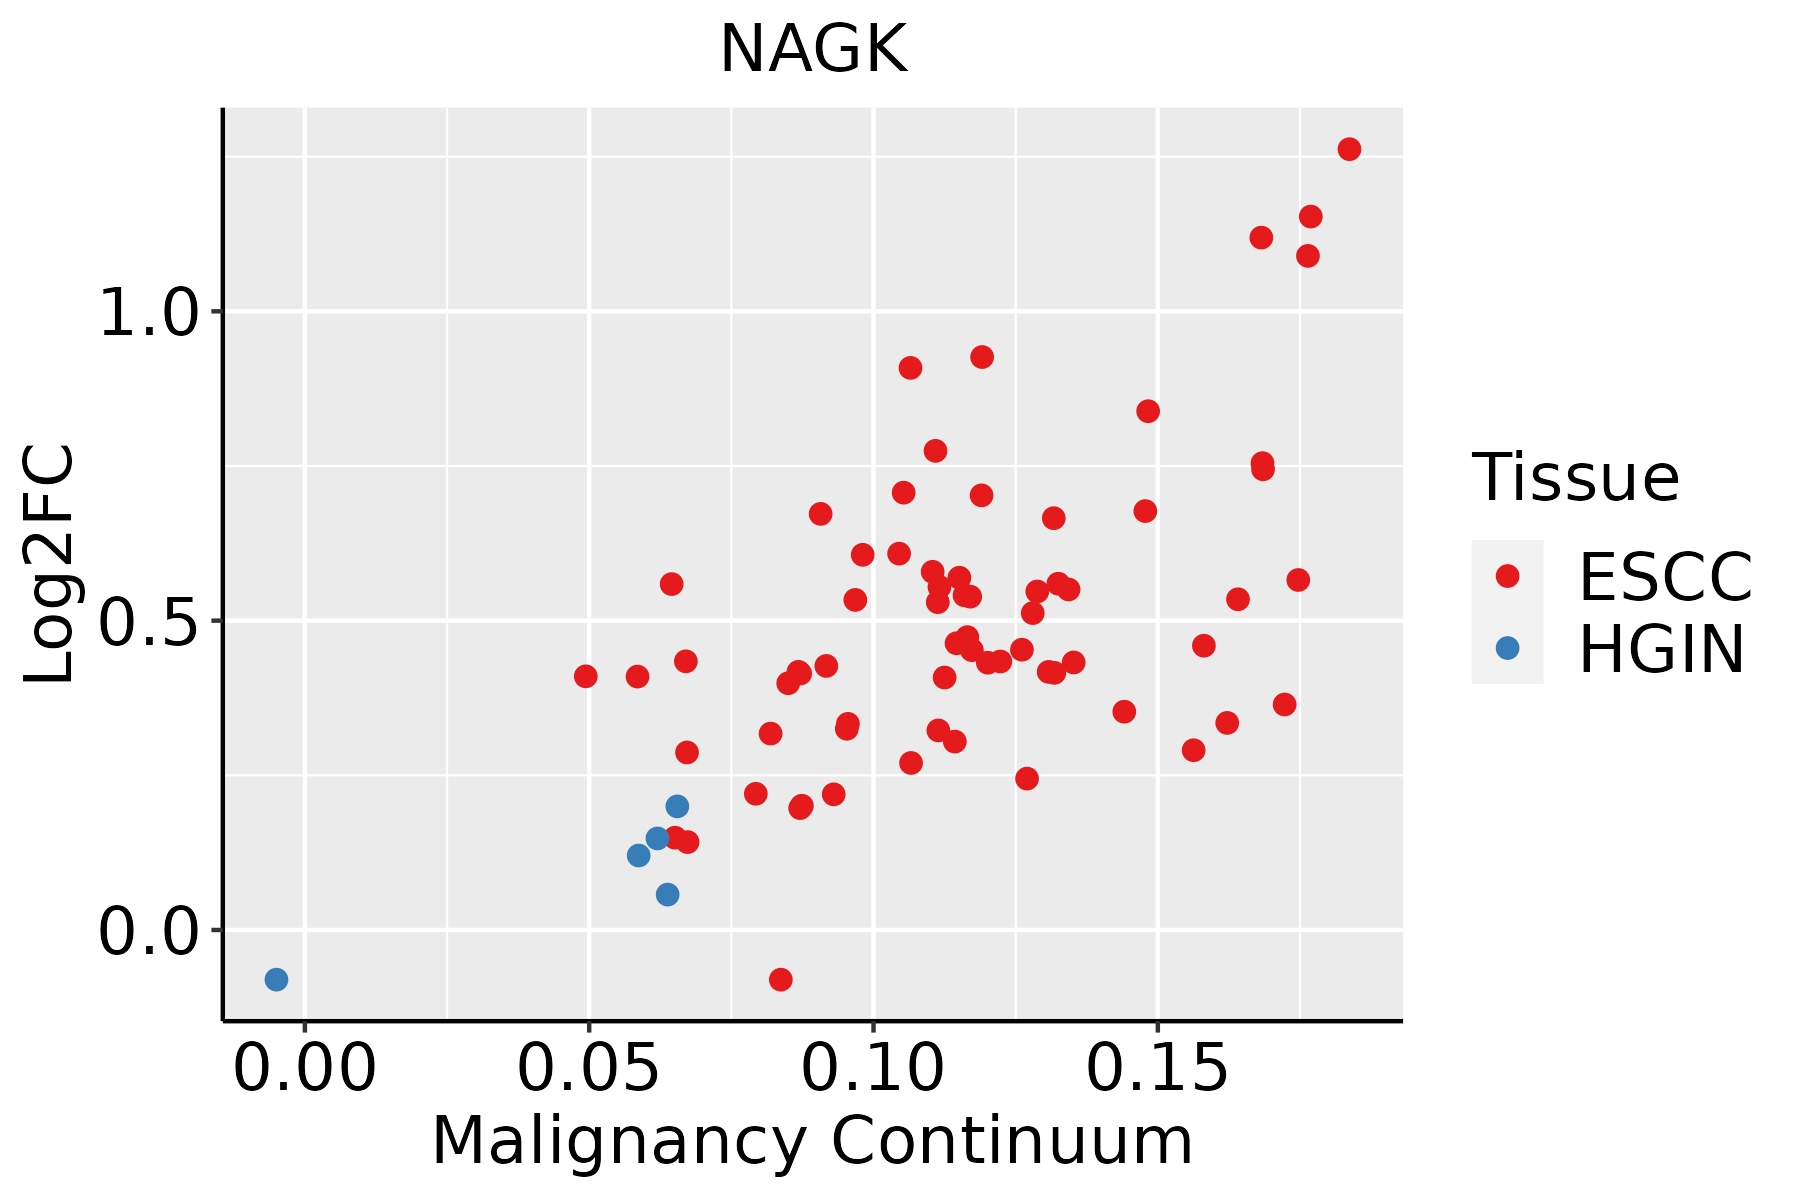 | ESCC: Esophageal squamous cell carcinoma |
| HGIN: High-grade intraepithelial neoplasias | ||
| LGIN: Low-grade intraepithelial neoplasias | ||
| Oral Cavity |  | EOLP: Erosive Oral lichen planus |
| LP: leukoplakia | ||
| NEOLP: Non-erosive oral lichen planus | ||
| OSCC: Oral squamous cell carcinoma | ||
| Skin |  | AK: Actinic keratosis |
| cSCC: Cutaneous squamous cell carcinoma | ||
| SCCIS:squamous cell carcinoma in situ | ||
| Thyroid |  | ATC: Anaplastic thyroid cancer |
| HT: Hashimoto's thyroiditis | ||
| PTC: Papillary thyroid cancer |
| ∗log2FC in expression of this searched gene in stem-like cells from each diseased tissue sample relative to stem-like cells in normal samples in each tissue plotted against the malignancy continuum. Samples are colored based on if they are from different disease stage. |
Top |
Malignant transformation related pathway analysis |
| Find out the enriched GO biological processes and KEGG pathways involved in transition from healthy to precancer to cancer |
| Tissue | Disease Stage | Enriched GO biological Processes |
| Colorectum | AD |  |
| Colorectum | SER |  |
| Colorectum | MSS |  |
| Colorectum | MSI-H |  |
| Colorectum | FAP |  |
| ∗Top 15 enriched GO BP terms are showed in the bar plot of each disease state in each tissue. Each row represents a significant GO biological process which is colored according to the -log10(p.adjust). |
| Page: 1 2 3 4 5 6 7 8 9 |
| GO ID | Tissue | Disease Stage | Description | Gene Ratio | Bg Ratio | pvalue | p.adjust | Count |
| GO:00442626 | Esophagus | ESCC | cellular carbohydrate metabolic process | 160/8552 | 283/18723 | 1.43e-04 | 9.66e-04 | 160 |
| GO:19011362 | Esophagus | ESCC | carbohydrate derivative catabolic process | 99/8552 | 172/18723 | 1.11e-03 | 5.54e-03 | 99 |
| GO:00442827 | Esophagus | ESCC | small molecule catabolic process | 201/8552 | 376/18723 | 1.35e-03 | 6.41e-03 | 201 |
| GO:19011361 | Oral cavity | OSCC | carbohydrate derivative catabolic process | 89/7305 | 172/18723 | 4.52e-04 | 2.73e-03 | 89 |
| GO:00442826 | Oral cavity | OSCC | small molecule catabolic process | 174/7305 | 376/18723 | 2.25e-03 | 1.00e-02 | 174 |
| GO:00442625 | Oral cavity | OSCC | cellular carbohydrate metabolic process | 130/7305 | 283/18723 | 9.98e-03 | 3.49e-02 | 130 |
| GO:0006040 | Oral cavity | OSCC | amino sugar metabolic process | 24/7305 | 42/18723 | 1.30e-02 | 4.34e-02 | 24 |
| GO:0046348 | Oral cavity | OSCC | amino sugar catabolic process | 10/7305 | 14/18723 | 1.44e-02 | 4.69e-02 | 10 |
| GO:19011363 | Thyroid | ATC | carbohydrate derivative catabolic process | 73/6293 | 172/18723 | 9.43e-03 | 3.47e-02 | 73 |
| Page: 1 |
| Pathway ID | Tissue | Disease Stage | Description | Gene Ratio | Bg Ratio | pvalue | p.adjust | qvalue | Count |
| hsa012505 | Esophagus | ESCC | Biosynthesis of nucleotide sugars | 28/4205 | 37/8465 | 1.10e-03 | 3.42e-03 | 1.75e-03 | 28 |
| hsa005202 | Esophagus | ESCC | Amino sugar and nucleotide sugar metabolism | 35/4205 | 49/8465 | 1.60e-03 | 4.88e-03 | 2.50e-03 | 35 |
| hsa0125012 | Esophagus | ESCC | Biosynthesis of nucleotide sugars | 28/4205 | 37/8465 | 1.10e-03 | 3.42e-03 | 1.75e-03 | 28 |
| hsa0052011 | Esophagus | ESCC | Amino sugar and nucleotide sugar metabolism | 35/4205 | 49/8465 | 1.60e-03 | 4.88e-03 | 2.50e-03 | 35 |
| hsa00520 | Oral cavity | OSCC | Amino sugar and nucleotide sugar metabolism | 34/3704 | 49/8465 | 2.48e-04 | 8.08e-04 | 4.11e-04 | 34 |
| hsa012504 | Oral cavity | OSCC | Biosynthesis of nucleotide sugars | 25/3704 | 37/8465 | 2.93e-03 | 7.49e-03 | 3.81e-03 | 25 |
| hsa005201 | Oral cavity | OSCC | Amino sugar and nucleotide sugar metabolism | 34/3704 | 49/8465 | 2.48e-04 | 8.08e-04 | 4.11e-04 | 34 |
| hsa0125011 | Oral cavity | OSCC | Biosynthesis of nucleotide sugars | 25/3704 | 37/8465 | 2.93e-03 | 7.49e-03 | 3.81e-03 | 25 |
| Page: 1 |
Top |
Cell-cell communication analysis |
| Identification of potential cell-cell interactions between two cell types and their ligand-receptor pairs for different disease states |
| Ligand | Receptor | LRpair | Pathway | Tissue | Disease Stage |
| Page: 1 |
Top |
Single-cell gene regulatory network inference analysis |
| Find out the significant the regulons (TFs) and the target genes of each regulon across cell types for different disease states |
| TF | Cell Type | Tissue | Disease Stage | Target Gene | RSS | Regulon Activity |
| ∗The dot plots of a searched regulon are shown for all cell subpopulations in each disease state of each tissue based on the regulon specific score inferred using pySCENIC and by calculating the average expression. |
| Page: 1 |
Top |
Somatic mutation of malignant transformation related genes |
| Annotation of somatic variants for genes involved in malignant transformation |
| Hugo Symbol | Variant Class | Variant Classification | dbSNP RS | HGVSc | HGVSp | HGVSp Short | SWISSPROT | BIOTYPE | SIFT | PolyPhen | Tumor Sample Barcode | Tissue | Histology | Sex | Age | Stage | Therapy Types | Drugs | Outcome |
| NAGK | SNV | Missense_Mutation | c.835N>C | p.Tyr279His | p.Y279H | Q9UJ70 | protein_coding | tolerated(0.89) | benign(0.007) | TCGA-AO-A0JG-01 | Breast | breast invasive carcinoma | Female | <65 | III/IV | Chemotherapy | doxorubicin | SD | |
| NAGK | SNV | Missense_Mutation | novel | c.1010G>C | p.Arg337Thr | p.R337T | Q9UJ70 | protein_coding | tolerated(0.17) | benign(0.02) | TCGA-AR-A2LE-01 | Breast | breast invasive carcinoma | Female | >=65 | I/II | Hormone Therapy | tamoxiphen | PD |
| NAGK | insertion | Nonsense_Mutation | novel | c.788_789insAAGGTTGATGAGTTTGATAGTTACCTGTGAGGCCCAGTTAGTCTT | p.Cys263delinsTer | p.C263delins* | Q9UJ70 | protein_coding | TCGA-AN-A0FS-01 | Breast | breast invasive carcinoma | Female | <65 | I/II | Unknown | Unknown | SD | ||
| NAGK | insertion | Frame_Shift_Ins | novel | c.550_551insACTTGACGAT | p.Gly184AspfsTer18 | p.G184Dfs*18 | Q9UJ70 | protein_coding | TCGA-AN-A0FX-01 | Breast | breast invasive carcinoma | Female | <65 | I/II | Unknown | Unknown | SD | ||
| NAGK | insertion | Frame_Shift_Ins | novel | c.552_553insCATACGTGCGAAAAGTGCAGAG | p.Ser185HisfsTer21 | p.S185Hfs*21 | Q9UJ70 | protein_coding | TCGA-AN-A0FX-01 | Breast | breast invasive carcinoma | Female | <65 | I/II | Unknown | Unknown | SD | ||
| NAGK | SNV | Missense_Mutation | c.1097N>A | p.Ala366Asp | p.A366D | Q9UJ70 | protein_coding | deleterious(0) | probably_damaging(0.995) | TCGA-AA-3713-01 | Colorectum | colon adenocarcinoma | Male | >=65 | III/IV | Chemotherapy | 5-fluorouracil | PR | |
| NAGK | SNV | Missense_Mutation | rs749039406 | c.758A>G | p.Asp253Gly | p.D253G | Q9UJ70 | protein_coding | deleterious(0.04) | benign(0.065) | TCGA-AA-3949-01 | Colorectum | colon adenocarcinoma | Female | >=65 | III/IV | Unknown | Unknown | SD |
| NAGK | SNV | Missense_Mutation | c.802N>A | p.Glu268Lys | p.E268K | Q9UJ70 | protein_coding | tolerated(0.29) | benign(0.165) | TCGA-AA-A01T-01 | Colorectum | colon adenocarcinoma | Female | <65 | III/IV | Chemotherapy | 5-fluorouracil | CR | |
| NAGK | SNV | Missense_Mutation | c.674N>G | p.His225Arg | p.H225R | Q9UJ70 | protein_coding | deleterious(0.03) | benign(0.145) | TCGA-AZ-6601-01 | Colorectum | colon adenocarcinoma | Male | >=65 | I/II | Unknown | Unknown | PD | |
| NAGK | SNV | Missense_Mutation | novel | c.1035N>A | p.Phe345Leu | p.F345L | Q9UJ70 | protein_coding | tolerated(0.46) | benign(0) | TCGA-CA-6717-01 | Colorectum | colon adenocarcinoma | Male | <65 | I/II | Chemotherapy | oxaliplatin | CR |
| Page: 1 2 3 4 5 |
Top |
Related drugs of malignant transformation related genes |
| Identification of chemicals and drugs interact with genes involved in malignant transfromation |
| (DGIdb 4.0) |
| Entrez ID | Symbol | Category | Interaction Types | Drug Claim Name | Drug Name | PMIDs |
| Page: 1 |

Copyright 2023-Present -The University of Texas Health Science Center at Houston |