
|
|||||
|
 | |
| |
| |
| |
| |
| |
|
Gene: NAGA |
Gene summary for NAGA |
| Gene information | Species | Human | Gene symbol | NAGA | Gene ID | 4668 |
| Gene name | alpha-N-acetylgalactosaminidase | |
| Gene Alias | D22S674 | |
| Cytomap | 22q13.2 | |
| Gene Type | protein-coding | GO ID | GO:0005975 | UniProtAcc | A0A024R1Q5 |
Top |
Malignant transformation analysis |
| Identification of the aberrant gene expression in precancerous and cancerous lesions by comparing the gene expression of stem-like cells in diseased tissues with normal stem cells |
| Entrez ID | Symbol | Replicates | Species | Organ | Tissue | Adj P-value | Log2FC | Malignancy |
| 4668 | NAGA | LZE24T | Human | Esophagus | ESCC | 1.36e-10 | 2.36e-01 | 0.0596 |
| 4668 | NAGA | P1T-E | Human | Esophagus | ESCC | 5.09e-03 | 1.80e-01 | 0.0875 |
| 4668 | NAGA | P2T-E | Human | Esophagus | ESCC | 6.46e-10 | 1.68e-01 | 0.1177 |
| 4668 | NAGA | P4T-E | Human | Esophagus | ESCC | 5.50e-10 | 2.31e-01 | 0.1323 |
| 4668 | NAGA | P5T-E | Human | Esophagus | ESCC | 1.16e-11 | 2.04e-01 | 0.1327 |
| 4668 | NAGA | P8T-E | Human | Esophagus | ESCC | 1.12e-19 | 2.33e-01 | 0.0889 |
| 4668 | NAGA | P9T-E | Human | Esophagus | ESCC | 1.93e-06 | 1.13e-01 | 0.1131 |
| 4668 | NAGA | P10T-E | Human | Esophagus | ESCC | 3.19e-10 | 1.72e-01 | 0.116 |
| 4668 | NAGA | P11T-E | Human | Esophagus | ESCC | 5.18e-04 | 2.38e-01 | 0.1426 |
| 4668 | NAGA | P12T-E | Human | Esophagus | ESCC | 1.58e-15 | 2.82e-01 | 0.1122 |
| 4668 | NAGA | P15T-E | Human | Esophagus | ESCC | 1.75e-13 | 3.87e-01 | 0.1149 |
| 4668 | NAGA | P16T-E | Human | Esophagus | ESCC | 1.96e-17 | 3.35e-01 | 0.1153 |
| 4668 | NAGA | P19T-E | Human | Esophagus | ESCC | 1.16e-02 | 3.03e-01 | 0.1662 |
| 4668 | NAGA | P20T-E | Human | Esophagus | ESCC | 1.96e-05 | 1.17e-01 | 0.1124 |
| 4668 | NAGA | P21T-E | Human | Esophagus | ESCC | 9.85e-13 | 2.32e-01 | 0.1617 |
| 4668 | NAGA | P22T-E | Human | Esophagus | ESCC | 7.36e-20 | 2.90e-01 | 0.1236 |
| 4668 | NAGA | P23T-E | Human | Esophagus | ESCC | 9.75e-07 | 1.65e-01 | 0.108 |
| 4668 | NAGA | P24T-E | Human | Esophagus | ESCC | 3.54e-11 | 1.46e-01 | 0.1287 |
| 4668 | NAGA | P26T-E | Human | Esophagus | ESCC | 6.30e-16 | 2.28e-01 | 0.1276 |
| 4668 | NAGA | P27T-E | Human | Esophagus | ESCC | 1.20e-11 | 1.13e-01 | 0.1055 |
| Page: 1 2 3 4 |
| Tissue | Expression Dynamics | Abbreviation |
| Esophagus | 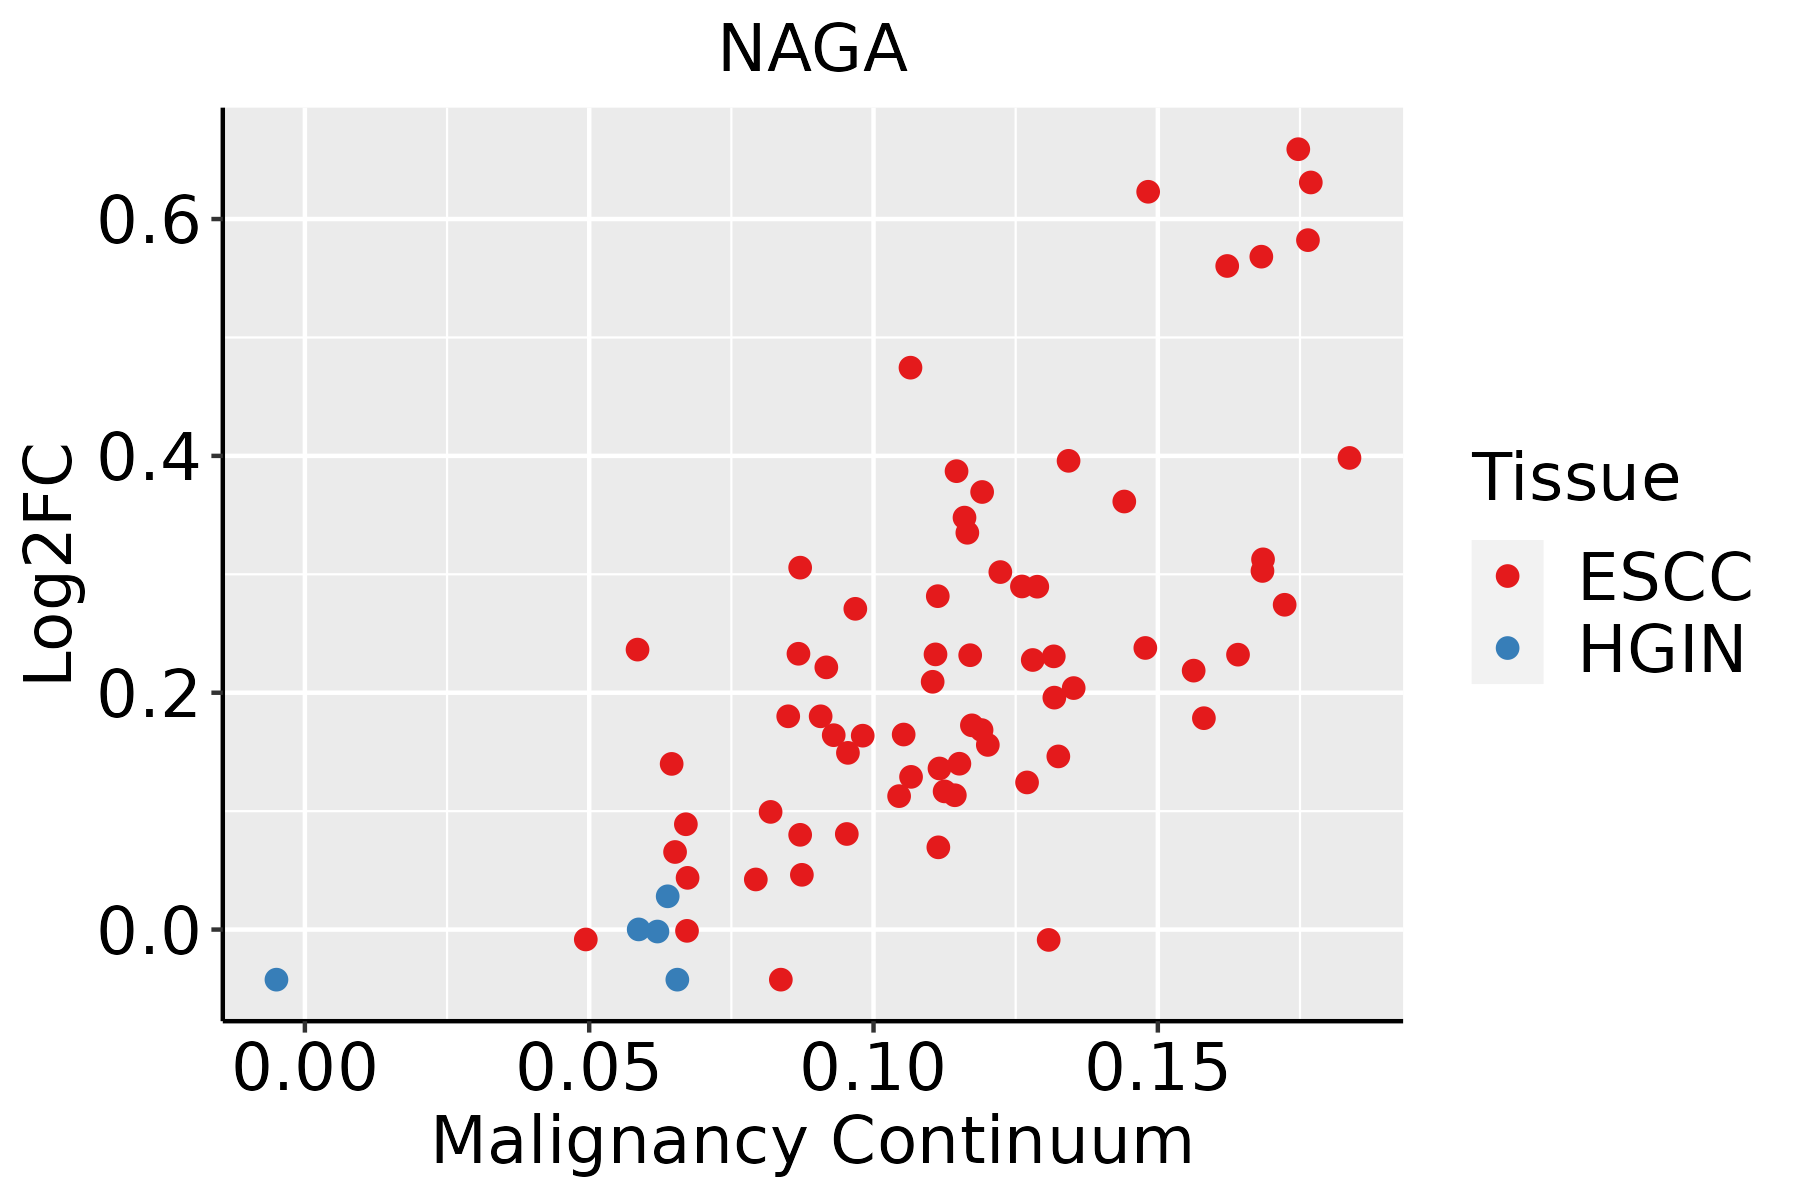 | ESCC: Esophageal squamous cell carcinoma |
| HGIN: High-grade intraepithelial neoplasias | ||
| LGIN: Low-grade intraepithelial neoplasias | ||
| Oral Cavity | 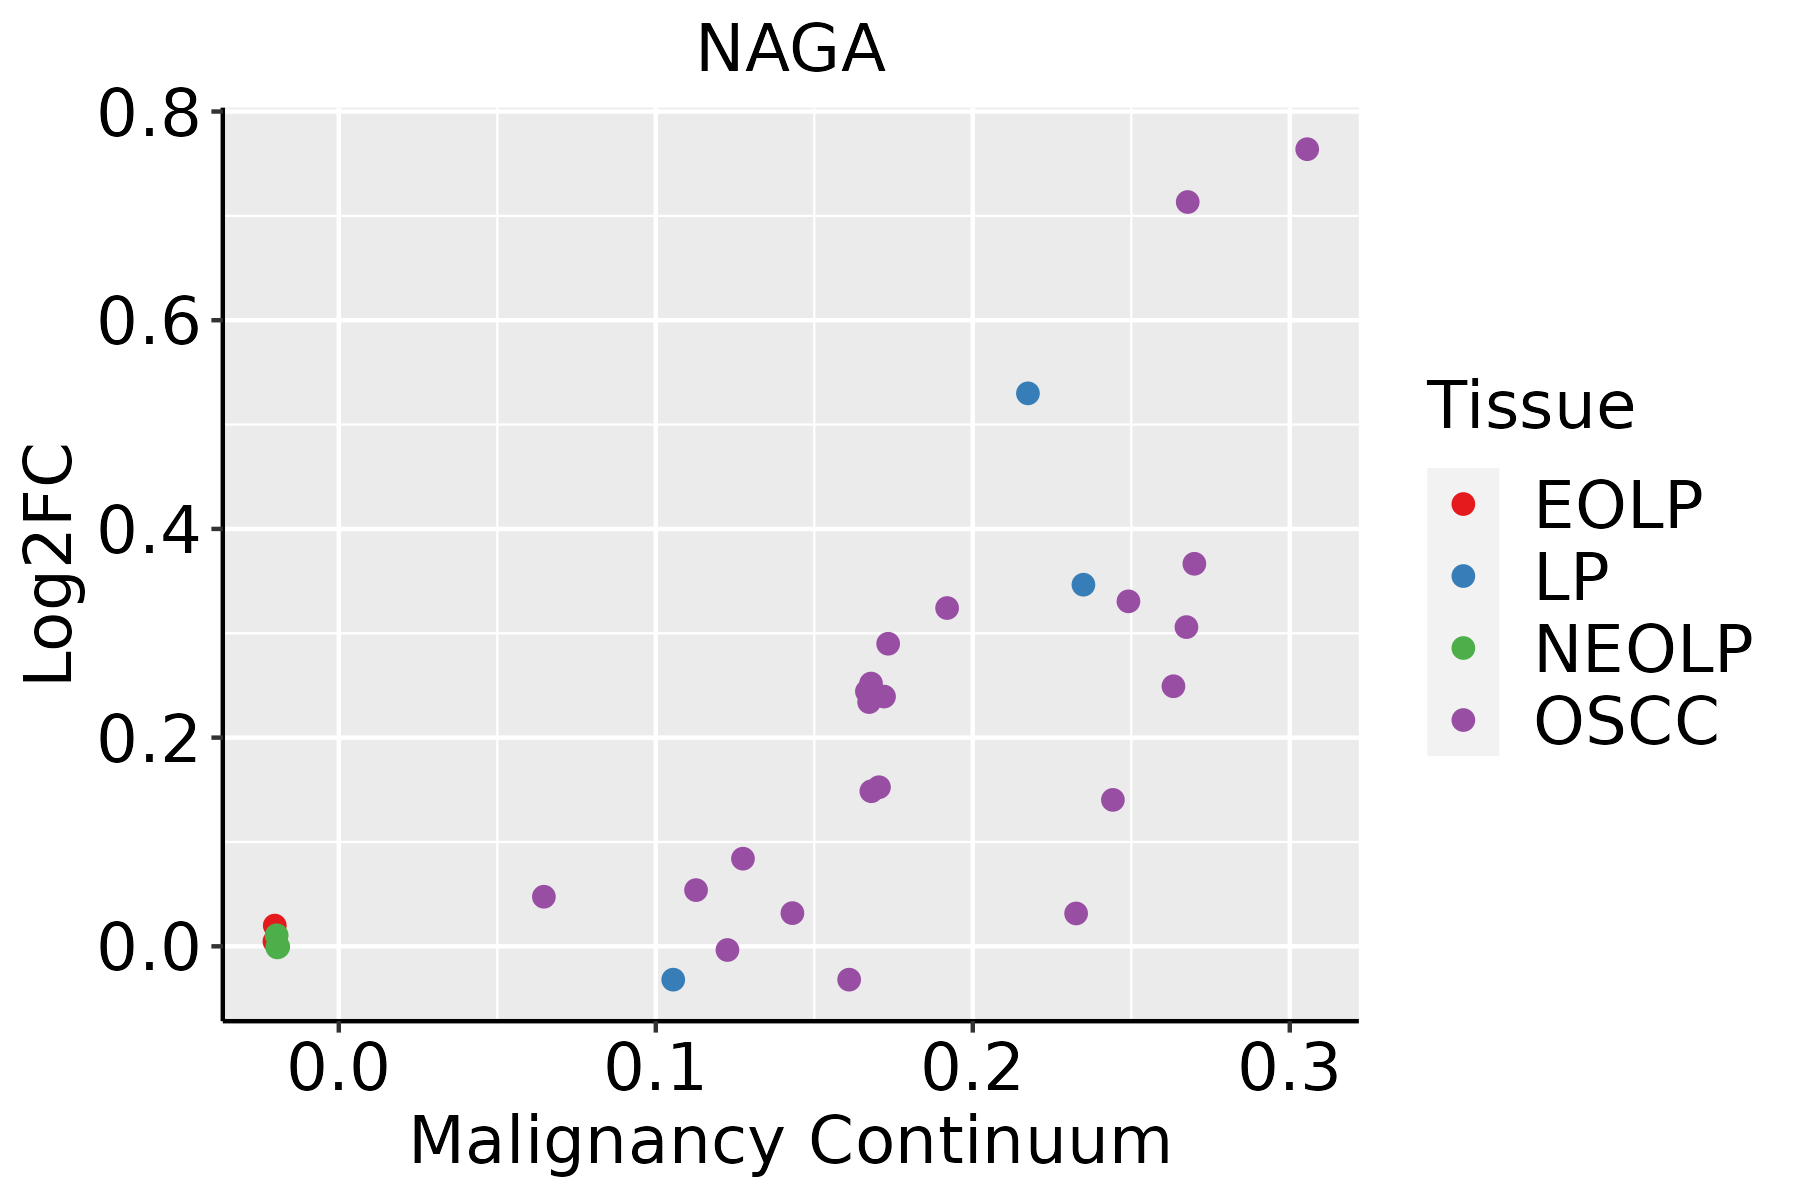 | EOLP: Erosive Oral lichen planus |
| LP: leukoplakia | ||
| NEOLP: Non-erosive oral lichen planus | ||
| OSCC: Oral squamous cell carcinoma |
| ∗log2FC in expression of this searched gene in stem-like cells from each diseased tissue sample relative to stem-like cells in normal samples in each tissue plotted against the malignancy continuum. Samples are colored based on if they are from different disease stage. |
Top |
Malignant transformation related pathway analysis |
| Find out the enriched GO biological processes and KEGG pathways involved in transition from healthy to precancer to cancer |
| Tissue | Disease Stage | Enriched GO biological Processes |
| Colorectum | AD |  |
| Colorectum | SER |  |
| Colorectum | MSS |  |
| Colorectum | MSI-H |  |
| Colorectum | FAP |  |
| ∗Top 15 enriched GO BP terms are showed in the bar plot of each disease state in each tissue. Each row represents a significant GO biological process which is colored according to the -log10(p.adjust). |
| Page: 1 2 3 4 5 6 7 8 9 |
| GO ID | Tissue | Disease Stage | Description | Gene Ratio | Bg Ratio | pvalue | p.adjust | Count |
| GO:00066433 | Esophagus | ESCC | membrane lipid metabolic process | 130/8552 | 203/18723 | 9.29e-08 | 1.54e-06 | 130 |
| GO:00066652 | Esophagus | ESCC | sphingolipid metabolic process | 96/8552 | 155/18723 | 3.21e-05 | 2.66e-04 | 96 |
| GO:19016574 | Esophagus | ESCC | glycosyl compound metabolic process | 57/8552 | 88/18723 | 2.32e-04 | 1.44e-03 | 57 |
| GO:00066642 | Esophagus | ESCC | glycolipid metabolic process | 63/8552 | 100/18723 | 3.55e-04 | 2.06e-03 | 63 |
| GO:19035092 | Esophagus | ESCC | liposaccharide metabolic process | 63/8552 | 101/18723 | 5.25e-04 | 2.90e-03 | 63 |
| GO:001605216 | Esophagus | ESCC | carbohydrate catabolic process | 91/8552 | 154/18723 | 5.39e-04 | 2.97e-03 | 91 |
| GO:00442427 | Esophagus | ESCC | cellular lipid catabolic process | 121/8552 | 214/18723 | 8.63e-04 | 4.43e-03 | 121 |
| GO:19011362 | Esophagus | ESCC | carbohydrate derivative catabolic process | 99/8552 | 172/18723 | 1.11e-03 | 5.54e-03 | 99 |
| GO:00066721 | Esophagus | ESCC | ceramide metabolic process | 61/8552 | 102/18723 | 2.82e-03 | 1.19e-02 | 61 |
| GO:00160427 | Esophagus | ESCC | lipid catabolic process | 168/8552 | 320/18723 | 7.97e-03 | 2.84e-02 | 168 |
| GO:00161373 | Esophagus | ESCC | glycoside metabolic process | 16/8552 | 22/18723 | 9.46e-03 | 3.28e-02 | 16 |
| GO:00066432 | Oral cavity | OSCC | membrane lipid metabolic process | 111/7305 | 203/18723 | 4.02e-06 | 4.69e-05 | 111 |
| GO:00066651 | Oral cavity | OSCC | sphingolipid metabolic process | 84/7305 | 155/18723 | 8.64e-05 | 6.61e-04 | 84 |
| GO:19016573 | Oral cavity | OSCC | glycosyl compound metabolic process | 52/7305 | 88/18723 | 1.06e-04 | 7.84e-04 | 52 |
| GO:19011361 | Oral cavity | OSCC | carbohydrate derivative catabolic process | 89/7305 | 172/18723 | 4.52e-04 | 2.73e-03 | 89 |
| GO:00442426 | Oral cavity | OSCC | cellular lipid catabolic process | 104/7305 | 214/18723 | 2.61e-03 | 1.15e-02 | 104 |
| GO:00066641 | Oral cavity | OSCC | glycolipid metabolic process | 53/7305 | 100/18723 | 3.09e-03 | 1.33e-02 | 53 |
| GO:19035091 | Oral cavity | OSCC | liposaccharide metabolic process | 53/7305 | 101/18723 | 4.06e-03 | 1.66e-02 | 53 |
| GO:0006672 | Oral cavity | OSCC | ceramide metabolic process | 53/7305 | 102/18723 | 5.28e-03 | 2.06e-02 | 53 |
| GO:001605210 | Oral cavity | OSCC | carbohydrate catabolic process | 76/7305 | 154/18723 | 5.67e-03 | 2.18e-02 | 76 |
| Page: 1 |
| Pathway ID | Tissue | Disease Stage | Description | Gene Ratio | Bg Ratio | pvalue | p.adjust | qvalue | Count |
| hsa0414222 | Esophagus | ESCC | Lysosome | 102/4205 | 132/8465 | 5.11e-11 | 7.13e-10 | 3.65e-10 | 102 |
| hsa0414232 | Esophagus | ESCC | Lysosome | 102/4205 | 132/8465 | 5.11e-11 | 7.13e-10 | 3.65e-10 | 102 |
| hsa041425 | Oral cavity | OSCC | Lysosome | 87/3704 | 132/8465 | 1.97e-07 | 1.35e-06 | 6.86e-07 | 87 |
| hsa0414212 | Oral cavity | OSCC | Lysosome | 87/3704 | 132/8465 | 1.97e-07 | 1.35e-06 | 6.86e-07 | 87 |
| Page: 1 |
Top |
Cell-cell communication analysis |
| Identification of potential cell-cell interactions between two cell types and their ligand-receptor pairs for different disease states |
| Ligand | Receptor | LRpair | Pathway | Tissue | Disease Stage |
| Page: 1 |
Top |
Single-cell gene regulatory network inference analysis |
| Find out the significant the regulons (TFs) and the target genes of each regulon across cell types for different disease states |
| TF | Cell Type | Tissue | Disease Stage | Target Gene | RSS | Regulon Activity |
| ∗The dot plots of a searched regulon are shown for all cell subpopulations in each disease state of each tissue based on the regulon specific score inferred using pySCENIC and by calculating the average expression. |
| Page: 1 |
Top |
Somatic mutation of malignant transformation related genes |
| Annotation of somatic variants for genes involved in malignant transformation |
| Hugo Symbol | Variant Class | Variant Classification | dbSNP RS | HGVSc | HGVSp | HGVSp Short | SWISSPROT | BIOTYPE | SIFT | PolyPhen | Tumor Sample Barcode | Tissue | Histology | Sex | Age | Stage | Therapy Types | Drugs | Outcome |
| NAGA | SNV | Missense_Mutation | c.649N>A | p.Asp217Asn | p.D217N | P17050 | protein_coding | deleterious(0) | probably_damaging(0.911) | TCGA-5L-AAT1-01 | Breast | breast invasive carcinoma | Female | <65 | III/IV | Hormone Therapy | letrozol | SD | |
| NAGA | SNV | Missense_Mutation | novel | c.70N>A | p.Gln24Lys | p.Q24K | P17050 | protein_coding | tolerated(0.36) | benign(0) | TCGA-BH-A0HU-01 | Breast | breast invasive carcinoma | Female | <65 | I/II | Chemotherapy | docetaxel | SD |
| NAGA | insertion | Nonsense_Mutation | novel | c.862_863insGGTAGTTATCTTG | p.Thr288ArgfsTer2 | p.T288Rfs*2 | P17050 | protein_coding | TCGA-B6-A0RE-01 | Breast | breast invasive carcinoma | Female | <65 | I/II | Unknown | Unknown | SD | ||
| NAGA | SNV | Missense_Mutation | novel | c.763N>A | p.Leu255Ile | p.L255I | P17050 | protein_coding | tolerated(1) | benign(0.001) | TCGA-2W-A8YY-01 | Cervix | cervical & endocervical cancer | Female | <65 | I/II | Chemotherapy | cisplatin | CR |
| NAGA | SNV | Missense_Mutation | rs781499383 | c.638N>A | p.Arg213His | p.R213H | P17050 | protein_coding | deleterious(0) | probably_damaging(1) | TCGA-2W-A8YY-01 | Cervix | cervical & endocervical cancer | Female | <65 | I/II | Chemotherapy | cisplatin | CR |
| NAGA | SNV | Missense_Mutation | novel | c.429G>C | p.Gln143His | p.Q143H | P17050 | protein_coding | deleterious(0.03) | benign(0.022) | TCGA-C5-A1MH-01 | Cervix | cervical & endocervical cancer | Female | >=65 | III/IV | Chemotherapy | cisplatin | PD |
| NAGA | SNV | Missense_Mutation | c.1124N>G | p.Asp375Gly | p.D375G | P17050 | protein_coding | tolerated(0.35) | benign(0.001) | TCGA-A6-5665-01 | Colorectum | colon adenocarcinoma | Female | >=65 | I/II | Unknown | Unknown | PD | |
| NAGA | SNV | Missense_Mutation | c.962N>C | p.Lys321Thr | p.K321T | P17050 | protein_coding | tolerated(0.08) | benign(0.009) | TCGA-AA-A00N-01 | Colorectum | colon adenocarcinoma | Male | >=65 | I/II | Unknown | Unknown | PD | |
| NAGA | SNV | Missense_Mutation | rs374542831 | c.860G>A | p.Arg287His | p.R287H | P17050 | protein_coding | deleterious(0) | probably_damaging(0.983) | TCGA-G4-6586-01 | Colorectum | colon adenocarcinoma | Female | >=65 | I/II | Unknown | Unknown | SD |
| NAGA | SNV | Missense_Mutation | c.1051N>C | p.Tyr351His | p.Y351H | P17050 | protein_coding | tolerated(0.13) | benign(0.079) | TCGA-DY-A1DC-01 | Colorectum | rectum adenocarcinoma | Female | >=65 | I/II | Chemotherapy | capecitabine | PR |
| Page: 1 2 3 4 |
Top |
Related drugs of malignant transformation related genes |
| Identification of chemicals and drugs interact with genes involved in malignant transfromation |
| (DGIdb 4.0) |
| Entrez ID | Symbol | Category | Interaction Types | Drug Claim Name | Drug Name | PMIDs |
| Page: 1 |

Copyright 2023-Present -The University of Texas Health Science Center at Houston |