
|
|||||
|
 | |
| |
| |
| |
| |
| |
|
Gene: NAE1 |
Gene summary for NAE1 |
| Gene information | Species | Human | Gene symbol | NAE1 | Gene ID | 8883 |
| Gene name | NEDD8 activating enzyme E1 subunit 1 | |
| Gene Alias | A-116A10.1 | |
| Cytomap | 16q22.1 | |
| Gene Type | protein-coding | GO ID | GO:0000075 | UniProtAcc | Q13564 |
Top |
Malignant transformation analysis |
| Identification of the aberrant gene expression in precancerous and cancerous lesions by comparing the gene expression of stem-like cells in diseased tissues with normal stem cells |
| Entrez ID | Symbol | Replicates | Species | Organ | Tissue | Adj P-value | Log2FC | Malignancy |
| 8883 | NAE1 | LZE2T | Human | Esophagus | ESCC | 1.59e-07 | 8.15e-01 | 0.082 |
| 8883 | NAE1 | LZE4T | Human | Esophagus | ESCC | 1.23e-22 | 8.21e-01 | 0.0811 |
| 8883 | NAE1 | LZE5T | Human | Esophagus | ESCC | 2.09e-02 | 3.76e-01 | 0.0514 |
| 8883 | NAE1 | LZE7T | Human | Esophagus | ESCC | 3.42e-12 | 9.37e-01 | 0.0667 |
| 8883 | NAE1 | LZE8T | Human | Esophagus | ESCC | 3.00e-10 | 4.71e-01 | 0.067 |
| 8883 | NAE1 | LZE20T | Human | Esophagus | ESCC | 9.83e-06 | 2.57e-01 | 0.0662 |
| 8883 | NAE1 | LZE22T | Human | Esophagus | ESCC | 6.13e-03 | 4.00e-01 | 0.068 |
| 8883 | NAE1 | LZE24T | Human | Esophagus | ESCC | 1.93e-22 | 6.04e-01 | 0.0596 |
| 8883 | NAE1 | LZE21T | Human | Esophagus | ESCC | 3.28e-03 | 1.85e-01 | 0.0655 |
| 8883 | NAE1 | LZE6T | Human | Esophagus | ESCC | 1.01e-07 | 4.27e-01 | 0.0845 |
| 8883 | NAE1 | P1T-E | Human | Esophagus | ESCC | 2.86e-09 | 6.10e-01 | 0.0875 |
| 8883 | NAE1 | P2T-E | Human | Esophagus | ESCC | 1.65e-33 | 7.09e-01 | 0.1177 |
| 8883 | NAE1 | P4T-E | Human | Esophagus | ESCC | 4.63e-49 | 1.21e+00 | 0.1323 |
| 8883 | NAE1 | P5T-E | Human | Esophagus | ESCC | 5.83e-27 | 6.66e-01 | 0.1327 |
| 8883 | NAE1 | P8T-E | Human | Esophagus | ESCC | 2.95e-29 | 6.34e-01 | 0.0889 |
| 8883 | NAE1 | P9T-E | Human | Esophagus | ESCC | 9.61e-15 | 3.32e-01 | 0.1131 |
| 8883 | NAE1 | P10T-E | Human | Esophagus | ESCC | 4.36e-21 | 4.73e-01 | 0.116 |
| 8883 | NAE1 | P11T-E | Human | Esophagus | ESCC | 5.72e-15 | 6.63e-01 | 0.1426 |
| 8883 | NAE1 | P12T-E | Human | Esophagus | ESCC | 4.02e-27 | 5.60e-01 | 0.1122 |
| 8883 | NAE1 | P15T-E | Human | Esophagus | ESCC | 4.74e-26 | 6.19e-01 | 0.1149 |
| Page: 1 2 3 4 5 6 7 |
| Tissue | Expression Dynamics | Abbreviation |
| Esophagus |  | ESCC: Esophageal squamous cell carcinoma |
| HGIN: High-grade intraepithelial neoplasias | ||
| LGIN: Low-grade intraepithelial neoplasias | ||
| Liver | 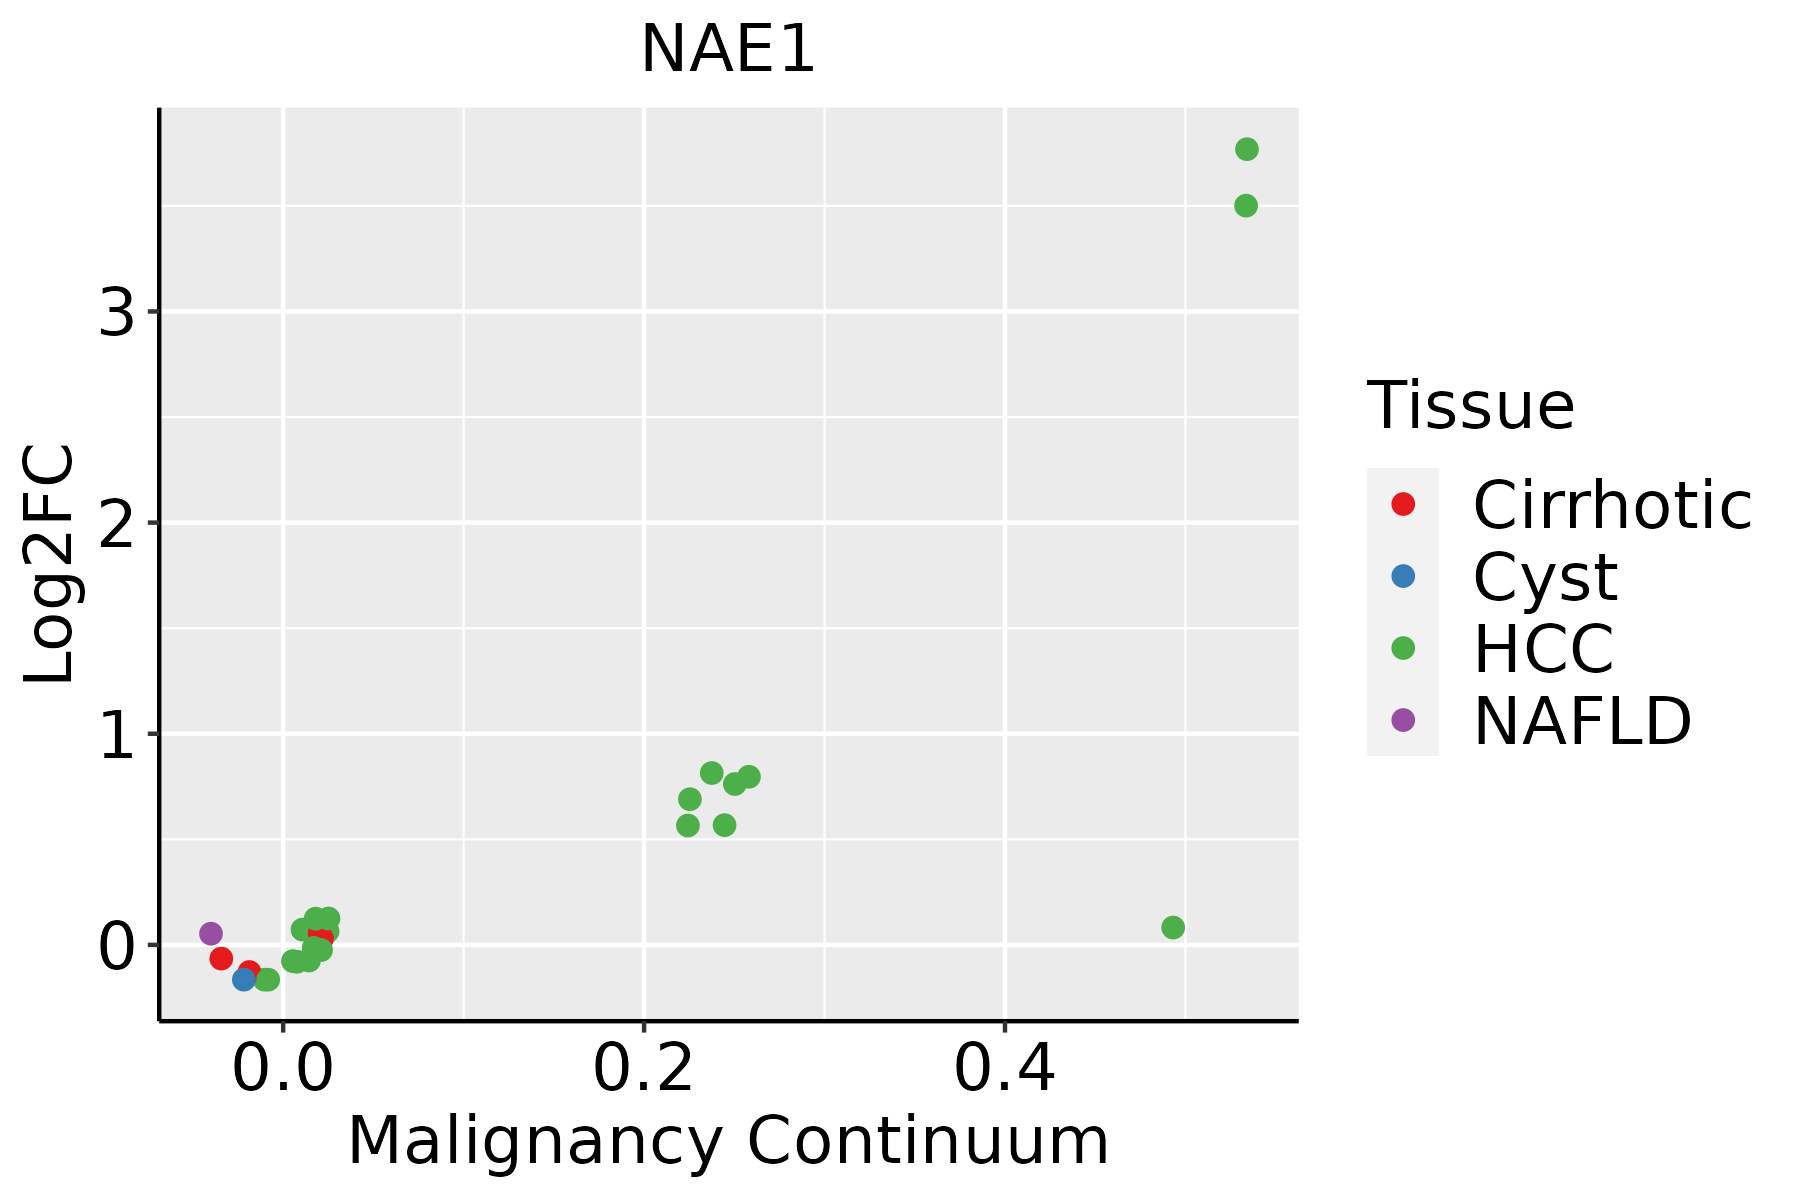 | HCC: Hepatocellular carcinoma |
| NAFLD: Non-alcoholic fatty liver disease | ||
| Oral Cavity | 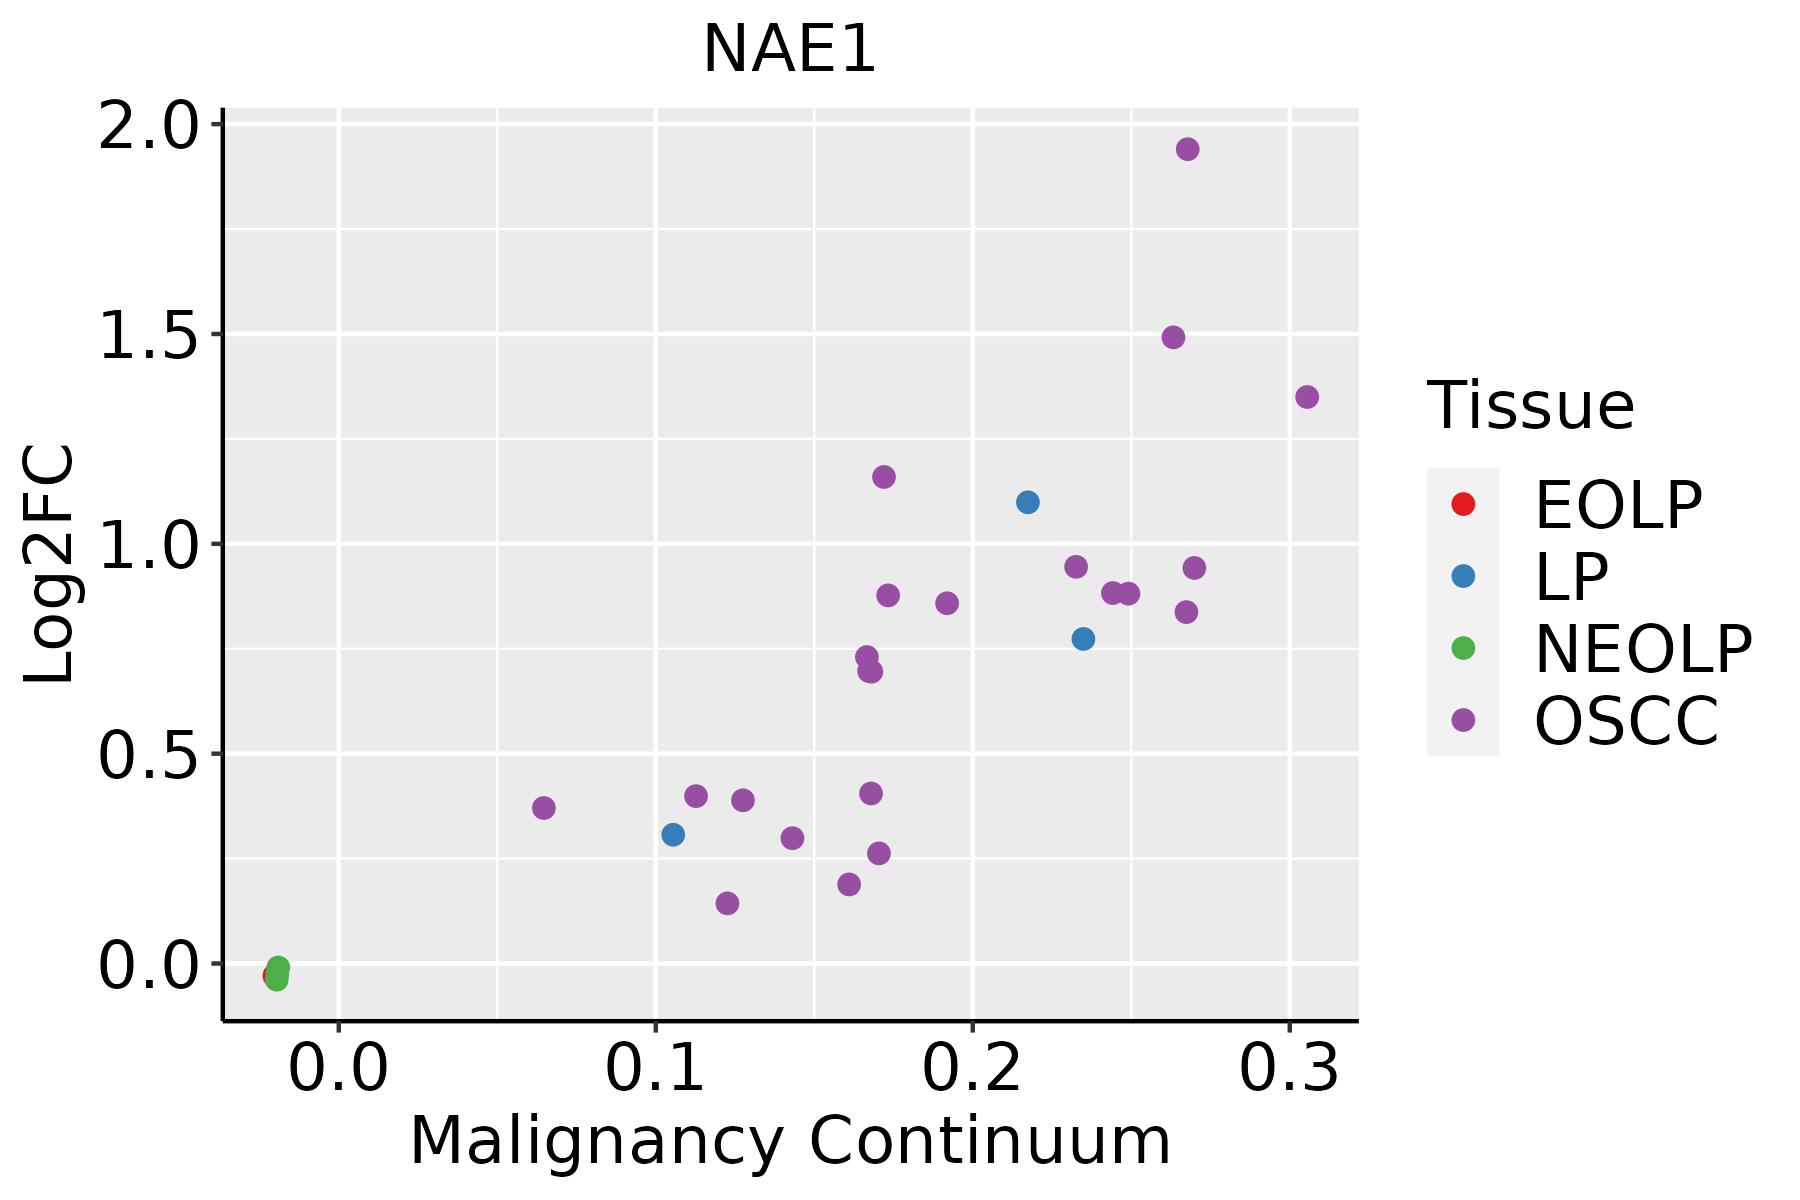 | EOLP: Erosive Oral lichen planus |
| LP: leukoplakia | ||
| NEOLP: Non-erosive oral lichen planus | ||
| OSCC: Oral squamous cell carcinoma | ||
| Skin | 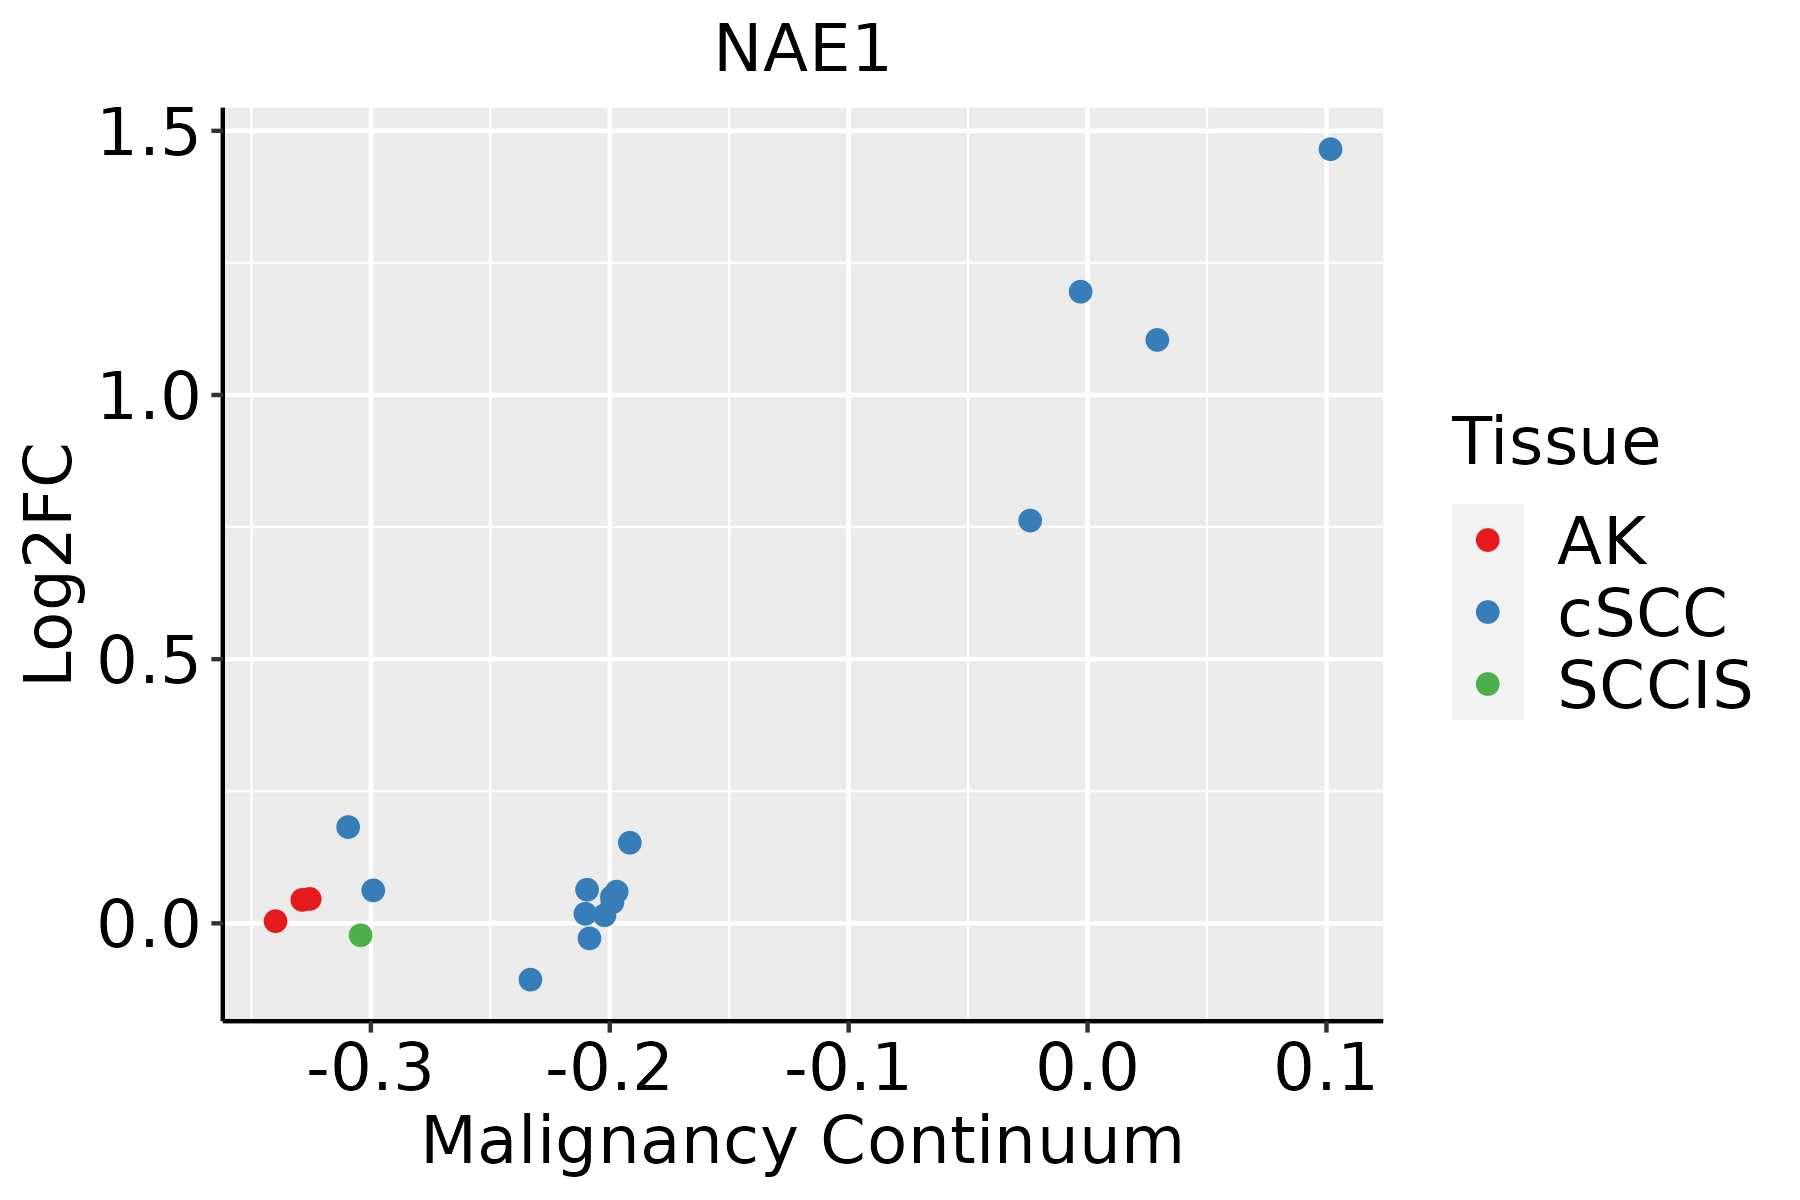 | AK: Actinic keratosis |
| cSCC: Cutaneous squamous cell carcinoma | ||
| SCCIS:squamous cell carcinoma in situ | ||
| Thyroid | 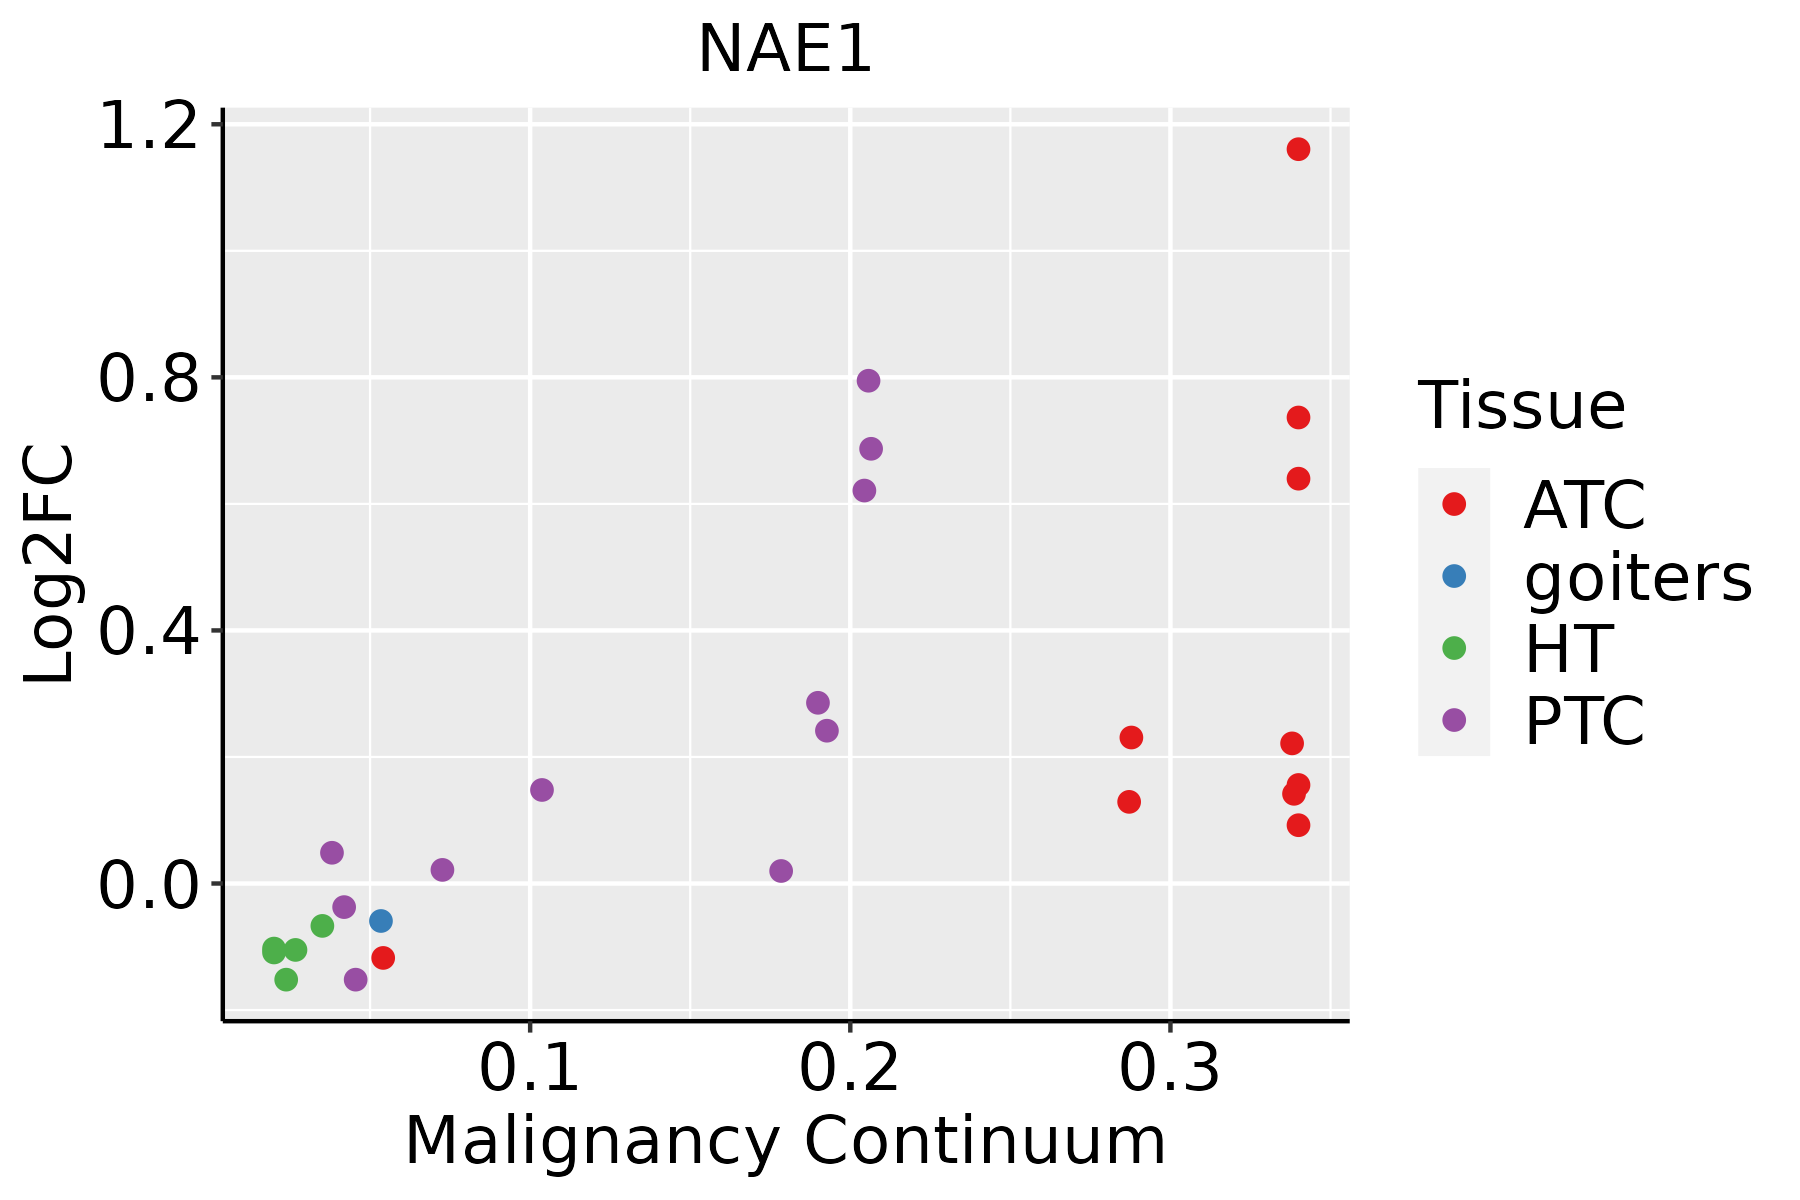 | ATC: Anaplastic thyroid cancer |
| HT: Hashimoto's thyroiditis | ||
| PTC: Papillary thyroid cancer |
| ∗log2FC in expression of this searched gene in stem-like cells from each diseased tissue sample relative to stem-like cells in normal samples in each tissue plotted against the malignancy continuum. Samples are colored based on if they are from different disease stage. |
Top |
Malignant transformation related pathway analysis |
| Find out the enriched GO biological processes and KEGG pathways involved in transition from healthy to precancer to cancer |
| Tissue | Disease Stage | Enriched GO biological Processes |
| Colorectum | AD |  |
| Colorectum | SER |  |
| Colorectum | MSS |  |
| Colorectum | MSI-H |  |
| Colorectum | FAP |  |
| ∗Top 15 enriched GO BP terms are showed in the bar plot of each disease state in each tissue. Each row represents a significant GO biological process which is colored according to the -log10(p.adjust). |
| Page: 1 2 3 4 5 6 7 8 9 |
| GO ID | Tissue | Disease Stage | Description | Gene Ratio | Bg Ratio | pvalue | p.adjust | Count |
| GO:004477216 | Esophagus | ESCC | mitotic cell cycle phase transition | 281/8552 | 424/18723 | 4.63e-18 | 4.45e-16 | 281 |
| GO:000734615 | Esophagus | ESCC | regulation of mitotic cell cycle | 293/8552 | 457/18723 | 8.00e-16 | 5.64e-14 | 293 |
| GO:190198713 | Esophagus | ESCC | regulation of cell cycle phase transition | 242/8552 | 390/18723 | 3.86e-11 | 1.26e-09 | 242 |
| GO:190199013 | Esophagus | ESCC | regulation of mitotic cell cycle phase transition | 191/8552 | 299/18723 | 1.35e-10 | 3.94e-09 | 191 |
| GO:00457865 | Esophagus | ESCC | negative regulation of cell cycle | 236/8552 | 385/18723 | 3.62e-10 | 9.93e-09 | 236 |
| GO:00000754 | Esophagus | ESCC | cell cycle checkpoint | 117/8552 | 169/18723 | 4.47e-10 | 1.17e-08 | 117 |
| GO:00448394 | Esophagus | ESCC | cell cycle G2/M phase transition | 103/8552 | 148/18723 | 3.09e-09 | 6.67e-08 | 103 |
| GO:00000864 | Esophagus | ESCC | G2/M transition of mitotic cell cycle | 96/8552 | 137/18723 | 6.00e-09 | 1.23e-07 | 96 |
| GO:00070934 | Esophagus | ESCC | mitotic cell cycle checkpoint | 90/8552 | 129/18723 | 2.49e-08 | 4.69e-07 | 90 |
| GO:0070997111 | Esophagus | ESCC | neuron death | 216/8552 | 361/18723 | 3.49e-08 | 6.45e-07 | 216 |
| GO:00109484 | Esophagus | ESCC | negative regulation of cell cycle process | 177/8552 | 294/18723 | 3.26e-07 | 4.59e-06 | 177 |
| GO:00315705 | Esophagus | ESCC | DNA integrity checkpoint | 83/8552 | 123/18723 | 8.17e-07 | 1.06e-05 | 83 |
| GO:19019883 | Esophagus | ESCC | negative regulation of cell cycle phase transition | 151/8552 | 249/18723 | 1.28e-06 | 1.57e-05 | 151 |
| GO:004593013 | Esophagus | ESCC | negative regulation of mitotic cell cycle | 143/8552 | 235/18723 | 1.84e-06 | 2.15e-05 | 143 |
| GO:0051402110 | Esophagus | ESCC | neuron apoptotic process | 148/8552 | 246/18723 | 3.08e-06 | 3.47e-05 | 148 |
| GO:1901214111 | Esophagus | ESCC | regulation of neuron death | 186/8552 | 319/18723 | 3.35e-06 | 3.73e-05 | 186 |
| GO:190199113 | Esophagus | ESCC | negative regulation of mitotic cell cycle phase transition | 112/8552 | 179/18723 | 3.69e-06 | 4.03e-05 | 112 |
| GO:00103891 | Esophagus | ESCC | regulation of G2/M transition of mitotic cell cycle | 64/8552 | 94/18723 | 9.21e-06 | 8.82e-05 | 64 |
| GO:19027491 | Esophagus | ESCC | regulation of cell cycle G2/M phase transition | 68/8552 | 102/18723 | 1.48e-05 | 1.33e-04 | 68 |
| GO:00447745 | Esophagus | ESCC | mitotic DNA integrity checkpoint | 56/8552 | 85/18723 | 1.34e-04 | 9.09e-04 | 56 |
| Page: 1 2 3 4 5 6 7 8 9 |
| Pathway ID | Tissue | Disease Stage | Description | Gene Ratio | Bg Ratio | pvalue | p.adjust | qvalue | Count |
| hsa05010210 | Esophagus | ESCC | Alzheimer disease | 263/4205 | 384/8465 | 1.80e-14 | 5.47e-13 | 2.80e-13 | 263 |
| hsa0501038 | Esophagus | ESCC | Alzheimer disease | 263/4205 | 384/8465 | 1.80e-14 | 5.47e-13 | 2.80e-13 | 263 |
| hsa0501014 | Liver | Cirrhotic | Alzheimer disease | 180/2530 | 384/8465 | 5.52e-13 | 1.36e-11 | 8.36e-12 | 180 |
| hsa0501015 | Liver | Cirrhotic | Alzheimer disease | 180/2530 | 384/8465 | 5.52e-13 | 1.36e-11 | 8.36e-12 | 180 |
| hsa0501022 | Liver | HCC | Alzheimer disease | 254/4020 | 384/8465 | 3.75e-14 | 8.97e-13 | 4.99e-13 | 254 |
| hsa0501032 | Liver | HCC | Alzheimer disease | 254/4020 | 384/8465 | 3.75e-14 | 8.97e-13 | 4.99e-13 | 254 |
| hsa0501028 | Oral cavity | OSCC | Alzheimer disease | 244/3704 | 384/8465 | 1.18e-15 | 3.60e-14 | 1.83e-14 | 244 |
| hsa05010112 | Oral cavity | OSCC | Alzheimer disease | 244/3704 | 384/8465 | 1.18e-15 | 3.60e-14 | 1.83e-14 | 244 |
| hsa0501029 | Oral cavity | LP | Alzheimer disease | 197/2418 | 384/8465 | 6.66e-22 | 3.69e-20 | 2.38e-20 | 197 |
| hsa0501037 | Oral cavity | LP | Alzheimer disease | 197/2418 | 384/8465 | 6.66e-22 | 3.69e-20 | 2.38e-20 | 197 |
| Page: 1 |
Top |
Cell-cell communication analysis |
| Identification of potential cell-cell interactions between two cell types and their ligand-receptor pairs for different disease states |
| Ligand | Receptor | LRpair | Pathway | Tissue | Disease Stage |
| Page: 1 |
Top |
Single-cell gene regulatory network inference analysis |
| Find out the significant the regulons (TFs) and the target genes of each regulon across cell types for different disease states |
| TF | Cell Type | Tissue | Disease Stage | Target Gene | RSS | Regulon Activity |
| ∗The dot plots of a searched regulon are shown for all cell subpopulations in each disease state of each tissue based on the regulon specific score inferred using pySCENIC and by calculating the average expression. |
| Page: 1 |
Top |
Somatic mutation of malignant transformation related genes |
| Annotation of somatic variants for genes involved in malignant transformation |
| Hugo Symbol | Variant Class | Variant Classification | dbSNP RS | HGVSc | HGVSp | HGVSp Short | SWISSPROT | BIOTYPE | SIFT | PolyPhen | Tumor Sample Barcode | Tissue | Histology | Sex | Age | Stage | Therapy Types | Drugs | Outcome |
| NAE1 | SNV | Missense_Mutation | rs759084335 | c.1177N>G | p.Leu393Val | p.L393V | Q13564 | protein_coding | tolerated(0.05) | benign(0.226) | TCGA-AC-A23H-01 | Breast | breast invasive carcinoma | Female | >=65 | I/II | Unknown | Unknown | PD |
| NAE1 | SNV | Missense_Mutation | c.1277N>A | p.Ile426Lys | p.I426K | Q13564 | protein_coding | deleterious(0.01) | benign(0.022) | TCGA-AR-A1AN-01 | Breast | breast invasive carcinoma | Female | <65 | I/II | Chemotherapy | cytoxan | SD | |
| NAE1 | deletion | Frame_Shift_Del | novel | c.960delA | p.Glu321ArgfsTer15 | p.E321Rfs*15 | Q13564 | protein_coding | TCGA-D8-A27V-01 | Breast | breast invasive carcinoma | Female | <65 | I/II | Hormone Therapy | tamoxiphen | SD | ||
| NAE1 | SNV | Missense_Mutation | novel | c.1297C>T | p.Arg433Trp | p.R433W | Q13564 | protein_coding | deleterious(0) | probably_damaging(0.99) | TCGA-2W-A8YY-01 | Cervix | cervical & endocervical cancer | Female | <65 | I/II | Chemotherapy | cisplatin | CR |
| NAE1 | SNV | Missense_Mutation | novel | c.784N>T | p.Pro262Ser | p.P262S | Q13564 | protein_coding | tolerated(0.3) | benign(0) | TCGA-VS-A9UC-01 | Cervix | cervical & endocervical cancer | Female | <65 | I/II | Chemotherapy | cisplatin | SD |
| NAE1 | SNV | Missense_Mutation | c.1140N>T | p.Glu380Asp | p.E380D | Q13564 | protein_coding | tolerated(0.28) | benign(0) | TCGA-A6-6141-01 | Colorectum | colon adenocarcinoma | Male | <65 | I/II | Chemotherapy | 5-fu | SD | |
| NAE1 | SNV | Missense_Mutation | rs762421870 | c.1460G>A | p.Arg487Gln | p.R487Q | Q13564 | protein_coding | deleterious(0) | probably_damaging(0.995) | TCGA-AM-5821-01 | Colorectum | colon adenocarcinoma | Female | >=65 | I/II | Unknown | Unknown | SD |
| NAE1 | SNV | Missense_Mutation | c.445T>C | p.Ser149Pro | p.S149P | Q13564 | protein_coding | tolerated(0.22) | benign(0.005) | TCGA-AG-A00Y-01 | Colorectum | rectum adenocarcinoma | Male | >=65 | I/II | Unknown | Unknown | PD | |
| NAE1 | SNV | Missense_Mutation | novel | c.607N>T | p.Asp203Tyr | p.D203Y | Q13564 | protein_coding | deleterious(0) | probably_damaging(0.951) | TCGA-EI-6917-01 | Colorectum | rectum adenocarcinoma | Male | <65 | III/IV | Chemotherapy | 5fluorouracil+oxaciplatina+l-folinian | SD |
| NAE1 | SNV | Missense_Mutation | novel | c.1093N>T | p.Ala365Ser | p.A365S | Q13564 | protein_coding | tolerated(0.66) | benign(0.005) | TCGA-A5-A0G1-01 | Endometrium | uterine corpus endometrioid carcinoma | Female | >=65 | I/II | Unknown | Unknown | SD |
| Page: 1 2 3 4 5 |
Top |
Related drugs of malignant transformation related genes |
| Identification of chemicals and drugs interact with genes involved in malignant transfromation |
| (DGIdb 4.0) |
| Entrez ID | Symbol | Category | Interaction Types | Drug Claim Name | Drug Name | PMIDs |
| 8883 | NAE1 | DRUGGABLE GENOME, ENZYME | inhibitor | CHEMBL1231160 | PEVONEDISTAT |
| Page: 1 |

Copyright 2023-Present -The University of Texas Health Science Center at Houston |