
|
|||||
|
 | |
| |
| |
| |
| |
| |
|
Gene: NADK2 |
Gene summary for NADK2 |
| Gene information | Species | Human | Gene symbol | NADK2 | Gene ID | 133686 |
| Gene name | NAD kinase 2, mitochondrial | |
| Gene Alias | C5orf33 | |
| Cytomap | 5p13.2 | |
| Gene Type | protein-coding | GO ID | GO:0006139 | UniProtAcc | Q4G0N4 |
Top |
Malignant transformation analysis |
| Identification of the aberrant gene expression in precancerous and cancerous lesions by comparing the gene expression of stem-like cells in diseased tissues with normal stem cells |
| Entrez ID | Symbol | Replicates | Species | Organ | Tissue | Adj P-value | Log2FC | Malignancy |
| 133686 | NADK2 | NAFLD1 | Human | Liver | NAFLD | 4.69e-06 | 6.28e-01 | -0.04 |
| 133686 | NADK2 | S43 | Human | Liver | Cirrhotic | 3.50e-06 | -1.81e-02 | -0.0187 |
| 133686 | NADK2 | HCC1_Meng | Human | Liver | HCC | 5.05e-71 | 8.26e-03 | 0.0246 |
| 133686 | NADK2 | HCC2_Meng | Human | Liver | HCC | 1.09e-10 | -1.92e-01 | 0.0107 |
| 133686 | NADK2 | cirrhotic1 | Human | Liver | Cirrhotic | 5.37e-03 | -2.10e-01 | 0.0202 |
| 133686 | NADK2 | cirrhotic2 | Human | Liver | Cirrhotic | 2.41e-02 | -1.54e-01 | 0.0201 |
| 133686 | NADK2 | HCC1 | Human | Liver | HCC | 1.87e-43 | 5.77e+00 | 0.5336 |
| 133686 | NADK2 | HCC2 | Human | Liver | HCC | 8.50e-11 | 2.86e+00 | 0.5341 |
| 133686 | NADK2 | Pt14.a | Human | Liver | HCC | 4.40e-02 | 2.14e-01 | 0.0169 |
| 133686 | NADK2 | Pt14.b | Human | Liver | HCC | 4.72e-03 | 2.55e-01 | 0.018 |
| 133686 | NADK2 | S014 | Human | Liver | HCC | 1.00e-10 | 7.93e-01 | 0.2254 |
| 133686 | NADK2 | S015 | Human | Liver | HCC | 1.64e-10 | 8.42e-01 | 0.2375 |
| 133686 | NADK2 | S016 | Human | Liver | HCC | 7.24e-11 | 6.60e-01 | 0.2243 |
| 133686 | NADK2 | S028 | Human | Liver | HCC | 1.05e-05 | 4.84e-01 | 0.2503 |
| 133686 | NADK2 | S029 | Human | Liver | HCC | 6.86e-03 | 4.56e-01 | 0.2581 |
| 133686 | NADK2 | C21 | Human | Oral cavity | OSCC | 7.54e-04 | 2.41e-01 | 0.2678 |
| 133686 | NADK2 | C30 | Human | Oral cavity | OSCC | 1.89e-05 | 4.14e-01 | 0.3055 |
| 133686 | NADK2 | C43 | Human | Oral cavity | OSCC | 5.19e-32 | 8.08e-01 | 0.1704 |
| 133686 | NADK2 | C08 | Human | Oral cavity | OSCC | 3.29e-06 | 2.10e-01 | 0.1919 |
| 133686 | NADK2 | SYSMH1 | Human | Oral cavity | OSCC | 8.74e-25 | 5.14e-01 | 0.1127 |
| Page: 1 2 |
| Tissue | Expression Dynamics | Abbreviation |
| Liver | 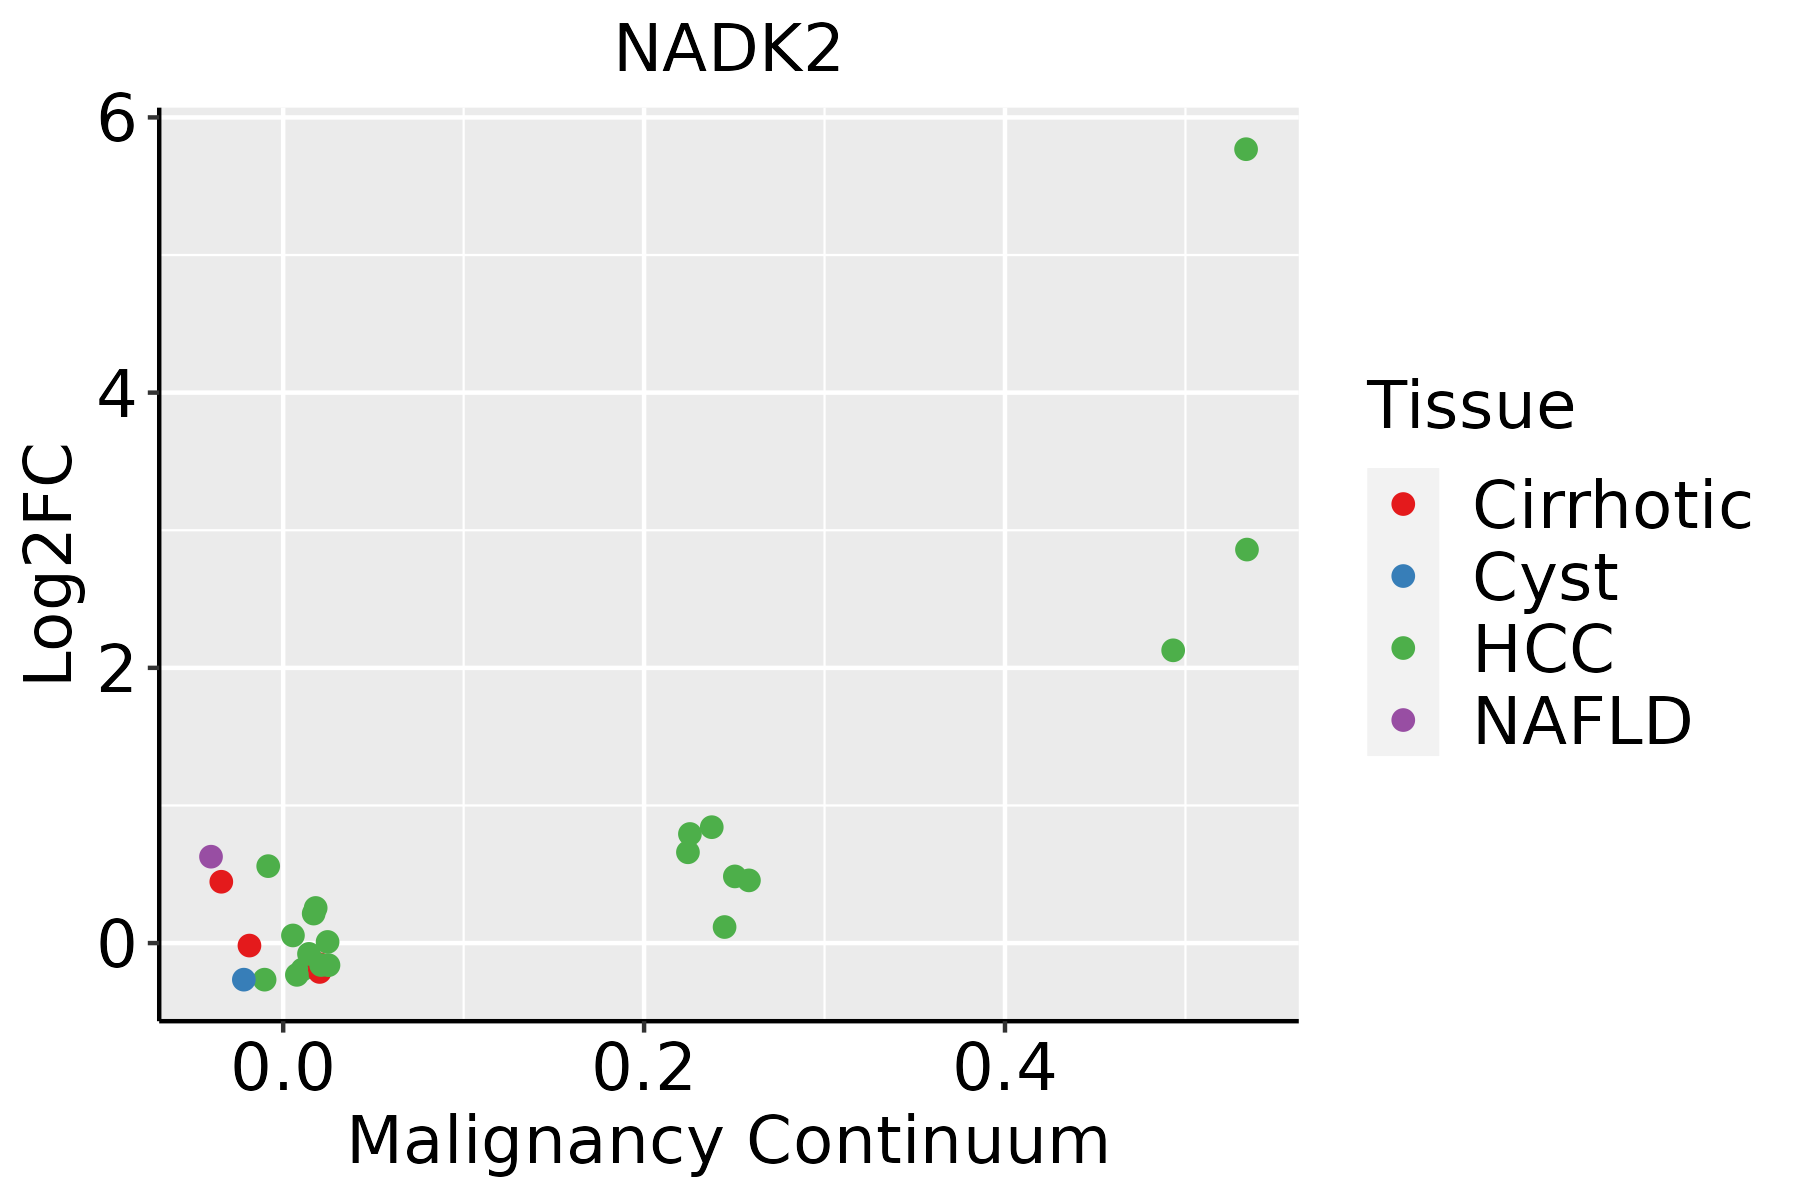 | HCC: Hepatocellular carcinoma |
| NAFLD: Non-alcoholic fatty liver disease | ||
| Oral Cavity | 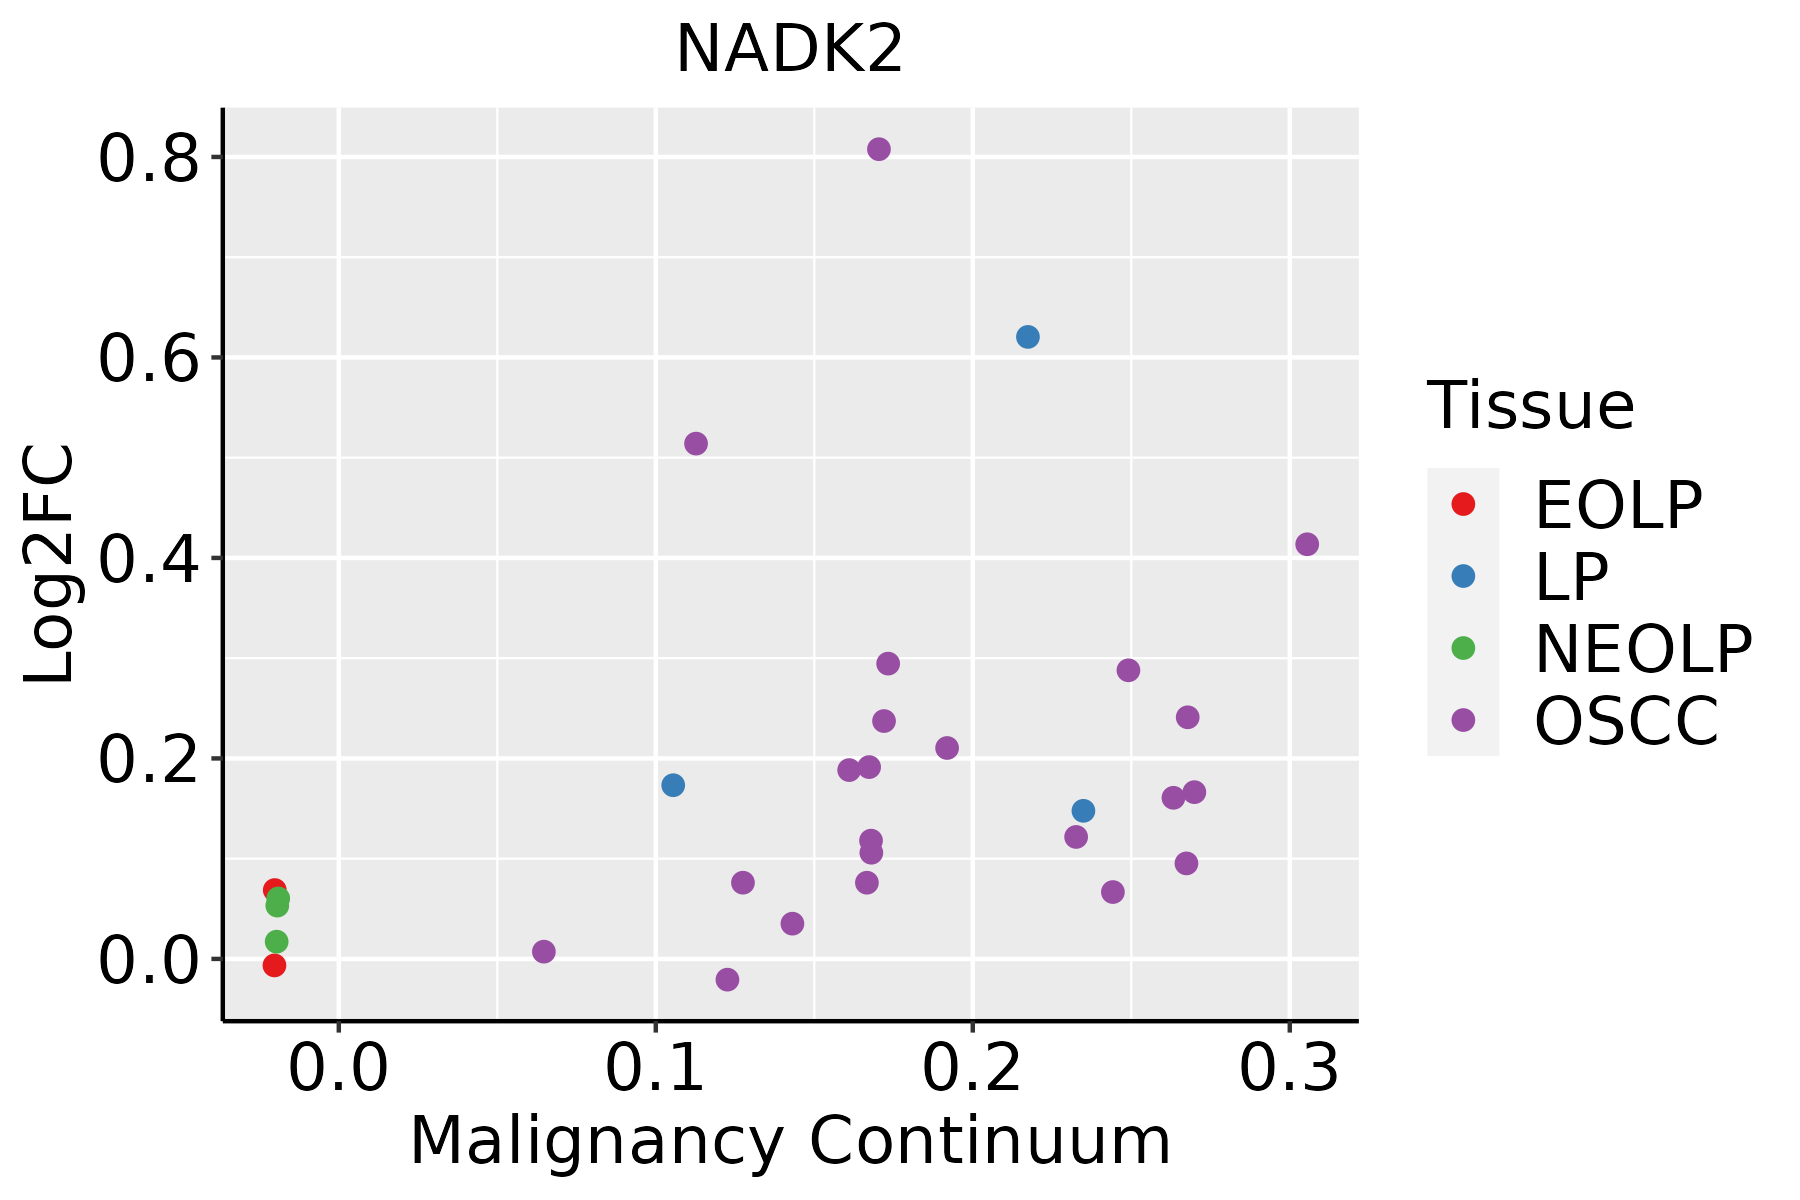 | EOLP: Erosive Oral lichen planus |
| LP: leukoplakia | ||
| NEOLP: Non-erosive oral lichen planus | ||
| OSCC: Oral squamous cell carcinoma |
| ∗log2FC in expression of this searched gene in stem-like cells from each diseased tissue sample relative to stem-like cells in normal samples in each tissue plotted against the malignancy continuum. Samples are colored based on if they are from different disease stage. |
Top |
Malignant transformation related pathway analysis |
| Find out the enriched GO biological processes and KEGG pathways involved in transition from healthy to precancer to cancer |
| Tissue | Disease Stage | Enriched GO biological Processes |
| Colorectum | AD |  |
| Colorectum | SER |  |
| Colorectum | MSS |  |
| Colorectum | MSI-H |  |
| Colorectum | FAP |  |
| ∗Top 15 enriched GO BP terms are showed in the bar plot of each disease state in each tissue. Each row represents a significant GO biological process which is colored according to the -log10(p.adjust). |
| Page: 1 2 3 4 5 6 7 8 9 |
| GO ID | Tissue | Disease Stage | Description | Gene Ratio | Bg Ratio | pvalue | p.adjust | Count |
| GO:00091177 | Liver | NAFLD | nucleotide metabolic process | 85/1882 | 489/18723 | 3.31e-07 | 2.18e-05 | 85 |
| GO:00067537 | Liver | NAFLD | nucleoside phosphate metabolic process | 85/1882 | 497/18723 | 6.69e-07 | 3.83e-05 | 85 |
| GO:000675312 | Liver | Cirrhotic | nucleoside phosphate metabolic process | 190/4634 | 497/18723 | 1.10e-11 | 6.96e-10 | 190 |
| GO:000911712 | Liver | Cirrhotic | nucleotide metabolic process | 187/4634 | 489/18723 | 1.55e-11 | 9.63e-10 | 187 |
| GO:00091654 | Liver | Cirrhotic | nucleotide biosynthetic process | 89/4634 | 254/18723 | 1.45e-04 | 1.40e-03 | 89 |
| GO:19012934 | Liver | Cirrhotic | nucleoside phosphate biosynthetic process | 89/4634 | 256/18723 | 1.97e-04 | 1.82e-03 | 89 |
| GO:000911722 | Liver | HCC | nucleotide metabolic process | 300/7958 | 489/18723 | 1.61e-17 | 1.71e-15 | 300 |
| GO:000675322 | Liver | HCC | nucleoside phosphate metabolic process | 304/7958 | 497/18723 | 1.78e-17 | 1.85e-15 | 304 |
| GO:000916512 | Liver | HCC | nucleotide biosynthetic process | 150/7958 | 254/18723 | 6.79e-08 | 1.40e-06 | 150 |
| GO:190129312 | Liver | HCC | nucleoside phosphate biosynthetic process | 151/7958 | 256/18723 | 6.84e-08 | 1.41e-06 | 151 |
| GO:0006739 | Liver | HCC | NADP metabolic process | 25/7958 | 35/18723 | 5.05e-04 | 3.29e-03 | 25 |
| GO:0072525 | Liver | HCC | pyridine-containing compound biosynthetic process | 22/7958 | 32/18723 | 2.43e-03 | 1.18e-02 | 22 |
| GO:0072524 | Liver | HCC | pyridine-containing compound metabolic process | 25/7958 | 38/18723 | 3.18e-03 | 1.47e-02 | 25 |
| GO:0019359 | Liver | HCC | nicotinamide nucleotide biosynthetic process | 19/7958 | 29/18723 | 1.05e-02 | 3.89e-02 | 19 |
| GO:0019363 | Liver | HCC | pyridine nucleotide biosynthetic process | 19/7958 | 29/18723 | 1.05e-02 | 3.89e-02 | 19 |
| GO:000675318 | Oral cavity | OSCC | nucleoside phosphate metabolic process | 247/7305 | 497/18723 | 6.28e-07 | 8.96e-06 | 247 |
| GO:000911719 | Oral cavity | OSCC | nucleotide metabolic process | 243/7305 | 489/18723 | 7.80e-07 | 1.09e-05 | 243 |
| GO:19012938 | Oral cavity | OSCC | nucleoside phosphate biosynthetic process | 125/7305 | 256/18723 | 8.32e-04 | 4.41e-03 | 125 |
| GO:00091658 | Oral cavity | OSCC | nucleotide biosynthetic process | 124/7305 | 254/18723 | 8.79e-04 | 4.63e-03 | 124 |
| GO:00067392 | Oral cavity | OSCC | NADP metabolic process | 22/7305 | 35/18723 | 3.65e-03 | 1.51e-02 | 22 |
| Page: 1 |
| Pathway ID | Tissue | Disease Stage | Description | Gene Ratio | Bg Ratio | pvalue | p.adjust | qvalue | Count |
| hsa01240 | Liver | Cirrhotic | Biosynthesis of cofactors | 66/2530 | 153/8465 | 3.11e-04 | 1.99e-03 | 1.23e-03 | 66 |
| hsa012401 | Liver | Cirrhotic | Biosynthesis of cofactors | 66/2530 | 153/8465 | 3.11e-04 | 1.99e-03 | 1.23e-03 | 66 |
| hsa012402 | Liver | HCC | Biosynthesis of cofactors | 103/4020 | 153/8465 | 4.67e-07 | 5.05e-06 | 2.81e-06 | 103 |
| hsa012403 | Liver | HCC | Biosynthesis of cofactors | 103/4020 | 153/8465 | 4.67e-07 | 5.05e-06 | 2.81e-06 | 103 |
| hsa012404 | Oral cavity | OSCC | Biosynthesis of cofactors | 88/3704 | 153/8465 | 3.84e-04 | 1.20e-03 | 6.12e-04 | 88 |
| hsa0124011 | Oral cavity | OSCC | Biosynthesis of cofactors | 88/3704 | 153/8465 | 3.84e-04 | 1.20e-03 | 6.12e-04 | 88 |
| Page: 1 |
Top |
Cell-cell communication analysis |
| Identification of potential cell-cell interactions between two cell types and their ligand-receptor pairs for different disease states |
| Ligand | Receptor | LRpair | Pathway | Tissue | Disease Stage |
| Page: 1 |
Top |
Single-cell gene regulatory network inference analysis |
| Find out the significant the regulons (TFs) and the target genes of each regulon across cell types for different disease states |
| TF | Cell Type | Tissue | Disease Stage | Target Gene | RSS | Regulon Activity |
| ∗The dot plots of a searched regulon are shown for all cell subpopulations in each disease state of each tissue based on the regulon specific score inferred using pySCENIC and by calculating the average expression. |
| Page: 1 |
Top |
Somatic mutation of malignant transformation related genes |
| Annotation of somatic variants for genes involved in malignant transformation |
| Hugo Symbol | Variant Class | Variant Classification | dbSNP RS | HGVSc | HGVSp | HGVSp Short | SWISSPROT | BIOTYPE | SIFT | PolyPhen | Tumor Sample Barcode | Tissue | Histology | Sex | Age | Stage | Therapy Types | Drugs | Outcome |
| NADK2 | SNV | Missense_Mutation | c.1282N>C | p.Met428Leu | p.M428L | Q4G0N4 | protein_coding | tolerated(0.29) | benign(0) | TCGA-BH-A1FN-01 | Breast | breast invasive carcinoma | Female | <65 | I/II | Unknown | Unknown | PD | |
| NADK2 | SNV | Missense_Mutation | rs772840407 | c.1175G>A | p.Arg392His | p.R392H | Q4G0N4 | protein_coding | deleterious(0.02) | possibly_damaging(0.902) | TCGA-AD-A5EJ-01 | Colorectum | colon adenocarcinoma | Female | >=65 | I/II | Unknown | Unknown | SD |
| NADK2 | SNV | Missense_Mutation | novel | c.862N>A | p.Ala288Thr | p.A288T | Q4G0N4 | protein_coding | tolerated(0.08) | probably_damaging(0.999) | TCGA-EI-6917-01 | Colorectum | rectum adenocarcinoma | Male | <65 | III/IV | Chemotherapy | 5fluorouracil+oxaciplatina+l-folinian | SD |
| NADK2 | SNV | Missense_Mutation | novel | c.1093N>T | p.Leu365Phe | p.L365F | Q4G0N4 | protein_coding | deleterious(0.02) | possibly_damaging(0.521) | TCGA-F5-6814-01 | Colorectum | rectum adenocarcinoma | Male | <65 | I/II | Unknown | Unknown | SD |
| NADK2 | SNV | Missense_Mutation | novel | c.927N>G | p.Asn309Lys | p.N309K | Q4G0N4 | protein_coding | tolerated(0.08) | possibly_damaging(0.655) | TCGA-A5-A0G2-01 | Endometrium | uterine corpus endometrioid carcinoma | Female | <65 | III/IV | Unknown | Unknown | SD |
| NADK2 | SNV | Missense_Mutation | novel | c.860N>T | p.Arg287Met | p.R287M | Q4G0N4 | protein_coding | deleterious(0) | probably_damaging(0.998) | TCGA-AJ-A3NE-01 | Endometrium | uterine corpus endometrioid carcinoma | Female | <65 | I/II | Unknown | Unknown | SD |
| NADK2 | SNV | Missense_Mutation | novel | c.863N>A | p.Ala288Asp | p.A288D | Q4G0N4 | protein_coding | deleterious(0.01) | probably_damaging(0.999) | TCGA-AP-A051-01 | Endometrium | uterine corpus endometrioid carcinoma | Female | >=65 | I/II | Unknown | Unknown | SD |
| NADK2 | SNV | Missense_Mutation | c.1238N>T | p.Gly413Val | p.G413V | Q4G0N4 | protein_coding | deleterious(0) | probably_damaging(0.973) | TCGA-AP-A059-01 | Endometrium | uterine corpus endometrioid carcinoma | Female | >=65 | I/II | Unknown | Unknown | SD | |
| NADK2 | SNV | Missense_Mutation | rs149899492 | c.1174N>T | p.Arg392Cys | p.R392C | Q4G0N4 | protein_coding | deleterious(0) | probably_damaging(0.965) | TCGA-AX-A1CE-01 | Endometrium | uterine corpus endometrioid carcinoma | Female | <65 | I/II | Unspecific | Paclitaxel | SD |
| NADK2 | SNV | Missense_Mutation | novel | c.598N>T | p.His200Tyr | p.H200Y | Q4G0N4 | protein_coding | tolerated(0.46) | benign(0.027) | TCGA-AX-A1CE-01 | Endometrium | uterine corpus endometrioid carcinoma | Female | <65 | I/II | Unspecific | Paclitaxel | SD |
| Page: 1 2 3 4 |
Top |
Related drugs of malignant transformation related genes |
| Identification of chemicals and drugs interact with genes involved in malignant transfromation |
| (DGIdb 4.0) |
| Entrez ID | Symbol | Category | Interaction Types | Drug Claim Name | Drug Name | PMIDs |
| Page: 1 |

Copyright 2023-Present -The University of Texas Health Science Center at Houston |