
|
|||||
|
 | |
| |
| |
| |
| |
| |
|
Gene: NADK |
Gene summary for NADK |
| Gene information | Species | Human | Gene symbol | NADK | Gene ID | 65220 |
| Gene name | NAD kinase | |
| Gene Alias | dJ283E3.1 | |
| Cytomap | 1p36.33 | |
| Gene Type | protein-coding | GO ID | GO:0001678 | UniProtAcc | A0A024R058 |
Top |
Malignant transformation analysis |
| Identification of the aberrant gene expression in precancerous and cancerous lesions by comparing the gene expression of stem-like cells in diseased tissues with normal stem cells |
| Entrez ID | Symbol | Replicates | Species | Organ | Tissue | Adj P-value | Log2FC | Malignancy |
| 65220 | NADK | LZE5T | Human | Esophagus | ESCC | 5.92e-04 | 3.28e-01 | 0.0514 |
| 65220 | NADK | LZE7T | Human | Esophagus | ESCC | 5.17e-03 | 2.24e-01 | 0.0667 |
| 65220 | NADK | LZE20T | Human | Esophagus | ESCC | 3.94e-02 | 1.68e-01 | 0.0662 |
| 65220 | NADK | LZE22T | Human | Esophagus | ESCC | 1.12e-02 | 3.81e-01 | 0.068 |
| 65220 | NADK | LZE24T | Human | Esophagus | ESCC | 4.91e-10 | 2.58e-01 | 0.0596 |
| 65220 | NADK | P1T-E | Human | Esophagus | ESCC | 4.69e-02 | 2.52e-01 | 0.0875 |
| 65220 | NADK | P2T-E | Human | Esophagus | ESCC | 3.96e-15 | 3.10e-01 | 0.1177 |
| 65220 | NADK | P4T-E | Human | Esophagus | ESCC | 4.30e-16 | 3.67e-01 | 0.1323 |
| 65220 | NADK | P5T-E | Human | Esophagus | ESCC | 1.47e-14 | 2.35e-01 | 0.1327 |
| 65220 | NADK | P8T-E | Human | Esophagus | ESCC | 5.17e-27 | 4.79e-01 | 0.0889 |
| 65220 | NADK | P9T-E | Human | Esophagus | ESCC | 6.72e-07 | 2.14e-01 | 0.1131 |
| 65220 | NADK | P10T-E | Human | Esophagus | ESCC | 9.74e-22 | 3.51e-01 | 0.116 |
| 65220 | NADK | P11T-E | Human | Esophagus | ESCC | 1.29e-04 | 3.14e-01 | 0.1426 |
| 65220 | NADK | P12T-E | Human | Esophagus | ESCC | 1.02e-12 | 2.89e-01 | 0.1122 |
| 65220 | NADK | P15T-E | Human | Esophagus | ESCC | 5.31e-16 | 3.38e-01 | 0.1149 |
| 65220 | NADK | P16T-E | Human | Esophagus | ESCC | 1.88e-04 | 1.14e-01 | 0.1153 |
| 65220 | NADK | P17T-E | Human | Esophagus | ESCC | 7.67e-08 | 3.22e-01 | 0.1278 |
| 65220 | NADK | P19T-E | Human | Esophagus | ESCC | 1.30e-05 | 3.98e-01 | 0.1662 |
| 65220 | NADK | P20T-E | Human | Esophagus | ESCC | 1.44e-11 | 2.60e-01 | 0.1124 |
| 65220 | NADK | P21T-E | Human | Esophagus | ESCC | 1.77e-22 | 3.44e-01 | 0.1617 |
| Page: 1 2 3 4 5 |
| Tissue | Expression Dynamics | Abbreviation |
| Esophagus |  | ESCC: Esophageal squamous cell carcinoma |
| HGIN: High-grade intraepithelial neoplasias | ||
| LGIN: Low-grade intraepithelial neoplasias | ||
| Liver | 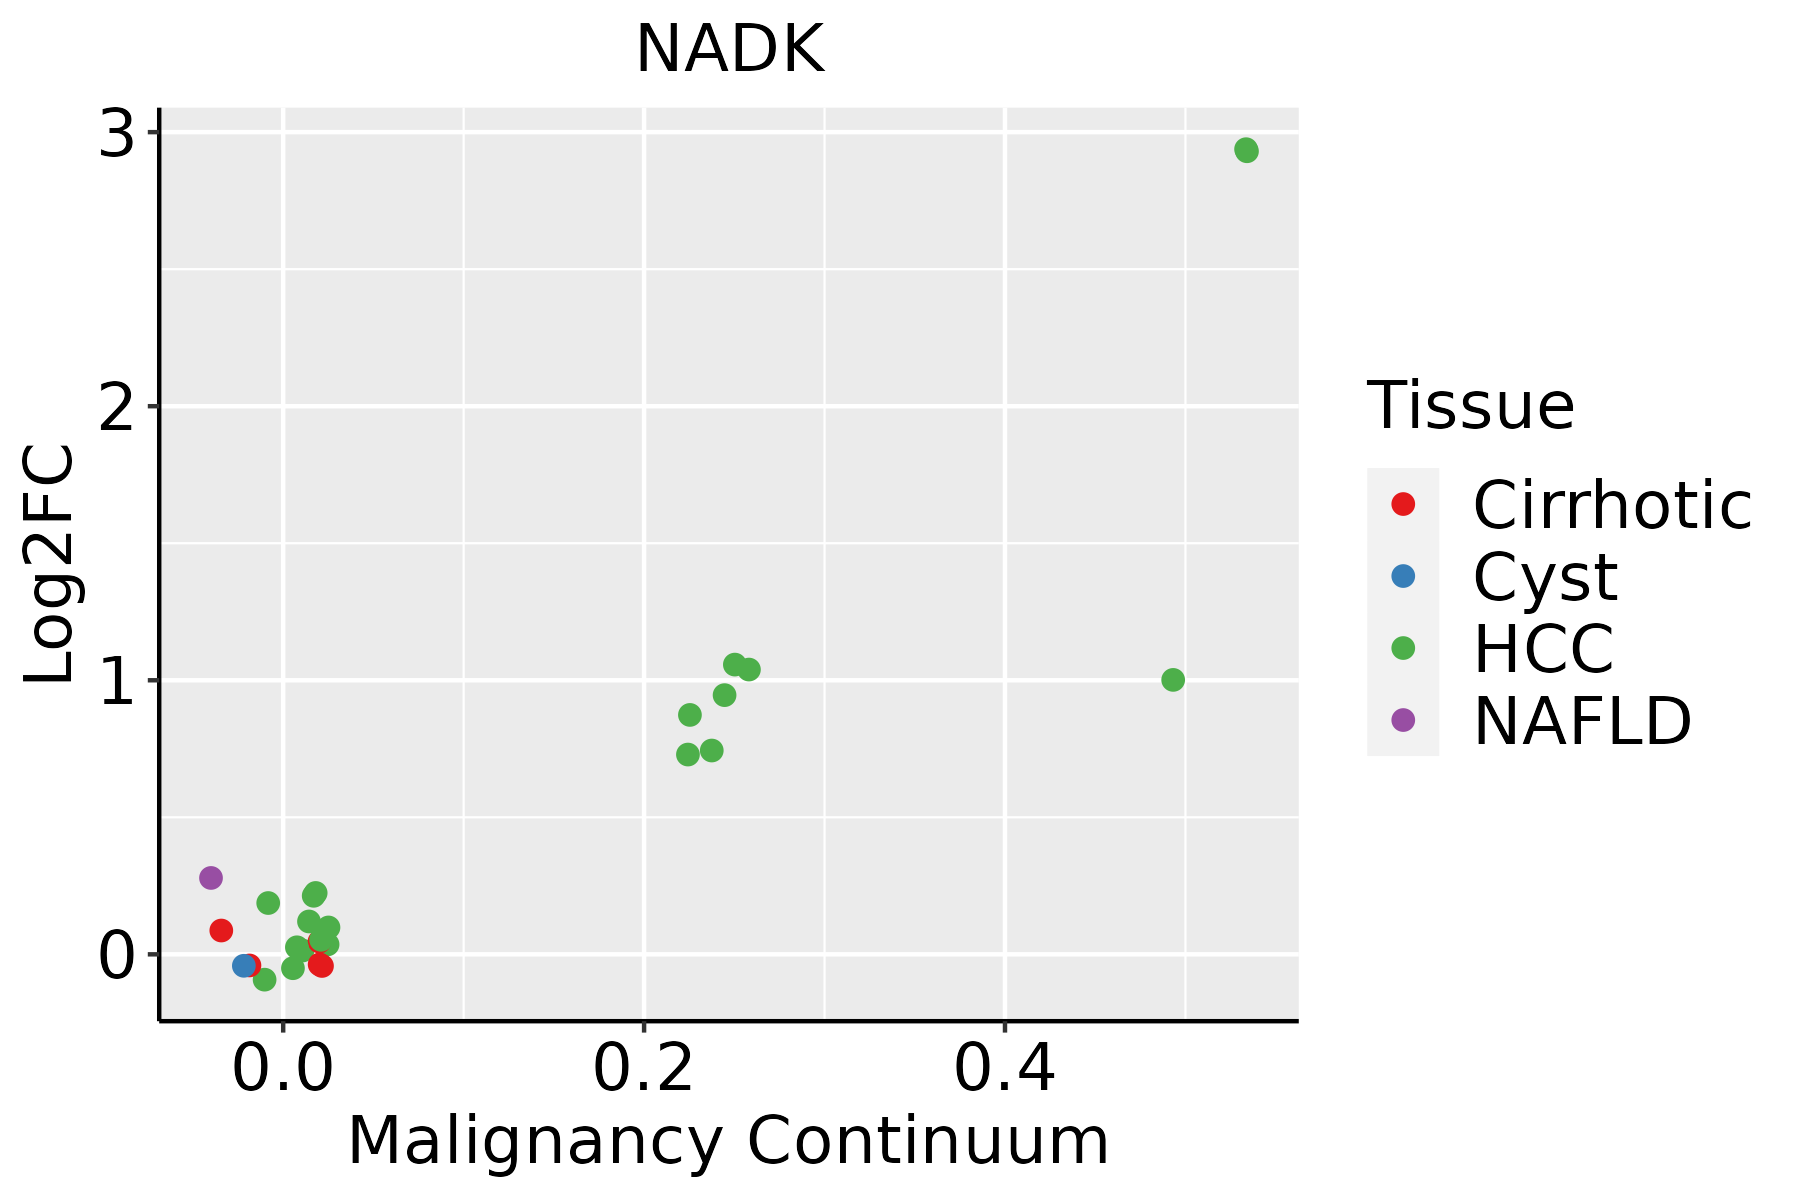 | HCC: Hepatocellular carcinoma |
| NAFLD: Non-alcoholic fatty liver disease | ||
| Oral Cavity | 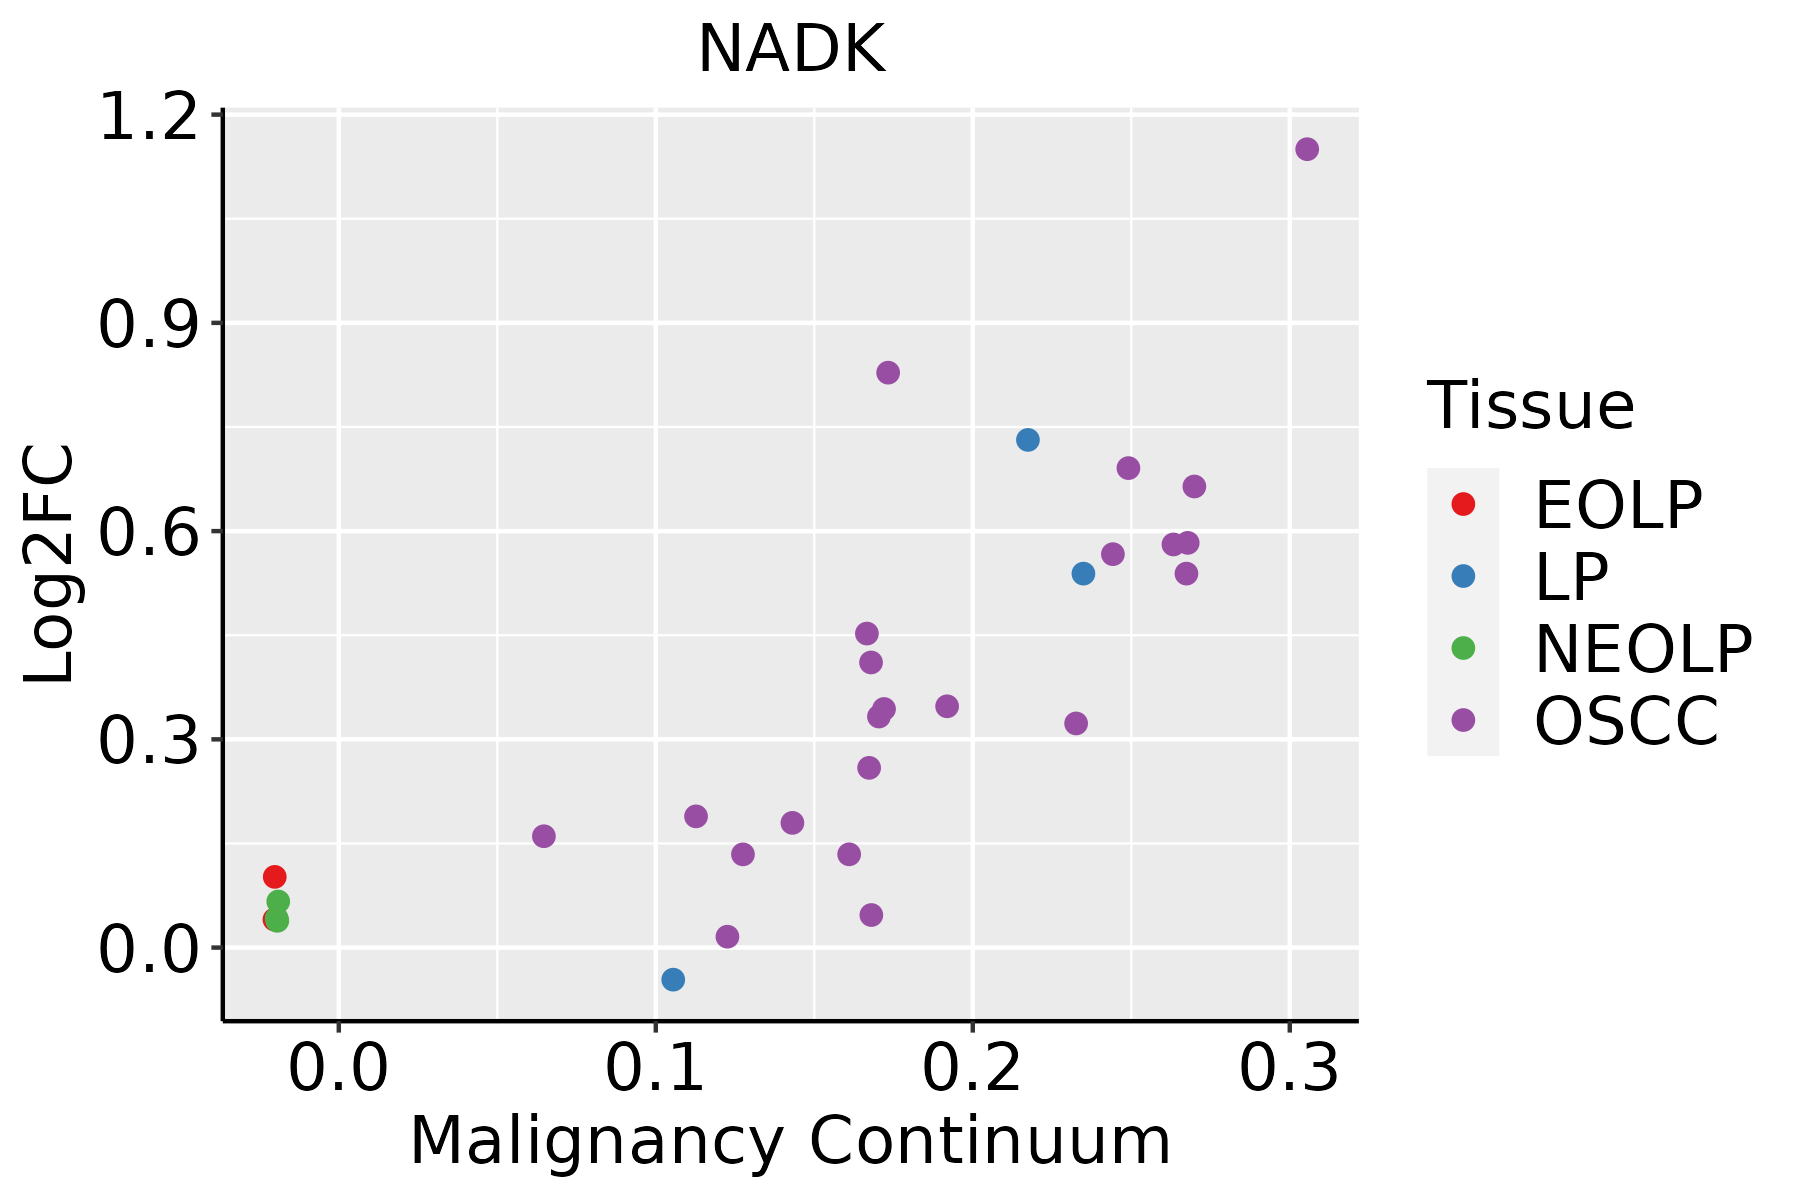 | EOLP: Erosive Oral lichen planus |
| LP: leukoplakia | ||
| NEOLP: Non-erosive oral lichen planus | ||
| OSCC: Oral squamous cell carcinoma |
| ∗log2FC in expression of this searched gene in stem-like cells from each diseased tissue sample relative to stem-like cells in normal samples in each tissue plotted against the malignancy continuum. Samples are colored based on if they are from different disease stage. |
Top |
Malignant transformation related pathway analysis |
| Find out the enriched GO biological processes and KEGG pathways involved in transition from healthy to precancer to cancer |
| Tissue | Disease Stage | Enriched GO biological Processes |
| Colorectum | AD |  |
| Colorectum | SER |  |
| Colorectum | MSS |  |
| Colorectum | MSI-H |  |
| Colorectum | FAP |  |
| ∗Top 15 enriched GO BP terms are showed in the bar plot of each disease state in each tissue. Each row represents a significant GO biological process which is colored according to the -log10(p.adjust). |
| Page: 1 2 3 4 5 6 7 8 9 |
| GO ID | Tissue | Disease Stage | Description | Gene Ratio | Bg Ratio | pvalue | p.adjust | Count |
| GO:1904951111 | Esophagus | ESCC | positive regulation of establishment of protein localization | 216/8552 | 319/18723 | 1.01e-15 | 6.86e-14 | 216 |
| GO:0051222111 | Esophagus | ESCC | positive regulation of protein transport | 204/8552 | 303/18723 | 1.56e-14 | 8.38e-13 | 204 |
| GO:0046034111 | Esophagus | ESCC | ATP metabolic process | 189/8552 | 277/18723 | 1.99e-14 | 1.04e-12 | 189 |
| GO:0006753110 | Esophagus | ESCC | nucleoside phosphate metabolic process | 288/8552 | 497/18723 | 1.80e-08 | 3.50e-07 | 288 |
| GO:0009117111 | Esophagus | ESCC | nucleotide metabolic process | 282/8552 | 489/18723 | 4.70e-08 | 8.50e-07 | 282 |
| GO:000916516 | Esophagus | ESCC | nucleotide biosynthetic process | 150/8552 | 254/18723 | 1.12e-05 | 1.06e-04 | 150 |
| GO:190129316 | Esophagus | ESCC | nucleoside phosphate biosynthetic process | 151/8552 | 256/18723 | 1.15e-05 | 1.08e-04 | 151 |
| GO:000930617 | Esophagus | ESCC | protein secretion | 190/8552 | 359/18723 | 3.22e-03 | 1.34e-02 | 190 |
| GO:003559217 | Esophagus | ESCC | establishment of protein localization to extracellular region | 190/8552 | 360/18723 | 3.77e-03 | 1.53e-02 | 190 |
| GO:007169210 | Esophagus | ESCC | protein localization to extracellular region | 193/8552 | 368/18723 | 5.01e-03 | 1.92e-02 | 193 |
| GO:0009743111 | Esophagus | ESCC | response to carbohydrate | 135/8552 | 253/18723 | 8.16e-03 | 2.89e-02 | 135 |
| GO:005070810 | Esophagus | ESCC | regulation of protein secretion | 142/8552 | 268/18723 | 9.31e-03 | 3.24e-02 | 142 |
| GO:005071416 | Esophagus | ESCC | positive regulation of protein secretion | 76/8552 | 137/18723 | 1.32e-02 | 4.31e-02 | 76 |
| GO:00067393 | Esophagus | ESCC | NADP metabolic process | 23/8552 | 35/18723 | 1.34e-02 | 4.38e-02 | 23 |
| GO:00091177 | Liver | NAFLD | nucleotide metabolic process | 85/1882 | 489/18723 | 3.31e-07 | 2.18e-05 | 85 |
| GO:00067537 | Liver | NAFLD | nucleoside phosphate metabolic process | 85/1882 | 497/18723 | 6.69e-07 | 3.83e-05 | 85 |
| GO:000675312 | Liver | Cirrhotic | nucleoside phosphate metabolic process | 190/4634 | 497/18723 | 1.10e-11 | 6.96e-10 | 190 |
| GO:000911712 | Liver | Cirrhotic | nucleotide metabolic process | 187/4634 | 489/18723 | 1.55e-11 | 9.63e-10 | 187 |
| GO:00091654 | Liver | Cirrhotic | nucleotide biosynthetic process | 89/4634 | 254/18723 | 1.45e-04 | 1.40e-03 | 89 |
| GO:19012934 | Liver | Cirrhotic | nucleoside phosphate biosynthetic process | 89/4634 | 256/18723 | 1.97e-04 | 1.82e-03 | 89 |
| Page: 1 2 3 4 5 |
| Pathway ID | Tissue | Disease Stage | Description | Gene Ratio | Bg Ratio | pvalue | p.adjust | qvalue | Count |
| hsa012405 | Esophagus | ESCC | Biosynthesis of cofactors | 97/4205 | 153/8465 | 3.88e-04 | 1.35e-03 | 6.94e-04 | 97 |
| hsa0124012 | Esophagus | ESCC | Biosynthesis of cofactors | 97/4205 | 153/8465 | 3.88e-04 | 1.35e-03 | 6.94e-04 | 97 |
| hsa012402 | Liver | HCC | Biosynthesis of cofactors | 103/4020 | 153/8465 | 4.67e-07 | 5.05e-06 | 2.81e-06 | 103 |
| hsa012403 | Liver | HCC | Biosynthesis of cofactors | 103/4020 | 153/8465 | 4.67e-07 | 5.05e-06 | 2.81e-06 | 103 |
| hsa012404 | Oral cavity | OSCC | Biosynthesis of cofactors | 88/3704 | 153/8465 | 3.84e-04 | 1.20e-03 | 6.12e-04 | 88 |
| hsa0124011 | Oral cavity | OSCC | Biosynthesis of cofactors | 88/3704 | 153/8465 | 3.84e-04 | 1.20e-03 | 6.12e-04 | 88 |
| hsa0124021 | Oral cavity | LP | Biosynthesis of cofactors | 57/2418 | 153/8465 | 1.17e-02 | 3.91e-02 | 2.52e-02 | 57 |
| hsa0124031 | Oral cavity | LP | Biosynthesis of cofactors | 57/2418 | 153/8465 | 1.17e-02 | 3.91e-02 | 2.52e-02 | 57 |
| Page: 1 |
Top |
Cell-cell communication analysis |
| Identification of potential cell-cell interactions between two cell types and their ligand-receptor pairs for different disease states |
| Ligand | Receptor | LRpair | Pathway | Tissue | Disease Stage |
| Page: 1 |
Top |
Single-cell gene regulatory network inference analysis |
| Find out the significant the regulons (TFs) and the target genes of each regulon across cell types for different disease states |
| TF | Cell Type | Tissue | Disease Stage | Target Gene | RSS | Regulon Activity |
| ∗The dot plots of a searched regulon are shown for all cell subpopulations in each disease state of each tissue based on the regulon specific score inferred using pySCENIC and by calculating the average expression. |
| Page: 1 |
Top |
Somatic mutation of malignant transformation related genes |
| Annotation of somatic variants for genes involved in malignant transformation |
| Hugo Symbol | Variant Class | Variant Classification | dbSNP RS | HGVSc | HGVSp | HGVSp Short | SWISSPROT | BIOTYPE | SIFT | PolyPhen | Tumor Sample Barcode | Tissue | Histology | Sex | Age | Stage | Therapy Types | Drugs | Outcome |
| NADK | SNV | Missense_Mutation | c.841N>A | p.Val281Met | p.V281M | O95544 | protein_coding | deleterious(0) | probably_damaging(0.998) | TCGA-A7-A26H-01 | Breast | breast invasive carcinoma | Female | >=65 | I/II | Hormone Therapy | anastrozole | PD | |
| NADK | SNV | Missense_Mutation | novel | c.1370N>G | p.Gln457Arg | p.Q457R | O95544 | protein_coding | deleterious(0.02) | possibly_damaging(0.874) | TCGA-E9-A1NF-01 | Breast | breast invasive carcinoma | Female | <65 | I/II | Chemotherapy | doxorubicin | PD |
| NADK | SNV | Missense_Mutation | novel | c.1342C>A | p.Leu448Met | p.L448M | O95544 | protein_coding | deleterious(0.01) | probably_damaging(0.994) | TCGA-2W-A8YY-01 | Cervix | cervical & endocervical cancer | Female | <65 | I/II | Chemotherapy | cisplatin | CR |
| NADK | SNV | Missense_Mutation | novel | c.53C>T | p.Ala18Val | p.A18V | O95544 | protein_coding | deleterious_low_confidence(0.02) | benign(0.003) | TCGA-2W-A8YY-01 | Cervix | cervical & endocervical cancer | Female | <65 | I/II | Chemotherapy | cisplatin | CR |
| NADK | SNV | Missense_Mutation | c.30G>C | p.Met10Ile | p.M10I | O95544 | protein_coding | tolerated_low_confidence(0.14) | benign(0) | TCGA-C5-A902-01 | Cervix | cervical & endocervical cancer | Female | <65 | I/II | Chemotherapy | cisplatin | SD | |
| NADK | SNV | Missense_Mutation | novel | c.211G>A | p.Val71Met | p.V71M | O95544 | protein_coding | deleterious_low_confidence(0) | possibly_damaging(0.877) | TCGA-EA-A3HU-01 | Cervix | cervical & endocervical cancer | Female | <65 | I/II | Unknown | Unknown | SD |
| NADK | SNV | Missense_Mutation | c.653N>C | p.Arg218Thr | p.R218T | O95544 | protein_coding | deleterious(0.02) | possibly_damaging(0.521) | TCGA-IR-A3LH-01 | Cervix | cervical & endocervical cancer | Female | <65 | I/II | Chemotherapy | cisplatin | CR | |
| NADK | SNV | Missense_Mutation | rs745456337 | c.404N>A | p.Arg135Gln | p.R135Q | O95544 | protein_coding | tolerated_low_confidence(0.53) | benign(0) | TCGA-JX-A3Q0-01 | Cervix | cervical & endocervical cancer | Female | <65 | III/IV | Unknown | Unknown | SD |
| NADK | SNV | Missense_Mutation | rs377478067 | c.134N>A | p.Arg45His | p.R45H | O95544 | protein_coding | deleterious_low_confidence(0) | probably_damaging(0.997) | TCGA-VS-A9UD-01 | Cervix | cervical & endocervical cancer | Female | >=65 | III/IV | Chemotherapy | cisplatin | CR |
| NADK | SNV | Missense_Mutation | rs761321804 | c.1565N>T | p.Thr522Ile | p.T522I | O95544 | protein_coding | deleterious(0) | probably_damaging(0.995) | TCGA-A6-6140-01 | Colorectum | colon adenocarcinoma | Male | <65 | I/II | Chemotherapy | oxaliplatin | SD |
| Page: 1 2 3 4 5 6 |
Top |
Related drugs of malignant transformation related genes |
| Identification of chemicals and drugs interact with genes involved in malignant transfromation |
| (DGIdb 4.0) |
| Entrez ID | Symbol | Category | Interaction Types | Drug Claim Name | Drug Name | PMIDs |
| Page: 1 |

Copyright 2023-Present -The University of Texas Health Science Center at Houston |