
|
|||||
|
 | |
| |
| |
| |
| |
| |
|
Gene: NACC2 |
Gene summary for NACC2 |
| Gene information | Species | Human | Gene symbol | NACC2 | Gene ID | 138151 |
| Gene name | NACC family member 2 | |
| Gene Alias | BEND9 | |
| Cytomap | 9q34.3 | |
| Gene Type | protein-coding | GO ID | GO:0000082 | UniProtAcc | A0A024R8I0 |
Top |
Malignant transformation analysis |
| Identification of the aberrant gene expression in precancerous and cancerous lesions by comparing the gene expression of stem-like cells in diseased tissues with normal stem cells |
| Entrez ID | Symbol | Replicates | Species | Organ | Tissue | Adj P-value | Log2FC | Malignancy |
| 138151 | NACC2 | HCC1_Meng | Human | Liver | HCC | 6.70e-14 | 5.47e-03 | 0.0246 |
| 138151 | NACC2 | HCC2_Meng | Human | Liver | HCC | 2.30e-03 | 2.29e-02 | 0.0107 |
| 138151 | NACC2 | HCC2 | Human | Liver | HCC | 3.98e-06 | 2.90e+00 | 0.5341 |
| 138151 | NACC2 | S014 | Human | Liver | HCC | 1.03e-03 | 2.56e-01 | 0.2254 |
| 138151 | NACC2 | S015 | Human | Liver | HCC | 2.71e-06 | 3.85e-01 | 0.2375 |
| 138151 | NACC2 | S016 | Human | Liver | HCC | 3.00e-06 | 2.79e-01 | 0.2243 |
| 138151 | NACC2 | S027 | Human | Liver | HCC | 3.40e-05 | 5.38e-01 | 0.2446 |
| 138151 | NACC2 | S028 | Human | Liver | HCC | 4.33e-17 | 7.04e-01 | 0.2503 |
| 138151 | NACC2 | S029 | Human | Liver | HCC | 3.47e-09 | 4.82e-01 | 0.2581 |
| Page: 1 |
| Tissue | Expression Dynamics | Abbreviation |
| Liver | 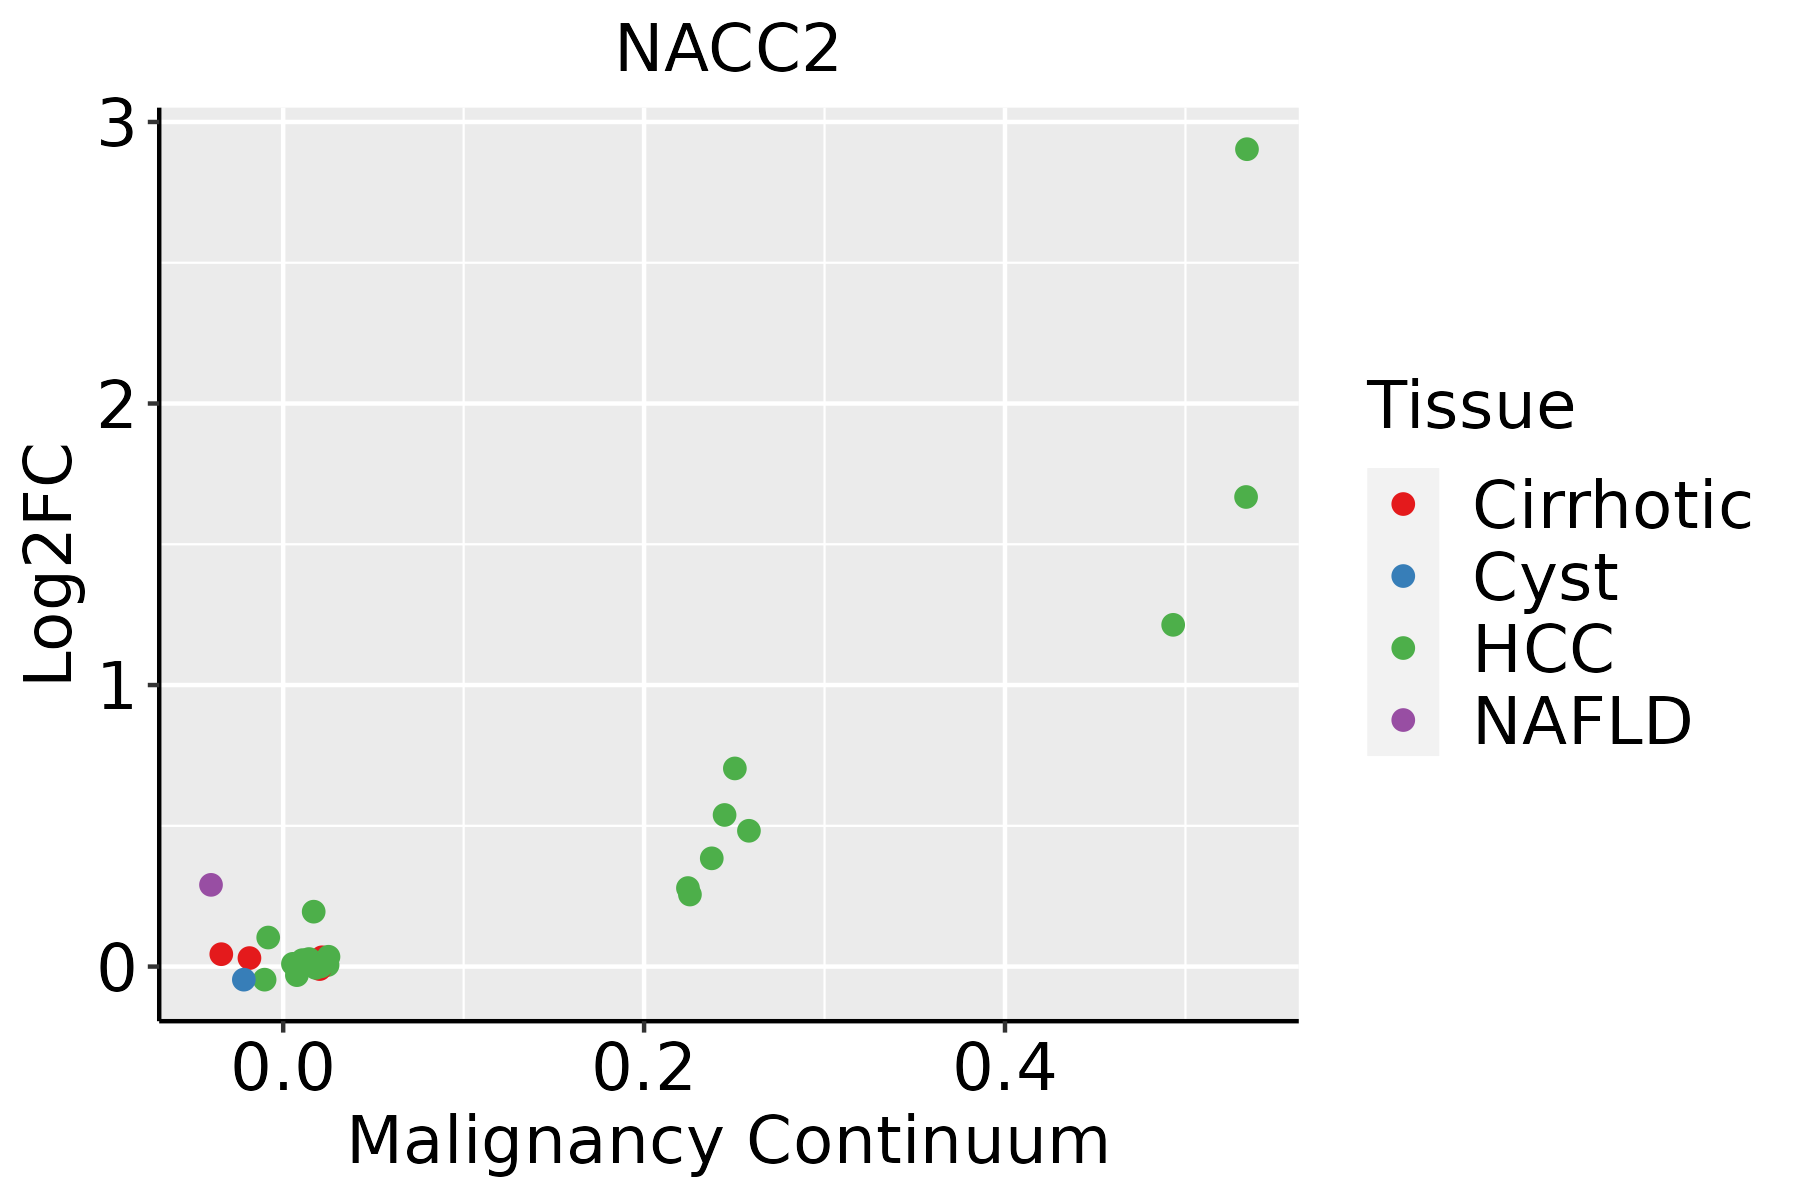 | HCC: Hepatocellular carcinoma |
| NAFLD: Non-alcoholic fatty liver disease |
| ∗log2FC in expression of this searched gene in stem-like cells from each diseased tissue sample relative to stem-like cells in normal samples in each tissue plotted against the malignancy continuum. Samples are colored based on if they are from different disease stage. |
Top |
Malignant transformation related pathway analysis |
| Find out the enriched GO biological processes and KEGG pathways involved in transition from healthy to precancer to cancer |
| Tissue | Disease Stage | Enriched GO biological Processes |
| Colorectum | AD |  |
| Colorectum | SER |  |
| Colorectum | MSS |  |
| Colorectum | MSI-H |  |
| Colorectum | FAP |  |
| ∗Top 15 enriched GO BP terms are showed in the bar plot of each disease state in each tissue. Each row represents a significant GO biological process which is colored according to the -log10(p.adjust). |
| Page: 1 2 3 4 5 6 7 8 9 |
| GO ID | Tissue | Disease Stage | Description | Gene Ratio | Bg Ratio | pvalue | p.adjust | Count |
| GO:200123322 | Liver | HCC | regulation of apoptotic signaling pathway | 226/7958 | 356/18723 | 7.26e-16 | 5.68e-14 | 226 |
| GO:009719322 | Liver | HCC | intrinsic apoptotic signaling pathway | 184/7958 | 288/18723 | 1.50e-13 | 8.32e-12 | 184 |
| GO:200124212 | Liver | HCC | regulation of intrinsic apoptotic signaling pathway | 109/7958 | 164/18723 | 4.52e-10 | 1.45e-08 | 109 |
| GO:00447722 | Liver | HCC | mitotic cell cycle phase transition | 240/7958 | 424/18723 | 2.47e-09 | 6.84e-08 | 240 |
| GO:000734611 | Liver | HCC | regulation of mitotic cell cycle | 255/7958 | 457/18723 | 4.96e-09 | 1.30e-07 | 255 |
| GO:00315031 | Liver | HCC | protein-containing complex localization | 129/7958 | 220/18723 | 9.38e-07 | 1.42e-05 | 129 |
| GO:200102021 | Liver | HCC | regulation of response to DNA damage stimulus | 128/7958 | 219/18723 | 1.31e-06 | 1.90e-05 | 128 |
| GO:19019901 | Liver | HCC | regulation of mitotic cell cycle phase transition | 167/7958 | 299/18723 | 1.96e-06 | 2.71e-05 | 167 |
| GO:19019871 | Liver | HCC | regulation of cell cycle phase transition | 211/7958 | 390/18723 | 2.11e-06 | 2.89e-05 | 211 |
| GO:200123522 | Liver | HCC | positive regulation of apoptotic signaling pathway | 79/7958 | 126/18723 | 3.70e-06 | 4.82e-05 | 79 |
| GO:0045786 | Liver | HCC | negative regulation of cell cycle | 204/7958 | 385/18723 | 1.84e-05 | 1.99e-04 | 204 |
| GO:00448432 | Liver | HCC | cell cycle G1/S phase transition | 134/7958 | 241/18723 | 2.60e-05 | 2.70e-04 | 134 |
| GO:0045930 | Liver | HCC | negative regulation of mitotic cell cycle | 130/7958 | 235/18723 | 4.69e-05 | 4.50e-04 | 130 |
| GO:00000822 | Liver | HCC | G1/S transition of mitotic cell cycle | 119/7958 | 214/18723 | 7.11e-05 | 6.39e-04 | 119 |
| GO:200102211 | Liver | HCC | positive regulation of response to DNA damage stimulus | 64/7958 | 105/18723 | 1.03e-04 | 8.88e-04 | 64 |
| GO:200124421 | Liver | HCC | positive regulation of intrinsic apoptotic signaling pathway | 38/7958 | 58/18723 | 3.37e-04 | 2.36e-03 | 38 |
| GO:1901988 | Liver | HCC | negative regulation of cell cycle phase transition | 132/7958 | 249/18723 | 4.97e-04 | 3.25e-03 | 132 |
| GO:0010948 | Liver | HCC | negative regulation of cell cycle process | 152/7958 | 294/18723 | 8.50e-04 | 5.08e-03 | 152 |
| GO:000863011 | Liver | HCC | intrinsic apoptotic signaling pathway in response to DNA damage | 58/7958 | 99/18723 | 8.97e-04 | 5.29e-03 | 58 |
| GO:0034629 | Liver | HCC | cellular protein-containing complex localization | 17/7958 | 22/18723 | 9.84e-04 | 5.70e-03 | 17 |
| Page: 1 2 |
| Pathway ID | Tissue | Disease Stage | Description | Gene Ratio | Bg Ratio | pvalue | p.adjust | qvalue | Count |
| Page: 1 |
Top |
Cell-cell communication analysis |
| Identification of potential cell-cell interactions between two cell types and their ligand-receptor pairs for different disease states |
| Ligand | Receptor | LRpair | Pathway | Tissue | Disease Stage |
| Page: 1 |
Top |
Single-cell gene regulatory network inference analysis |
| Find out the significant the regulons (TFs) and the target genes of each regulon across cell types for different disease states |
| TF | Cell Type | Tissue | Disease Stage | Target Gene | RSS | Regulon Activity |
| ∗The dot plots of a searched regulon are shown for all cell subpopulations in each disease state of each tissue based on the regulon specific score inferred using pySCENIC and by calculating the average expression. |
| Page: 1 |
Top |
Somatic mutation of malignant transformation related genes |
| Annotation of somatic variants for genes involved in malignant transformation |
| Hugo Symbol | Variant Class | Variant Classification | dbSNP RS | HGVSc | HGVSp | HGVSp Short | SWISSPROT | BIOTYPE | SIFT | PolyPhen | Tumor Sample Barcode | Tissue | Histology | Sex | Age | Stage | Therapy Types | Drugs | Outcome |
| NACC2 | SNV | Missense_Mutation | novel | c.1130N>A | p.Arg377Gln | p.R377Q | Q96BF6 | protein_coding | deleterious(0) | possibly_damaging(0.864) | TCGA-2W-A8YY-01 | Cervix | cervical & endocervical cancer | Female | <65 | I/II | Chemotherapy | cisplatin | CR |
| NACC2 | SNV | Missense_Mutation | novel | c.22N>A | p.Glu8Lys | p.E8K | Q96BF6 | protein_coding | deleterious(0) | probably_damaging(0.991) | TCGA-2W-A8YY-01 | Cervix | cervical & endocervical cancer | Female | <65 | I/II | Chemotherapy | cisplatin | CR |
| NACC2 | SNV | Missense_Mutation | c.1492N>A | p.Glu498Lys | p.E498K | Q96BF6 | protein_coding | deleterious_low_confidence(0) | benign(0.173) | TCGA-EK-A2RK-01 | Cervix | cervical & endocervical cancer | Female | >=65 | I/II | Unknown | Unknown | SD | |
| NACC2 | SNV | Missense_Mutation | c.1093C>T | p.His365Tyr | p.H365Y | Q96BF6 | protein_coding | deleterious(0) | possibly_damaging(0.601) | TCGA-A6-2686-01 | Colorectum | colon adenocarcinoma | Female | >=65 | I/II | Unknown | Unknown | SD | |
| NACC2 | SNV | Missense_Mutation | rs368687607 | c.1499N>A | p.Arg500Gln | p.R500Q | Q96BF6 | protein_coding | deleterious_low_confidence(0) | benign(0.269) | TCGA-AD-6964-01 | Colorectum | colon adenocarcinoma | Male | <65 | III/IV | Chemotherapy | folfox | PD |
| NACC2 | SNV | Missense_Mutation | novel | c.313N>A | p.Gly105Ser | p.G105S | Q96BF6 | protein_coding | tolerated(0.26) | probably_damaging(1) | TCGA-CA-5254-01 | Colorectum | colon adenocarcinoma | Female | <65 | I/II | Chemotherapy | oxaliplatin | CR |
| NACC2 | SNV | Missense_Mutation | c.1165C>A | p.Leu389Met | p.L389M | Q96BF6 | protein_coding | deleterious(0) | probably_damaging(1) | TCGA-G4-6309-01 | Colorectum | colon adenocarcinoma | Female | <65 | III/IV | Chemotherapy | xeloda | PD | |
| NACC2 | SNV | Missense_Mutation | novel | c.89G>A | p.Cys30Tyr | p.C30Y | Q96BF6 | protein_coding | deleterious(0) | probably_damaging(1) | TCGA-G4-6309-01 | Colorectum | colon adenocarcinoma | Female | <65 | III/IV | Chemotherapy | xeloda | PD |
| NACC2 | SNV | Missense_Mutation | rs771765166 | c.992G>A | p.Arg331His | p.R331H | Q96BF6 | protein_coding | deleterious(0) | probably_damaging(0.998) | TCGA-G4-6588-01 | Colorectum | colon adenocarcinoma | Female | <65 | I/II | Unknown | Unknown | SD |
| NACC2 | SNV | Missense_Mutation | c.1399N>T | p.Arg467Cys | p.R467C | Q96BF6 | protein_coding | deleterious(0) | benign(0.007) | TCGA-G4-6626-01 | Colorectum | colon adenocarcinoma | Male | >=65 | I/II | Unknown | Unknown | SD |
| Page: 1 2 3 4 5 |
Top |
Related drugs of malignant transformation related genes |
| Identification of chemicals and drugs interact with genes involved in malignant transfromation |
| (DGIdb 4.0) |
| Entrez ID | Symbol | Category | Interaction Types | Drug Claim Name | Drug Name | PMIDs |
| Page: 1 |

Copyright 2023-Present -The University of Texas Health Science Center at Houston |