Schematic overview of the cellular and molecular mechanisms involved in the cancer progression, including the proposed cellular and molecular mechanisms in cancer cells trajectory. AT1: alveolar type 1 cells; AT2: alveolar type 2 cells; AAH: atypical adenomatous hyperplasia; AIS: adenocarcinoma in situ; MIA: minimally invasive adenocarcinoma; IA: invasive adenocarcinoma; EMT: epithelial-mesenchymal transition

Home

Download

Statistics

Help

Contact

Center for Computational Systems Medicine
leaf

Gene summary

leaf

Malignant transformation analysis

leaf

Malignant transformation related pathway analysis

leaf

Cell-cell communication analysis

leaf

Single-cell gene regulatory network inference analysis

leaf

Somatic mutation of malignant transformation related genes

leaf

Related drugs of malignant transformation related genes

Gene: NABP2

Gene summary for NABP2

check button Gene summary.

Gene informationSpeciesHuman
Gene symbol

NABP2

Gene ID

79035

Gene namenucleic acid binding protein 2
Gene AliasOBFC2B
Cytomap12q13.3
Gene Typeprotein-coding
GO ID

GO:0000075

UniProtAcc

A0A024RB89


Top

Malignant transformation analysis

check button Identification of the aberrant gene expression in precancerous and cancerous lesions by comparing the gene expression of stem-like cells in diseased tissues with normal stem cells
check button Malignant transformation involving gene list.
Entrez IDSymbolReplicatesSpeciesOrganTissueAdj P-valueLog2FCMalignancy
79035NABP2LZE4THumanEsophagusESCC6.56e-051.95e-010.0811
79035NABP2LZE7THumanEsophagusESCC1.47e-086.33e-010.0667
79035NABP2LZE8THumanEsophagusESCC1.12e-102.81e-010.067
79035NABP2LZE22THumanEsophagusESCC2.29e-043.49e-010.068
79035NABP2LZE24THumanEsophagusESCC2.62e-195.53e-010.0596
79035NABP2LZE21THumanEsophagusESCC1.34e-043.42e-010.0655
79035NABP2LZE6THumanEsophagusESCC8.01e-074.76e-010.0845
79035NABP2P1T-EHumanEsophagusESCC3.43e-064.60e-010.0875
79035NABP2P2T-EHumanEsophagusESCC5.76e-388.18e-010.1177
79035NABP2P4T-EHumanEsophagusESCC4.96e-317.67e-010.1323
79035NABP2P5T-EHumanEsophagusESCC2.93e-316.76e-010.1327
79035NABP2P8T-EHumanEsophagusESCC6.48e-265.59e-010.0889
79035NABP2P9T-EHumanEsophagusESCC2.42e-173.75e-010.1131
79035NABP2P10T-EHumanEsophagusESCC1.91e-285.58e-010.116
79035NABP2P11T-EHumanEsophagusESCC3.19e-165.86e-010.1426
79035NABP2P12T-EHumanEsophagusESCC2.50e-295.95e-010.1122
79035NABP2P15T-EHumanEsophagusESCC9.17e-204.82e-010.1149
79035NABP2P16T-EHumanEsophagusESCC9.24e-275.64e-010.1153
79035NABP2P17T-EHumanEsophagusESCC2.16e-144.69e-010.1278
79035NABP2P19T-EHumanEsophagusESCC8.33e-101.28e+000.1662
Page: 1 2 3 4 5 6 

check button Transcriptomic changes along malignancy continuum.
TissueExpression DynamicsAbbreviation
EsophagusThe image shows the transcriptomic changes along malignancy continuum.log2FC in expression of this searched gene in stem-like cells from each diseased tissue sample relative to stem-like cells in normal samples in each tissue plotted against the malignancy continuum. Samples are colored based on if they are from different disease stage.
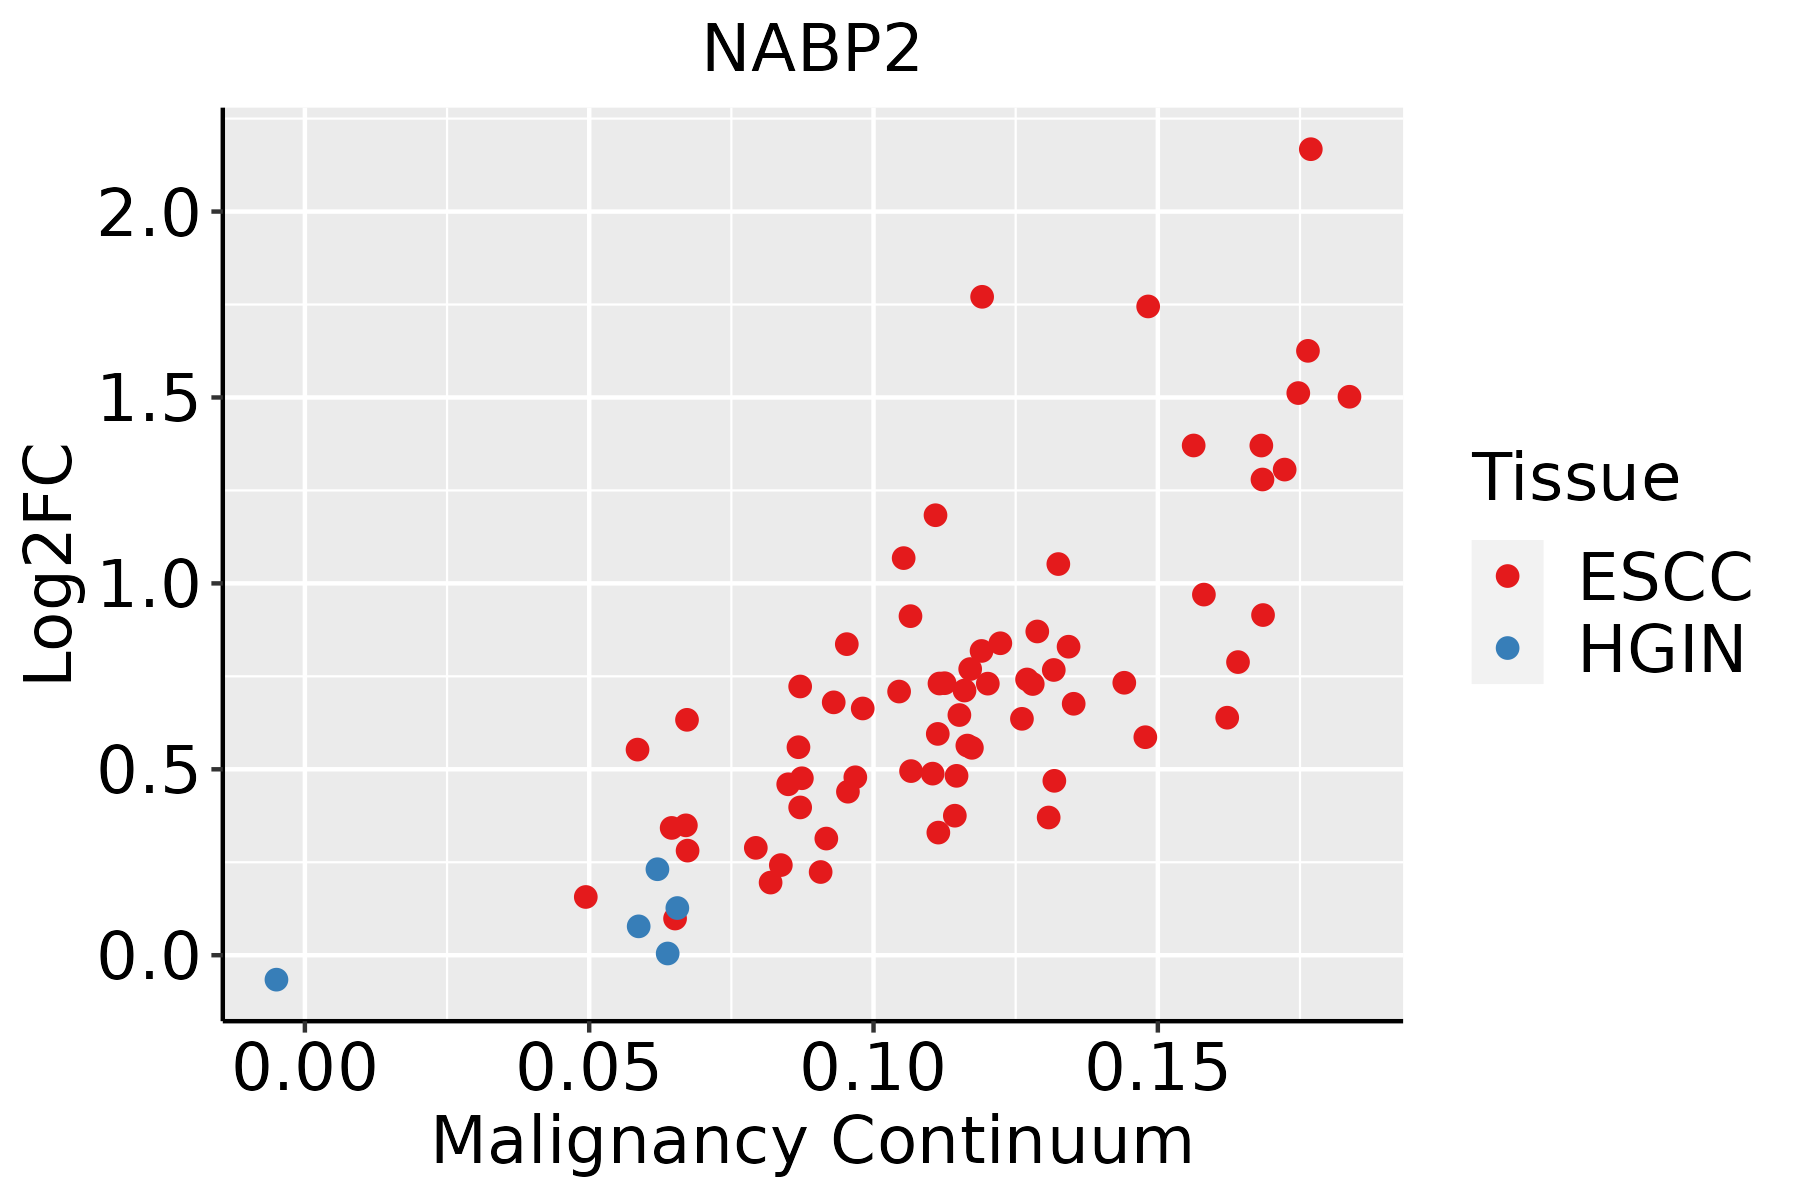
ESCC: Esophageal squamous cell carcinoma
HGIN: High-grade intraepithelial neoplasias
LGIN: Low-grade intraepithelial neoplasias
LiverThe image shows the transcriptomic changes along malignancy continuum.log2FC in expression of this searched gene in stem-like cells from each diseased tissue sample relative to stem-like cells in normal samples in each tissue plotted against the malignancy continuum. Samples are colored based on if they are from different disease stage.HCC: Hepatocellular carcinoma
NAFLD: Non-alcoholic fatty liver disease
Oral CavityThe image shows the transcriptomic changes along malignancy continuum.log2FC in expression of this searched gene in stem-like cells from each diseased tissue sample relative to stem-like cells in normal samples in each tissue plotted against the malignancy continuum. Samples are colored based on if they are from different disease stage.
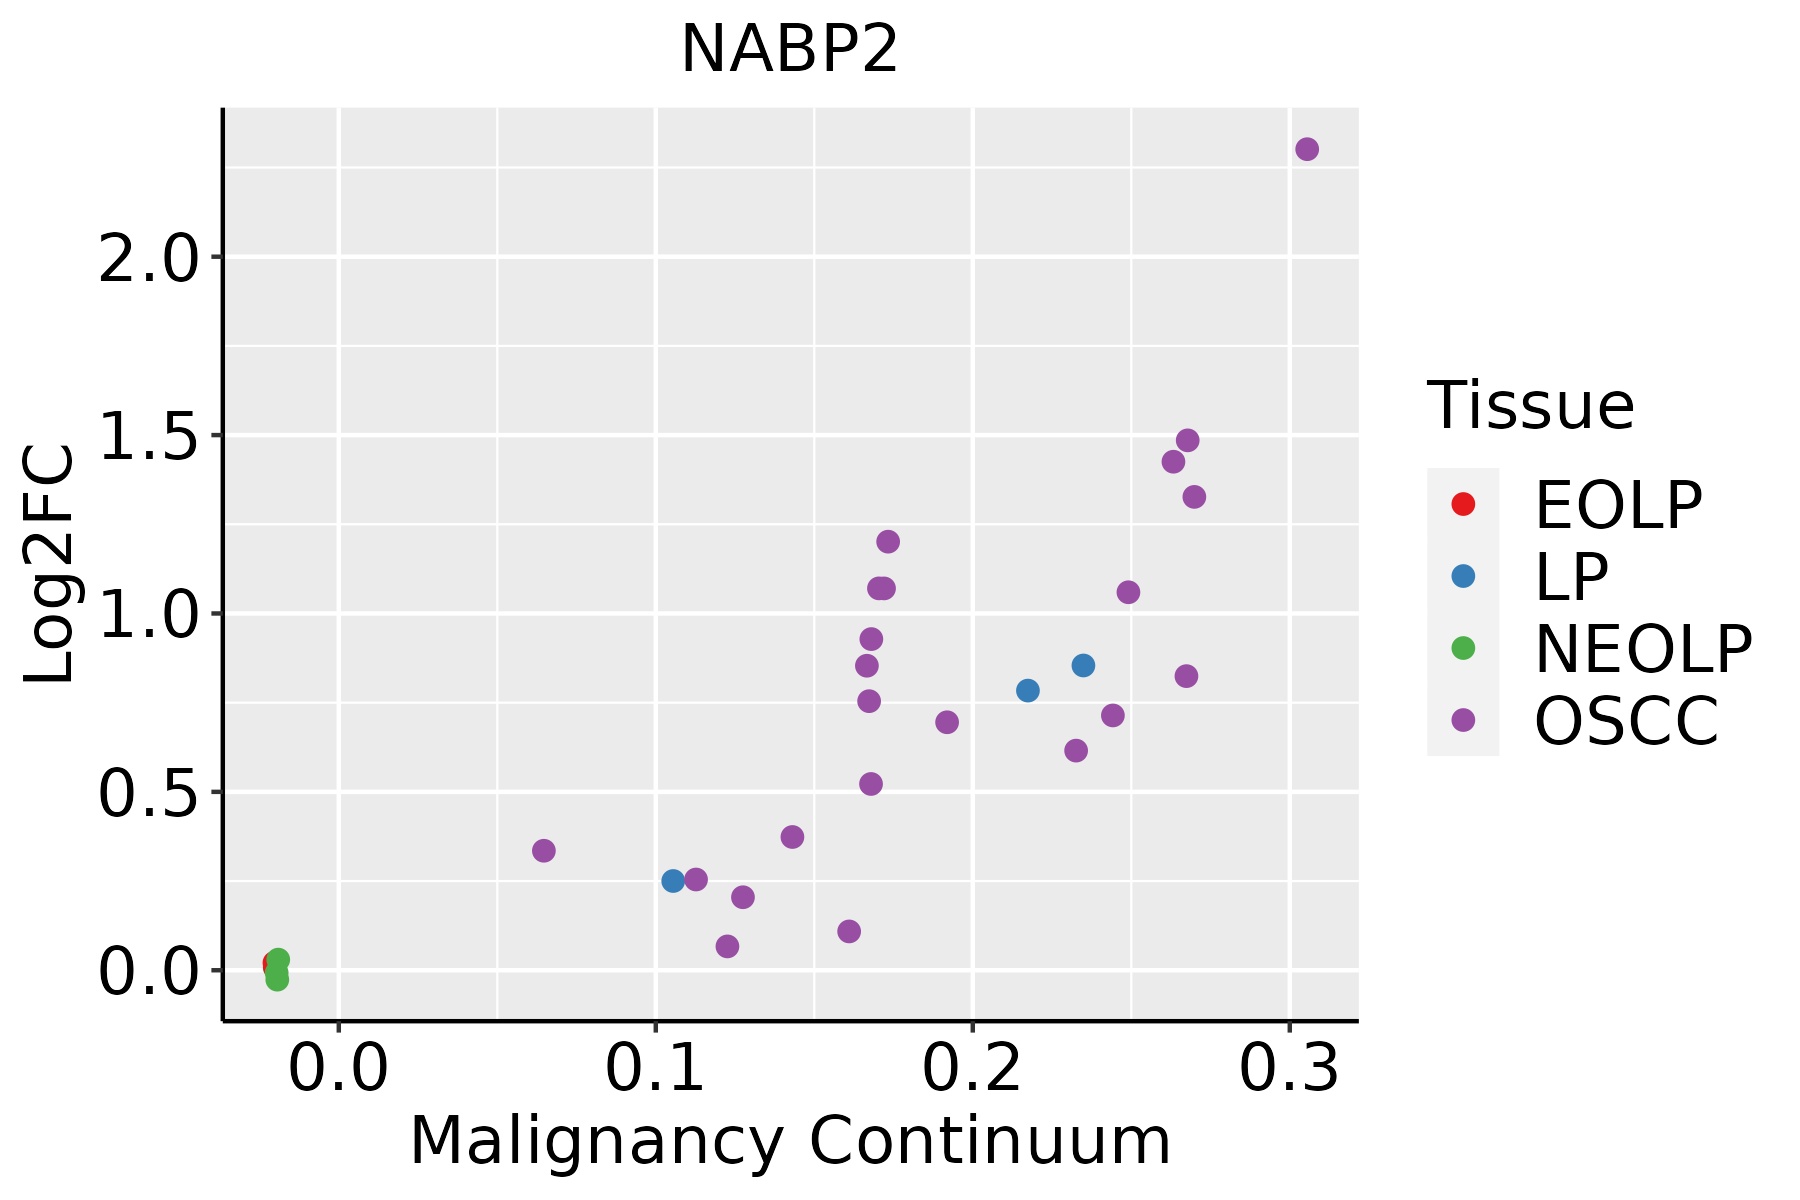
EOLP: Erosive Oral lichen planus
LP: leukoplakia
NEOLP: Non-erosive oral lichen planus
OSCC: Oral squamous cell carcinoma
SkinThe image shows the transcriptomic changes along malignancy continuum.log2FC in expression of this searched gene in stem-like cells from each diseased tissue sample relative to stem-like cells in normal samples in each tissue plotted against the malignancy continuum. Samples are colored based on if they are from different disease stage.
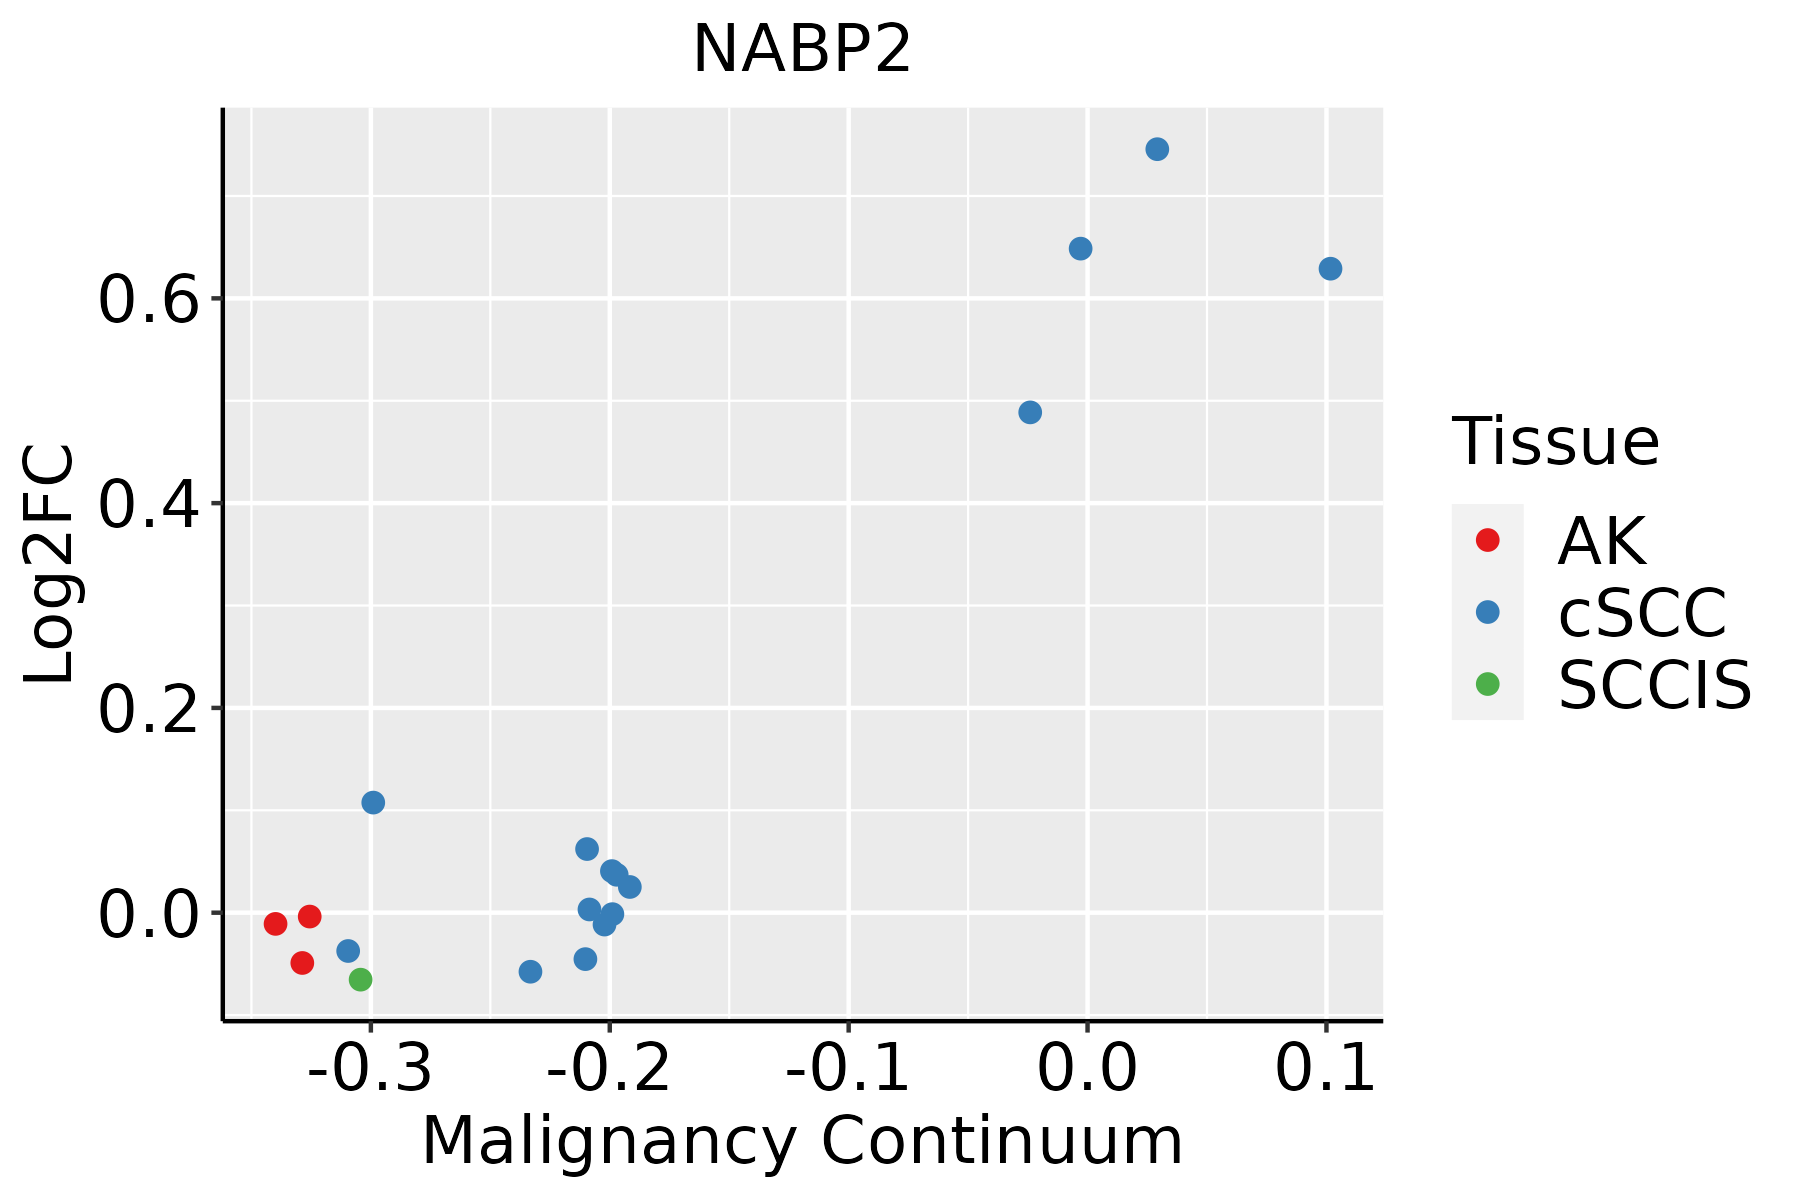
AK: Actinic keratosis
cSCC: Cutaneous squamous cell carcinoma
SCCIS:squamous cell carcinoma in situ
ThyroidThe image shows the transcriptomic changes along malignancy continuum.log2FC in expression of this searched gene in stem-like cells from each diseased tissue sample relative to stem-like cells in normal samples in each tissue plotted against the malignancy continuum. Samples are colored based on if they are from different disease stage.
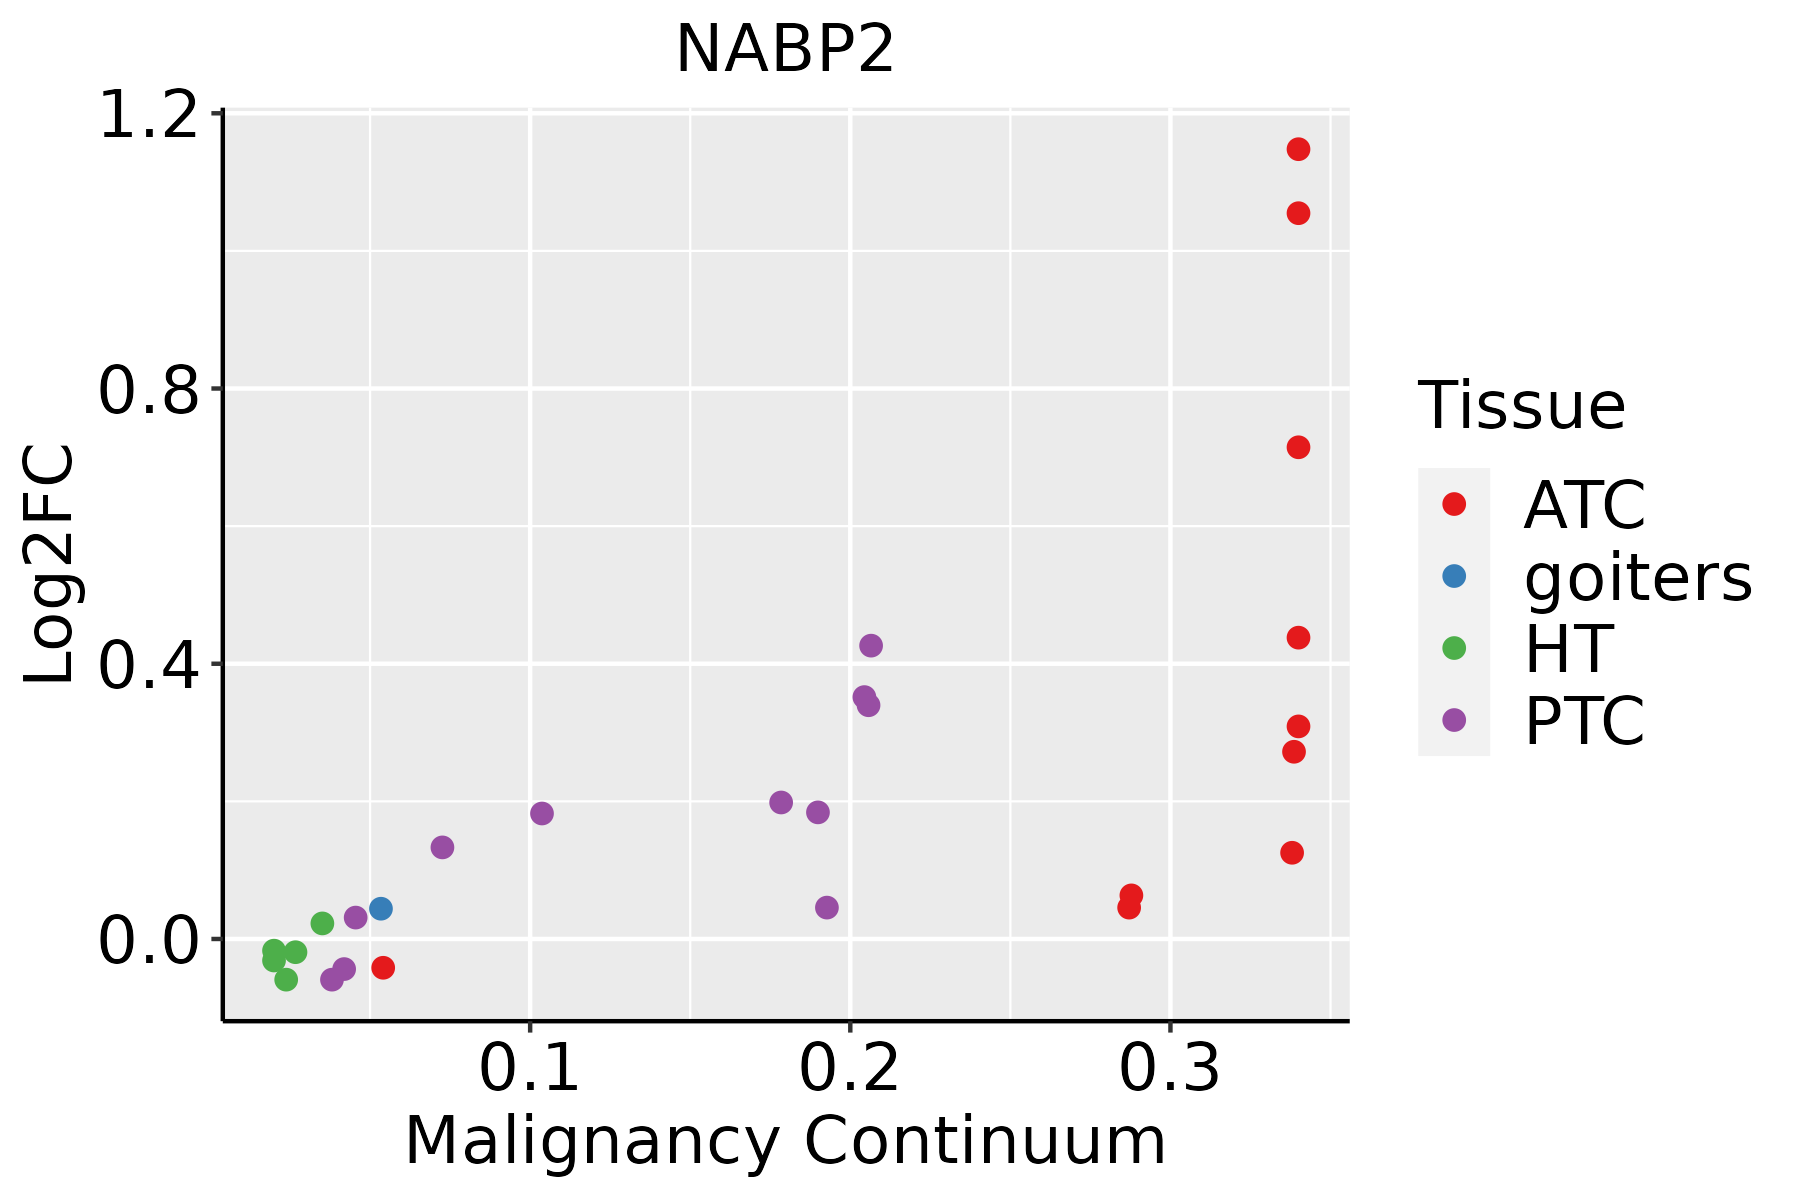
ATC: Anaplastic thyroid cancer
HT: Hashimoto's thyroiditis
PTC: Papillary thyroid cancer
∗log2FC in expression of this searched gene in stem-like cells from each diseased tissue sample relative to stem-like cells in normal samples in each tissue plotted against the malignancy continuum. Samples are colored based on if they are from different disease stage.

Top

Malignant transformation related pathway analysis

check buttonFind out the enriched GO biological processes and KEGG pathways involved in transition from healthy to precancer to cancer
check button Figure of enriched GO biological processes.
TissueDisease StageEnriched GO biological Processes
ColorectumADGO analysis - Figure of enriched GO biological processes: Top 15 enriched GO BP terms are showed in the bar plot of each disease state in each tissue. Each row represents a significant GO biological process which is colored according to the -log10(p.adjust).
ColorectumSERGO analysis - Figure of enriched GO biological processes: Top 15 enriched GO BP terms are showed in the bar plot of each disease state in each tissue. Each row represents a significant GO biological process which is colored according to the -log10(p.adjust).
ColorectumMSSGO analysis - Figure of enriched GO biological processes: Top 15 enriched GO BP terms are showed in the bar plot of each disease state in each tissue. Each row represents a significant GO biological process which is colored according to the -log10(p.adjust).
ColorectumMSI-HGO analysis - Figure of enriched GO biological processes: Top 15 enriched GO BP terms are showed in the bar plot of each disease state in each tissue. Each row represents a significant GO biological process which is colored according to the -log10(p.adjust).
ColorectumFAPGO analysis - Figure of enriched GO biological processes: Top 15 enriched GO BP terms are showed in the bar plot of each disease state in each tissue. Each row represents a significant GO biological process which is colored according to the -log10(p.adjust).
∗Top 15 enriched GO BP terms are showed in the bar plot of each disease state in each tissue. Each row represents a significant GO biological process which is colored according to the -log10(p.adjust).
Page: 1 2 3 4 5 6 7 8 9 

check button Enriched GO biological processes.
GO IDTissueDisease StageDescriptionGene RatioBg Ratiopvaluep.adjustCount
GO:0072594110EsophagusESCCestablishment of protein localization to organelle311/8552422/187233.02e-322.13e-29311
GO:003304416EsophagusESCCregulation of chromosome organization145/8552187/187233.80e-194.31e-17145
GO:004477216EsophagusESCCmitotic cell cycle phase transition281/8552424/187234.63e-184.45e-16281
GO:000734615EsophagusESCCregulation of mitotic cell cycle293/8552457/187238.00e-165.64e-14293
GO:005105215EsophagusESCCregulation of DNA metabolic process232/8552359/187232.40e-131.13e-11232
GO:001021217EsophagusESCCresponse to ionizing radiation110/8552148/187231.11e-124.78e-11110
GO:000072319EsophagusESCCtelomere maintenance99/8552131/187232.68e-121.08e-1099
GO:005105417EsophagusESCCpositive regulation of DNA metabolic process139/8552201/187231.20e-114.33e-10139
GO:190198713EsophagusESCCregulation of cell cycle phase transition242/8552390/187233.86e-111.26e-09242
GO:000931419EsophagusESCCresponse to radiation277/8552456/187234.42e-111.43e-09277
GO:003220417EsophagusESCCregulation of telomere maintenance65/855280/187236.02e-111.90e-0965
GO:190199013EsophagusESCCregulation of mitotic cell cycle phase transition191/8552299/187231.35e-103.94e-09191
GO:00457865EsophagusESCCnegative regulation of cell cycle236/8552385/187233.62e-109.93e-09236
GO:00000754EsophagusESCCcell cycle checkpoint117/8552169/187234.47e-101.17e-08117
GO:200125219EsophagusESCCpositive regulation of chromosome organization64/855282/187231.98e-094.52e-0864
GO:003450211EsophagusESCCprotein localization to chromosome70/855292/187232.54e-095.64e-0870
GO:00448394EsophagusESCCcell cycle G2/M phase transition103/8552148/187233.09e-096.67e-08103
GO:00000864EsophagusESCCG2/M transition of mitotic cell cycle96/8552137/187236.00e-091.23e-0796
GO:00070934EsophagusESCCmitotic cell cycle checkpoint90/8552129/187232.49e-084.69e-0790
GO:003220618EsophagusESCCpositive regulation of telomere maintenance42/855252/187232.15e-073.30e-0642
Page: 1 2 3 4 5 6 7 8 9 10 11 12 13 

check button Enriched KEGG pathways.
Pathway IDTissueDisease StageDescriptionGene RatioBg Ratiopvaluep.adjustqvalueCount
Page: 1 

Top

Cell-cell communication analysis

check buttonIdentification of potential cell-cell interactions between two cell types and their ligand-receptor pairs for different disease states
LigandReceptorLRpairPathwayTissueDisease Stage
Page: 1 

Top

Single-cell gene regulatory network inference analysis

check buttonFind out the significant the regulons (TFs) and the target genes of each regulon across cell types for different disease states
TFCell TypeTissueDisease StageTarget GeneRSSRegulon Activity
∗The dot plots of a searched regulon are shown for all cell subpopulations in each disease state of each tissue based on the regulon specific score inferred using pySCENIC and by calculating the average expression.
Page: 1 

Top

Somatic mutation of malignant transformation related genes

check buttonAnnotation of somatic variants for genes involved in malignant transformation
Hugo SymbolVariant ClassVariant ClassificationdbSNP RSHGVScHGVSpHGVSp ShortSWISSPROTBIOTYPESIFTPolyPhenTumor Sample BarcodeTissueHistologySexAgeStageTherapy TypesDrugsOutcome
NABP2SNVMissense_Mutationc.238N>Tp.Gly80Cysp.G80CQ9BQ15protein_codingdeleterious(0)probably_damaging(0.992)TCGA-D8-A1J8-01Breastbreast invasive carcinomaFemale>=65I/IIHormone TherapynolvadexSD
NABP2deletionFrame_Shift_Delc.238delNp.Gly80ValfsTer3p.G80Vfs*3Q9BQ15protein_codingTCGA-A1-A0SK-01Breastbreast invasive carcinomaFemale<65I/IIUnknownUnknownPD
NABP2SNVMissense_Mutationnovelc.613N>Gp.Thr205Alap.T205AQ9BQ15protein_codingdeleterious_low_confidence(0.01)possibly_damaging(0.899)TCGA-CK-5916-01Colorectumcolon adenocarcinomaFemale>=65I/IIUnknownUnknownPD
NABP2SNVMissense_Mutationc.194N>Ap.Gly65Glup.G65EQ9BQ15protein_codingdeleterious(0)probably_damaging(0.997)TCGA-D5-6928-01Colorectumcolon adenocarcinomaMale>=65I/IIUnknownUnknownSD
NABP2SNVMissense_Mutationrs151118817c.533N>Ap.Arg178Glnp.R178QQ9BQ15protein_codingtolerated(0.38)possibly_damaging(0.885)TCGA-AP-A059-01Endometriumuterine corpus endometrioid carcinomaFemale>=65I/IIUnknownUnknownSD
NABP2SNVMissense_Mutationnovelc.178N>Gp.Asn60Aspp.N60DQ9BQ15protein_codingtolerated(0.29)benign(0.03)TCGA-B5-A3FC-01Endometriumuterine corpus endometrioid carcinomaFemale<65I/IIUnknownUnknownSD
NABP2SNVMissense_Mutationnovelc.4N>Gp.Thr2Alap.T2AQ9BQ15protein_codingtolerated_low_confidence(0.18)benign(0.11)TCGA-DI-A1BU-01Endometriumuterine corpus endometrioid carcinomaFemale<65I/IIChemotherapypaclitaxelSD
NABP2SNVMissense_Mutationc.319N>Gp.Asn107Aspp.N107DQ9BQ15protein_codingdeleterious(0)benign(0.241)TCGA-CC-A7IH-01Liverliver hepatocellular carcinomaMale<65III/IVUnknownUnknownSD
NABP2SNVMissense_Mutationc.320N>Tp.Asn107Ilep.N107IQ9BQ15protein_codingdeleterious(0)probably_damaging(0.957)TCGA-UB-A7MB-01Liverliver hepatocellular carcinomaMale<65I/IITargeted Molecular therapysorafenibPD
NABP2SNVMissense_Mutationnovelc.37N>Tp.Gly13Trpp.G13WQ9BQ15protein_codingdeleterious(0)probably_damaging(0.971)TCGA-05-4396-01Lunglung adenocarcinomaMale>=65III/IVUnknownUnknownSD
Page: 1 2 3 

Top

Related drugs of malignant transformation related genes

check buttonIdentification of chemicals and drugs interact with genes involved in malignant transfromation
(DGIdb 4.0)
Entrez IDSymbolCategoryInteraction TypesDrug Claim NameDrug NamePMIDs
Page: 1