
|
|||||
|
 | |
| |
| |
| |
| |
| |
|
Gene: NAB1 |
Gene summary for NAB1 |
| Gene information | Species | Human | Gene symbol | NAB1 | Gene ID | 4664 |
| Gene name | NGFI-A binding protein 1 | |
| Gene Alias | NAB1 | |
| Cytomap | 2q32.2 | |
| Gene Type | protein-coding | GO ID | GO:0001501 | UniProtAcc | A8K8T1 |
Top |
Malignant transformation analysis |
| Identification of the aberrant gene expression in precancerous and cancerous lesions by comparing the gene expression of stem-like cells in diseased tissues with normal stem cells |
| Entrez ID | Symbol | Replicates | Species | Organ | Tissue | Adj P-value | Log2FC | Malignancy |
| 4664 | NAB1 | LZE4T | Human | Esophagus | ESCC | 5.48e-06 | -1.02e-01 | 0.0811 |
| 4664 | NAB1 | LZE5T | Human | Esophagus | ESCC | 7.74e-04 | -5.19e-02 | 0.0514 |
| 4664 | NAB1 | LZE8T | Human | Esophagus | ESCC | 1.28e-07 | 6.28e-02 | 0.067 |
| 4664 | NAB1 | LZE20T | Human | Esophagus | ESCC | 9.49e-03 | -9.88e-02 | 0.0662 |
| 4664 | NAB1 | LZE22T | Human | Esophagus | ESCC | 5.20e-04 | -5.19e-02 | 0.068 |
| 4664 | NAB1 | LZE24T | Human | Esophagus | ESCC | 5.51e-11 | 3.02e-02 | 0.0596 |
| 4664 | NAB1 | LZE21T | Human | Esophagus | ESCC | 3.36e-02 | -1.42e-01 | 0.0655 |
| 4664 | NAB1 | LZE6T | Human | Esophagus | ESCC | 1.75e-04 | -1.35e-01 | 0.0845 |
| 4664 | NAB1 | P1T-E | Human | Esophagus | ESCC | 7.11e-05 | -5.19e-02 | 0.0875 |
| 4664 | NAB1 | P2T-E | Human | Esophagus | ESCC | 5.69e-15 | 1.06e-01 | 0.1177 |
| 4664 | NAB1 | P4T-E | Human | Esophagus | ESCC | 9.92e-12 | 1.35e-01 | 0.1323 |
| 4664 | NAB1 | P5T-E | Human | Esophagus | ESCC | 1.47e-06 | 3.69e-02 | 0.1327 |
| 4664 | NAB1 | P8T-E | Human | Esophagus | ESCC | 2.48e-06 | 7.00e-03 | 0.0889 |
| 4664 | NAB1 | P9T-E | Human | Esophagus | ESCC | 7.20e-14 | 3.65e-03 | 0.1131 |
| 4664 | NAB1 | P10T-E | Human | Esophagus | ESCC | 6.26e-18 | 2.73e-01 | 0.116 |
| 4664 | NAB1 | P12T-E | Human | Esophagus | ESCC | 1.16e-19 | 3.50e-01 | 0.1122 |
| 4664 | NAB1 | P15T-E | Human | Esophagus | ESCC | 4.07e-18 | 4.12e-01 | 0.1149 |
| 4664 | NAB1 | P16T-E | Human | Esophagus | ESCC | 5.84e-09 | -4.96e-03 | 0.1153 |
| 4664 | NAB1 | P17T-E | Human | Esophagus | ESCC | 4.65e-07 | -3.61e-02 | 0.1278 |
| 4664 | NAB1 | P20T-E | Human | Esophagus | ESCC | 2.08e-16 | 2.29e-01 | 0.1124 |
| Page: 1 2 3 4 5 |
| Tissue | Expression Dynamics | Abbreviation |
| Esophagus | 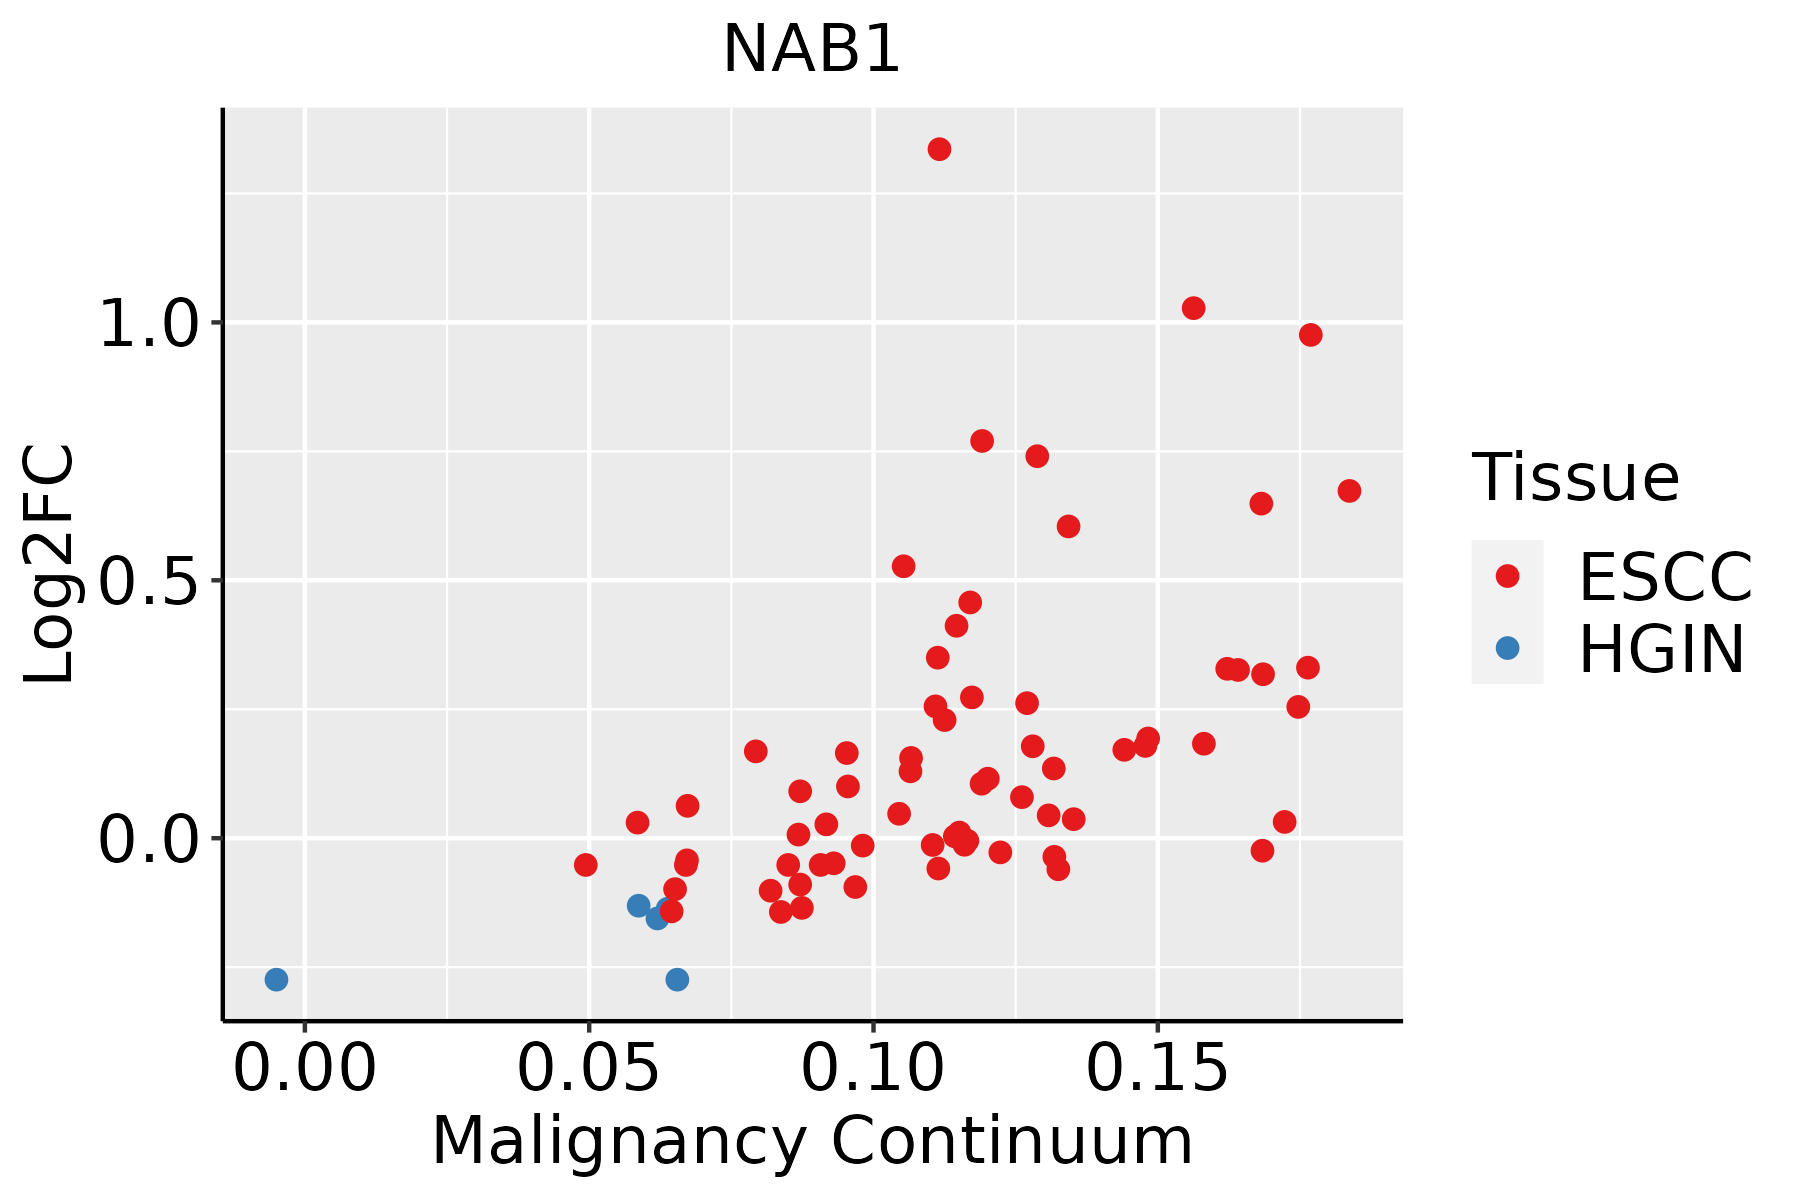 | ESCC: Esophageal squamous cell carcinoma |
| HGIN: High-grade intraepithelial neoplasias | ||
| LGIN: Low-grade intraepithelial neoplasias | ||
| Oral Cavity | 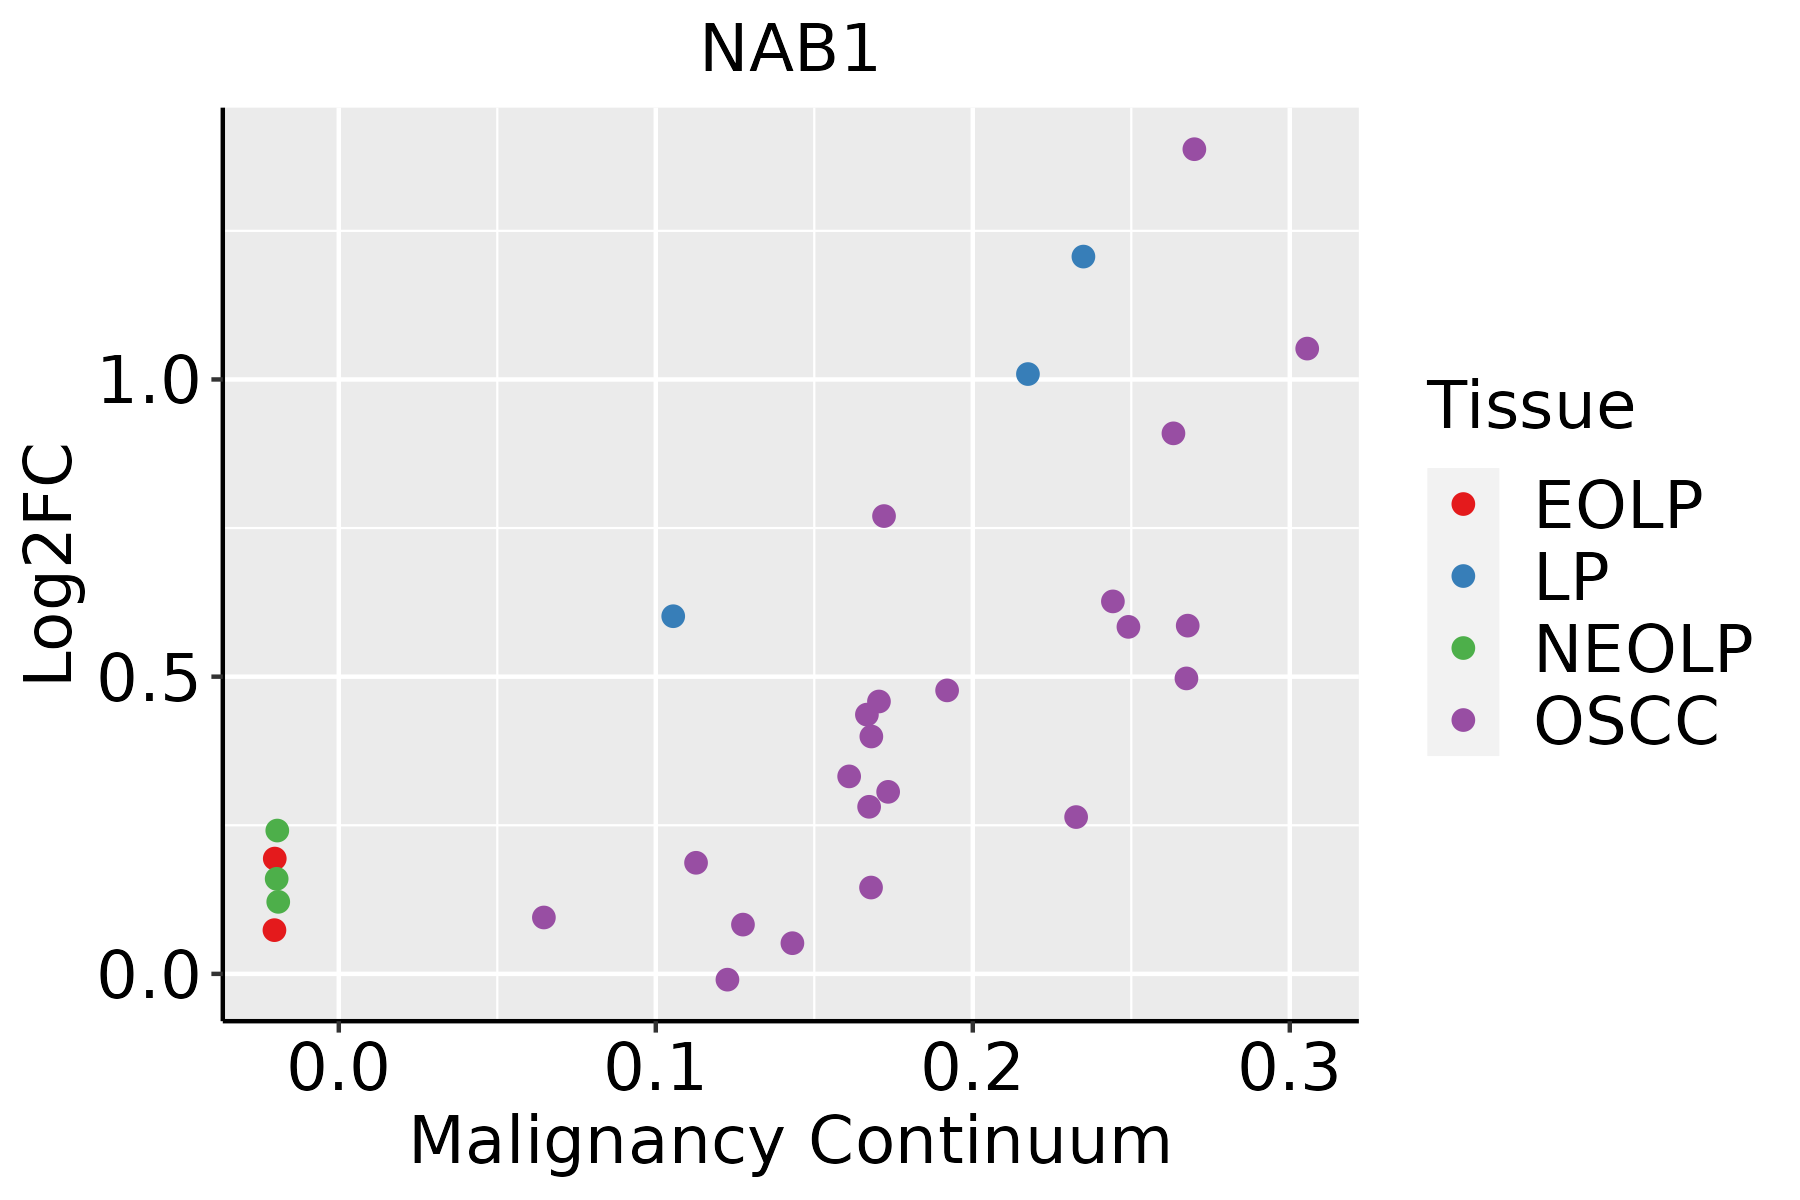 | EOLP: Erosive Oral lichen planus |
| LP: leukoplakia | ||
| NEOLP: Non-erosive oral lichen planus | ||
| OSCC: Oral squamous cell carcinoma | ||
| Skin | 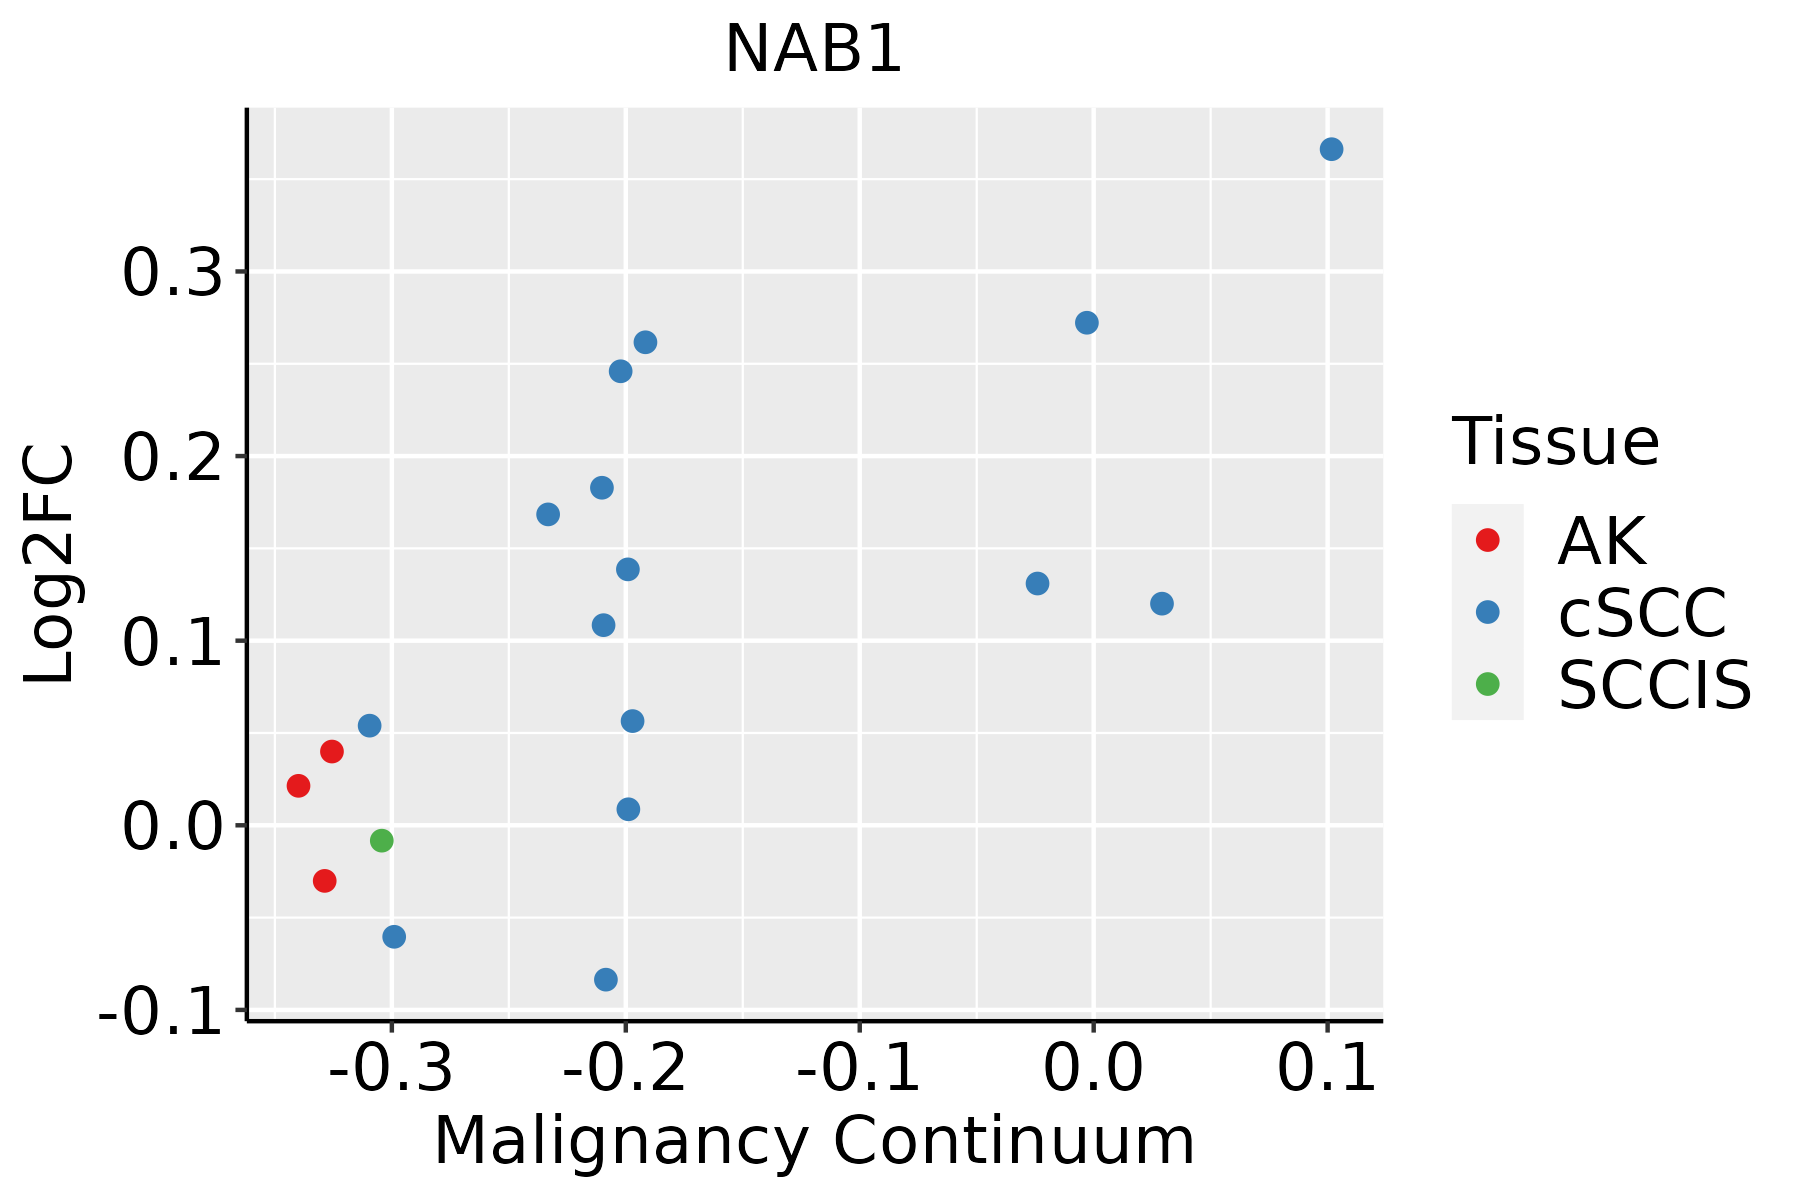 | AK: Actinic keratosis |
| cSCC: Cutaneous squamous cell carcinoma | ||
| SCCIS:squamous cell carcinoma in situ |
| ∗log2FC in expression of this searched gene in stem-like cells from each diseased tissue sample relative to stem-like cells in normal samples in each tissue plotted against the malignancy continuum. Samples are colored based on if they are from different disease stage. |
Top |
Malignant transformation related pathway analysis |
| Find out the enriched GO biological processes and KEGG pathways involved in transition from healthy to precancer to cancer |
| Tissue | Disease Stage | Enriched GO biological Processes |
| Colorectum | AD |  |
| Colorectum | SER |  |
| Colorectum | MSS |  |
| Colorectum | MSI-H |  |
| Colorectum | FAP |  |
| ∗Top 15 enriched GO BP terms are showed in the bar plot of each disease state in each tissue. Each row represents a significant GO biological process which is colored according to the -log10(p.adjust). |
| Page: 1 2 3 4 5 6 7 8 9 |
| GO ID | Tissue | Disease Stage | Description | Gene Ratio | Bg Ratio | pvalue | p.adjust | Count |
| GO:000854410 | Esophagus | ESCC | epidermis development | 193/8552 | 324/18723 | 2.87e-07 | 4.19e-06 | 193 |
| GO:000150317 | Esophagus | ESCC | ossification | 232/8552 | 408/18723 | 3.00e-06 | 3.40e-05 | 232 |
| GO:00425524 | Esophagus | ESCC | myelination | 85/8552 | 134/18723 | 2.51e-05 | 2.13e-04 | 85 |
| GO:00072724 | Esophagus | ESCC | ensheathment of neurons | 86/8552 | 136/18723 | 2.68e-05 | 2.24e-04 | 86 |
| GO:00083664 | Esophagus | ESCC | axon ensheathment | 86/8552 | 136/18723 | 2.68e-05 | 2.24e-04 | 86 |
| GO:00456826 | Esophagus | ESCC | regulation of epidermis development | 46/8552 | 65/18723 | 3.65e-05 | 2.97e-04 | 46 |
| GO:00420636 | Esophagus | ESCC | gliogenesis | 172/8552 | 301/18723 | 3.75e-05 | 3.04e-04 | 172 |
| GO:00100016 | Esophagus | ESCC | glial cell differentiation | 129/8552 | 225/18723 | 2.73e-04 | 1.65e-03 | 129 |
| GO:00140373 | Esophagus | ESCC | Schwann cell differentiation | 28/8552 | 40/18723 | 1.61e-03 | 7.50e-03 | 28 |
| GO:00603485 | Esophagus | ESCC | bone development | 115/8552 | 205/18723 | 1.67e-03 | 7.72e-03 | 115 |
| GO:00487052 | Esophagus | ESCC | skeletal system morphogenesis | 120/8552 | 220/18723 | 4.90e-03 | 1.89e-02 | 120 |
| GO:00085449 | Oral cavity | OSCC | epidermis development | 171/7305 | 324/18723 | 2.89e-07 | 4.43e-06 | 171 |
| GO:000150310 | Oral cavity | OSCC | ossification | 203/7305 | 408/18723 | 5.54e-06 | 6.19e-05 | 203 |
| GO:00420635 | Oral cavity | OSCC | gliogenesis | 154/7305 | 301/18723 | 1.10e-05 | 1.14e-04 | 154 |
| GO:00456825 | Oral cavity | OSCC | regulation of epidermis development | 41/7305 | 65/18723 | 7.29e-05 | 5.73e-04 | 41 |
| GO:00072723 | Oral cavity | OSCC | ensheathment of neurons | 72/7305 | 136/18723 | 6.59e-04 | 3.70e-03 | 72 |
| GO:00083663 | Oral cavity | OSCC | axon ensheathment | 72/7305 | 136/18723 | 6.59e-04 | 3.70e-03 | 72 |
| GO:00425523 | Oral cavity | OSCC | myelination | 71/7305 | 134/18723 | 6.93e-04 | 3.86e-03 | 71 |
| GO:00100015 | Oral cavity | OSCC | glial cell differentiation | 110/7305 | 225/18723 | 1.56e-03 | 7.45e-03 | 110 |
| GO:00140372 | Oral cavity | OSCC | Schwann cell differentiation | 25/7305 | 40/18723 | 2.22e-03 | 1.00e-02 | 25 |
| Page: 1 2 3 |
| Pathway ID | Tissue | Disease Stage | Description | Gene Ratio | Bg Ratio | pvalue | p.adjust | qvalue | Count |
| Page: 1 |
Top |
Cell-cell communication analysis |
| Identification of potential cell-cell interactions between two cell types and their ligand-receptor pairs for different disease states |
| Ligand | Receptor | LRpair | Pathway | Tissue | Disease Stage |
| Page: 1 |
Top |
Single-cell gene regulatory network inference analysis |
| Find out the significant the regulons (TFs) and the target genes of each regulon across cell types for different disease states |
| TF | Cell Type | Tissue | Disease Stage | Target Gene | RSS | Regulon Activity |
| ∗The dot plots of a searched regulon are shown for all cell subpopulations in each disease state of each tissue based on the regulon specific score inferred using pySCENIC and by calculating the average expression. |
| Page: 1 |
Top |
Somatic mutation of malignant transformation related genes |
| Annotation of somatic variants for genes involved in malignant transformation |
| Hugo Symbol | Variant Class | Variant Classification | dbSNP RS | HGVSc | HGVSp | HGVSp Short | SWISSPROT | BIOTYPE | SIFT | PolyPhen | Tumor Sample Barcode | Tissue | Histology | Sex | Age | Stage | Therapy Types | Drugs | Outcome |
| NAB1 | SNV | Missense_Mutation | novel | c.329N>T | p.Ser110Phe | p.S110F | Q13506 | protein_coding | tolerated(0.09) | benign(0.062) | TCGA-GM-A2DB-01 | Breast | breast invasive carcinoma | Female | <65 | I/II | Chemotherapy | taxol | CR |
| NAB1 | insertion | Nonsense_Mutation | novel | c.1176_1177insGTTTATCATGTTTATTCTGTGAATTAATATATTTTACCT | p.Arg392_Arg393insValTyrHisValTyrSerValAsnTerTyrIleLeuPro | p.R392_R393insVYHVYSVN*YILP | Q13506 | protein_coding | TCGA-AR-A0TY-01 | Breast | breast invasive carcinoma | Female | <65 | I/II | Unspecific | Paclitaxel | PD | ||
| NAB1 | deletion | Frame_Shift_Del | novel | c.358delG | p.Ala120ProfsTer6 | p.A120Pfs*6 | Q13506 | protein_coding | TCGA-D8-A27V-01 | Breast | breast invasive carcinoma | Female | <65 | I/II | Hormone Therapy | tamoxiphen | SD | ||
| NAB1 | SNV | Missense_Mutation | novel | c.866C>T | p.Ala289Val | p.A289V | Q13506 | protein_coding | deleterious(0.05) | probably_damaging(0.971) | TCGA-2W-A8YY-01 | Cervix | cervical & endocervical cancer | Female | <65 | I/II | Chemotherapy | cisplatin | CR |
| NAB1 | SNV | Missense_Mutation | novel | c.1171N>A | p.Glu391Lys | p.E391K | Q13506 | protein_coding | tolerated_low_confidence(0.08) | benign(0.018) | TCGA-C5-A8XJ-01 | Cervix | cervical & endocervical cancer | Female | >=65 | I/II | Chemotherapy | cisplatin | SD |
| NAB1 | SNV | Missense_Mutation | rs754464590 | c.917N>A | p.Arg306Gln | p.R306Q | Q13506 | protein_coding | deleterious(0.04) | benign(0.017) | TCGA-MY-A5BE-01 | Cervix | cervical & endocervical cancer | Female | <65 | I/II | Unknown | Unknown | SD |
| NAB1 | SNV | Missense_Mutation | rs779731764 | c.74C>A | p.Ser25Tyr | p.S25Y | Q13506 | protein_coding | tolerated(1) | benign(0.232) | TCGA-AA-3510-01 | Colorectum | colon adenocarcinoma | Male | >=65 | I/II | Unknown | Unknown | SD |
| NAB1 | SNV | Missense_Mutation | c.1178N>T | p.Arg393Met | p.R393M | Q13506 | protein_coding | deleterious_low_confidence(0.01) | possibly_damaging(0.832) | TCGA-AA-3672-01 | Colorectum | colon adenocarcinoma | Female | >=65 | III/IV | Unknown | Unknown | SD | |
| NAB1 | SNV | Missense_Mutation | novel | c.1351A>T | p.Ser451Cys | p.S451C | Q13506 | protein_coding | deleterious_low_confidence(0.01) | possibly_damaging(0.701) | TCGA-AA-3845-01 | Colorectum | colon adenocarcinoma | Female | >=65 | I/II | Unknown | Unknown | PD |
| NAB1 | SNV | Missense_Mutation | c.1003G>A | p.Glu335Lys | p.E335K | Q13506 | protein_coding | deleterious(0.04) | probably_damaging(0.948) | TCGA-AA-3848-01 | Colorectum | colon adenocarcinoma | Female | >=65 | III/IV | Unknown | Unknown | PD |
| Page: 1 2 3 4 5 |
Top |
Related drugs of malignant transformation related genes |
| Identification of chemicals and drugs interact with genes involved in malignant transfromation |
| (DGIdb 4.0) |
| Entrez ID | Symbol | Category | Interaction Types | Drug Claim Name | Drug Name | PMIDs |
| Page: 1 |

Copyright 2023-Present -The University of Texas Health Science Center at Houston |