
|
|||||
|
 | |
| |
| |
| |
| |
| |
|
Gene: NAALADL2 |
Gene summary for NAALADL2 |
| Gene information | Species | Human | Gene symbol | NAALADL2 | Gene ID | 254827 |
| Gene name | N-acetylated alpha-linked acidic dipeptidase like 2 | |
| Gene Alias | NAALADL2 | |
| Cytomap | 3q26.31 | |
| Gene Type | protein-coding | GO ID | GO:0006508 | UniProtAcc | Q58DX5 |
Top |
Malignant transformation analysis |
| Identification of the aberrant gene expression in precancerous and cancerous lesions by comparing the gene expression of stem-like cells in diseased tissues with normal stem cells |
| Entrez ID | Symbol | Replicates | Species | Organ | Tissue | Adj P-value | Log2FC | Malignancy |
| 254827 | NAALADL2 | CCI_1 | Human | Cervix | CC | 9.80e-15 | 1.74e+00 | 0.528 |
| 254827 | NAALADL2 | CCI_2 | Human | Cervix | CC | 4.12e-15 | 1.83e+00 | 0.5249 |
| 254827 | NAALADL2 | CCI_3 | Human | Cervix | CC | 5.62e-30 | 1.69e+00 | 0.516 |
| 254827 | NAALADL2 | CCII_1 | Human | Cervix | CC | 1.97e-05 | 2.56e-01 | 0.3249 |
| 254827 | NAALADL2 | T1 | Human | Cervix | CC | 2.13e-05 | 2.29e-01 | 0.0918 |
| 254827 | NAALADL2 | HTA11_3410_2000001011 | Human | Colorectum | AD | 1.58e-24 | -5.93e-01 | 0.0155 |
| 254827 | NAALADL2 | HTA11_2487_2000001011 | Human | Colorectum | SER | 3.18e-04 | -2.92e-01 | -0.1808 |
| 254827 | NAALADL2 | HTA11_2951_2000001011 | Human | Colorectum | AD | 1.00e-10 | -6.31e-01 | 0.0216 |
| 254827 | NAALADL2 | HTA11_78_2000001011 | Human | Colorectum | AD | 2.04e-05 | 5.15e-01 | -0.1088 |
| 254827 | NAALADL2 | HTA11_347_2000001011 | Human | Colorectum | AD | 4.73e-23 | 9.15e-01 | -0.1954 |
| 254827 | NAALADL2 | HTA11_2112_2000001011 | Human | Colorectum | SER | 3.89e-03 | -5.97e-01 | -0.2196 |
| 254827 | NAALADL2 | HTA11_3361_2000001011 | Human | Colorectum | AD | 2.91e-17 | -7.46e-01 | -0.1207 |
| 254827 | NAALADL2 | HTA11_5212_2000001011 | Human | Colorectum | AD | 2.50e-05 | -6.50e-01 | -0.2061 |
| 254827 | NAALADL2 | HTA11_5216_2000001011 | Human | Colorectum | SER | 3.17e-07 | -4.86e-01 | -0.1462 |
| 254827 | NAALADL2 | HTA11_8622_2000001021 | Human | Colorectum | SER | 8.18e-05 | -5.11e-01 | 0.0528 |
| 254827 | NAALADL2 | HTA11_7663_2000001011 | Human | Colorectum | SER | 1.01e-02 | 3.41e-01 | 0.0131 |
| 254827 | NAALADL2 | HTA11_99999965104_69814 | Human | Colorectum | MSS | 2.67e-08 | 7.47e-01 | 0.281 |
| 254827 | NAALADL2 | HTA11_99999973899_84307 | Human | Colorectum | MSS | 1.45e-38 | -1.33e+00 | 0.2585 |
| 254827 | NAALADL2 | HTA11_99999974143_84620 | Human | Colorectum | MSS | 6.75e-14 | -5.43e-01 | 0.3005 |
| 254827 | NAALADL2 | A015-C-203 | Human | Colorectum | FAP | 6.08e-18 | -3.97e-01 | -0.1294 |
| Page: 1 2 3 4 5 6 7 8 |
| Tissue | Expression Dynamics | Abbreviation |
| Cervix |  | CC: Cervix cancer |
| HSIL_HPV: HPV-infected high-grade squamous intraepithelial lesions | ||
| N_HPV: HPV-infected normal cervix | ||
| Colorectum (GSE201348) |  | FAP: Familial adenomatous polyposis |
| CRC: Colorectal cancer | ||
| Colorectum (HTA11) | 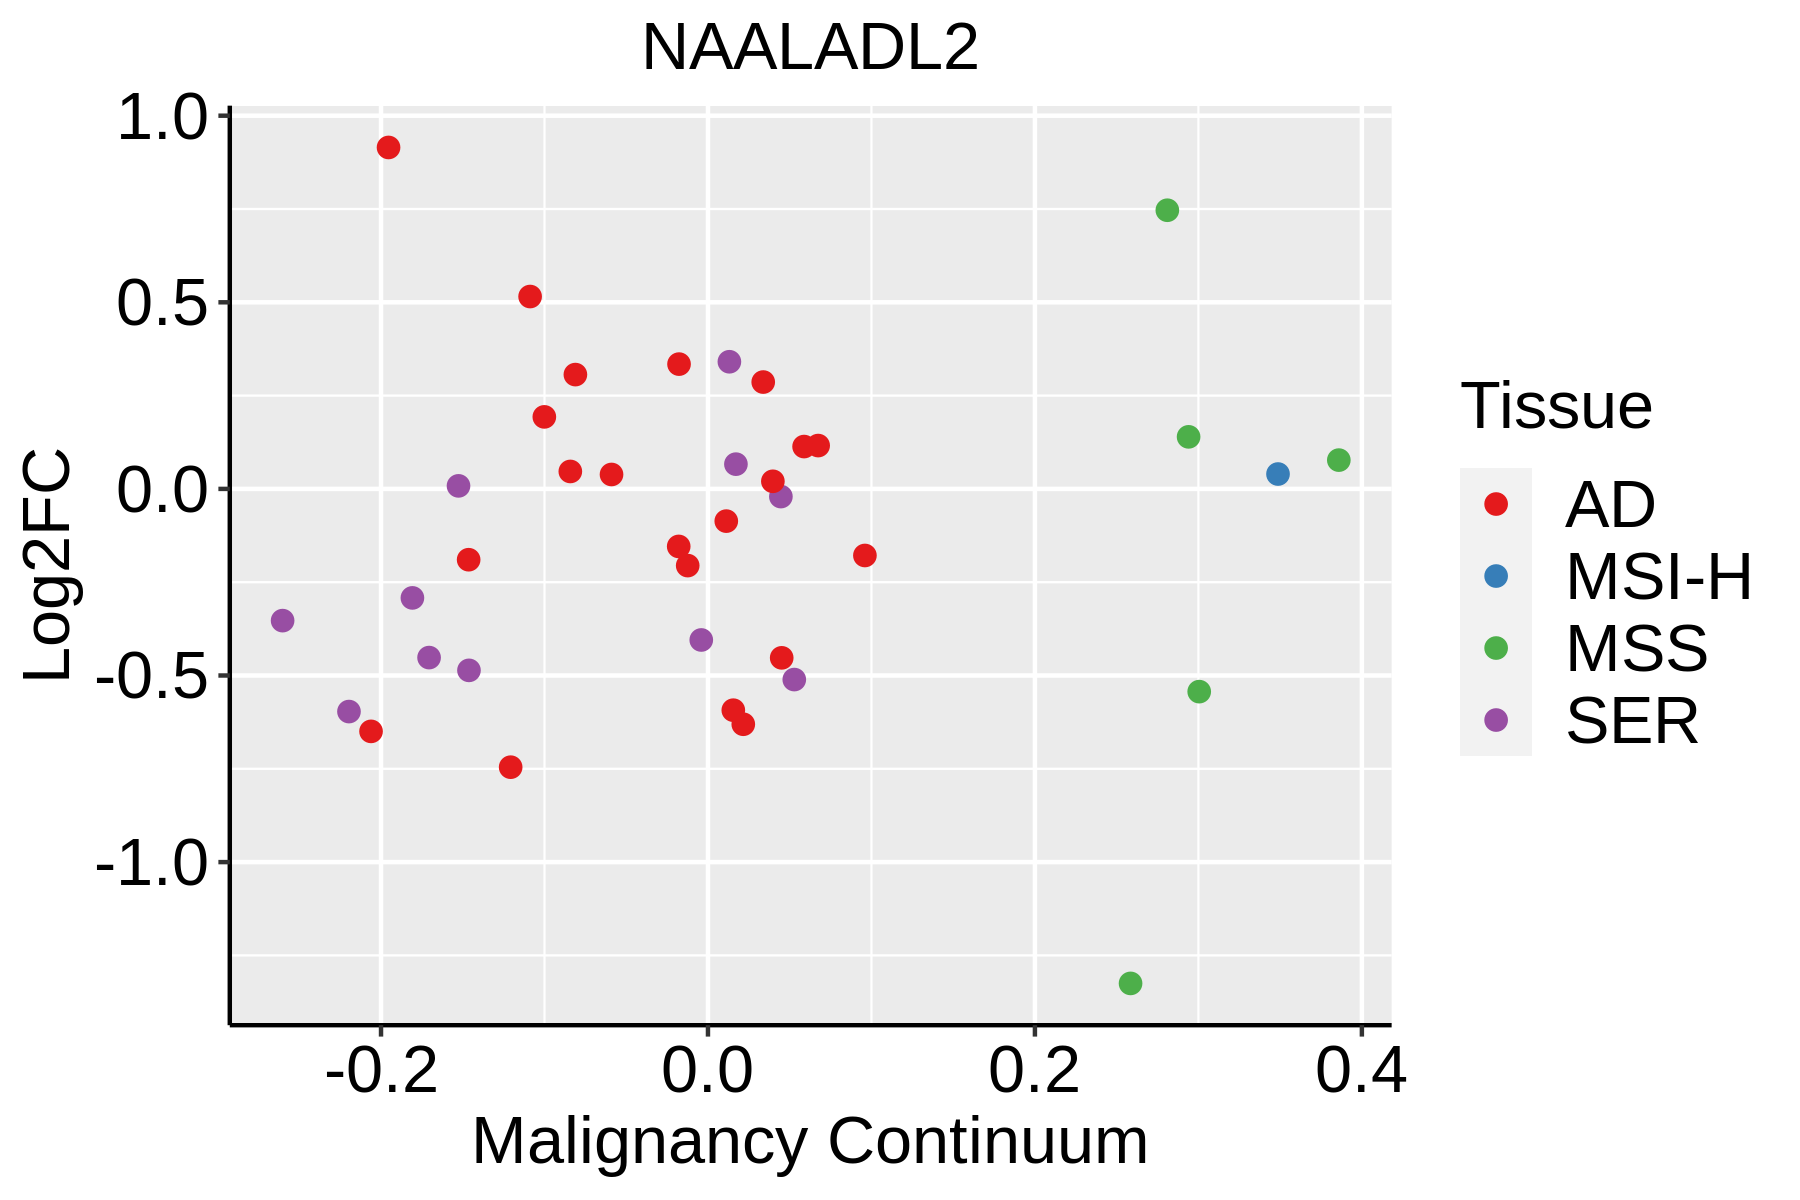 | AD: Adenomas |
| SER: Sessile serrated lesions | ||
| MSI-H: Microsatellite-high colorectal cancer | ||
| MSS: Microsatellite stable colorectal cancer | ||
| Endometrium | 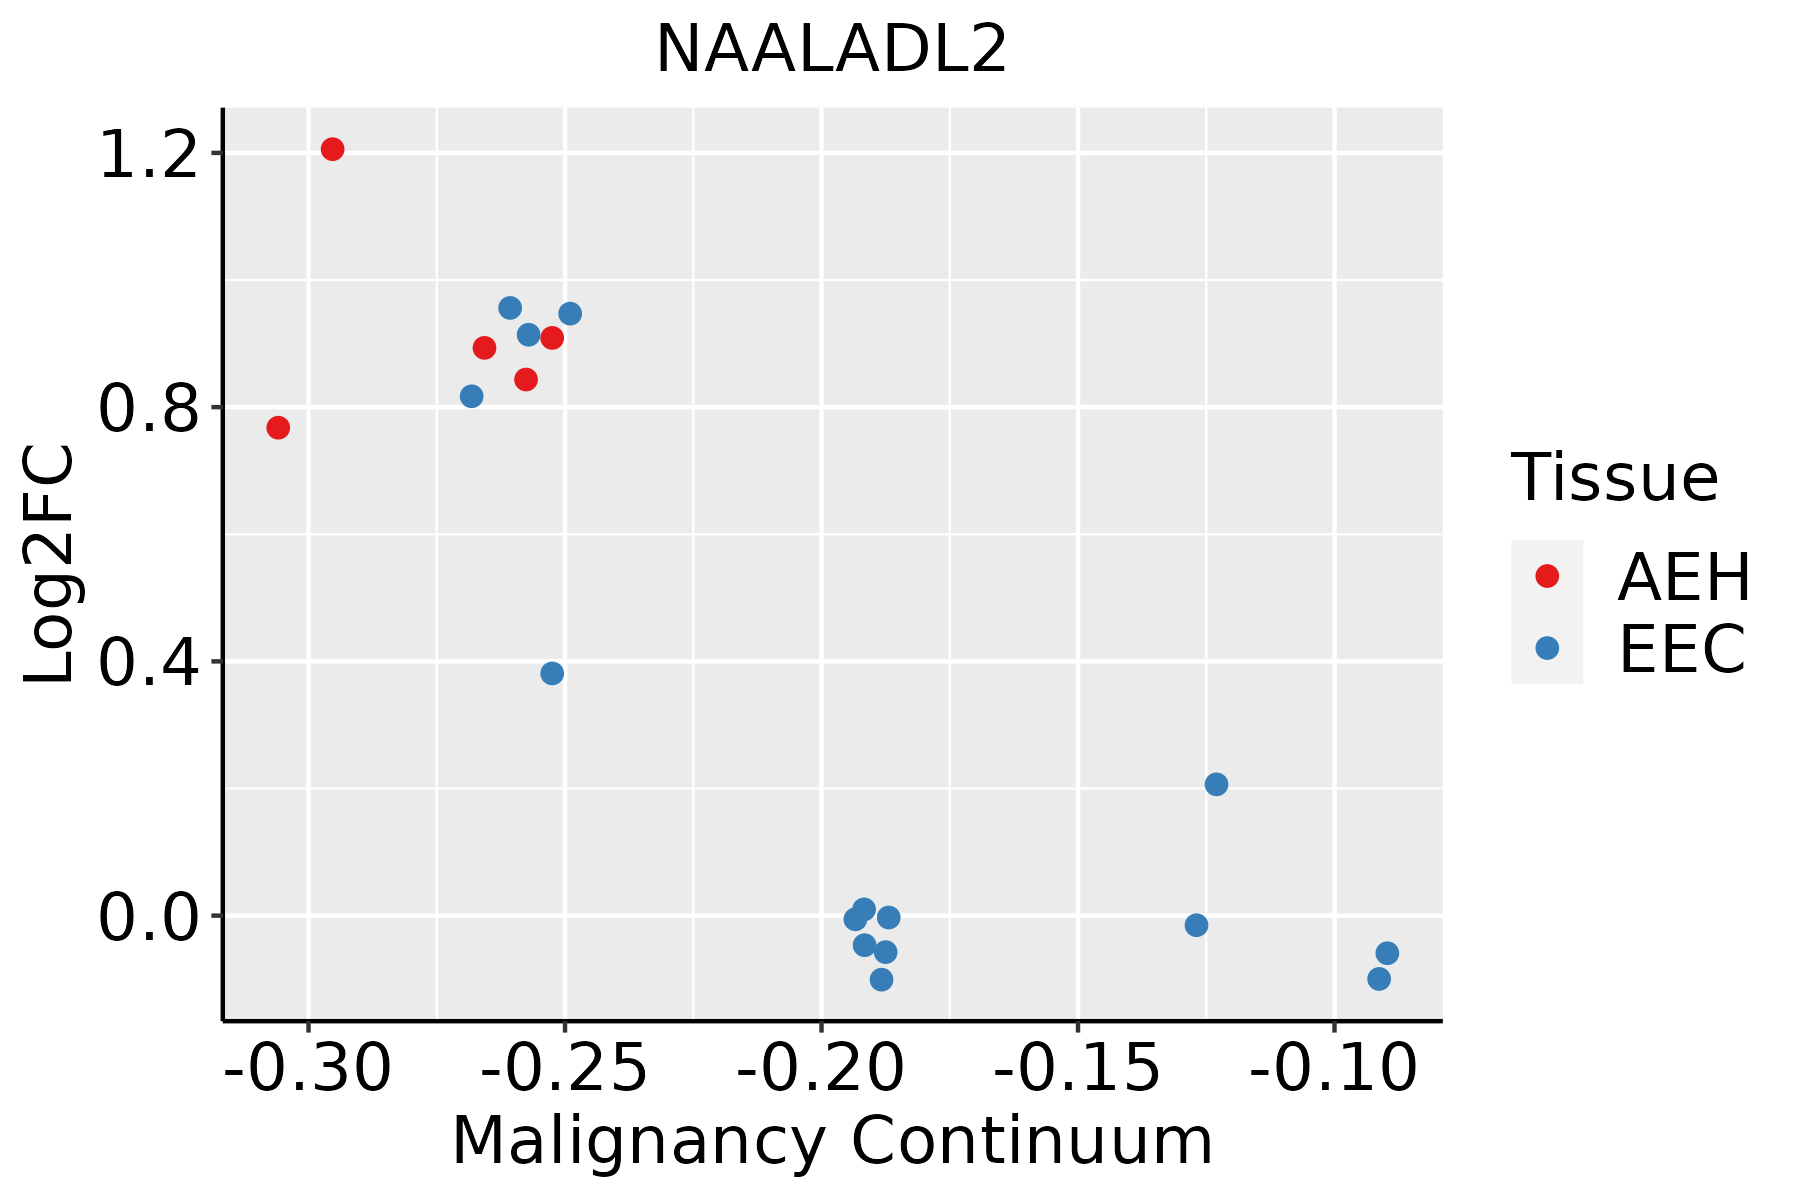 | AEH: Atypical endometrial hyperplasia |
| EEC: Endometrioid Cancer | ||
| Esophagus | 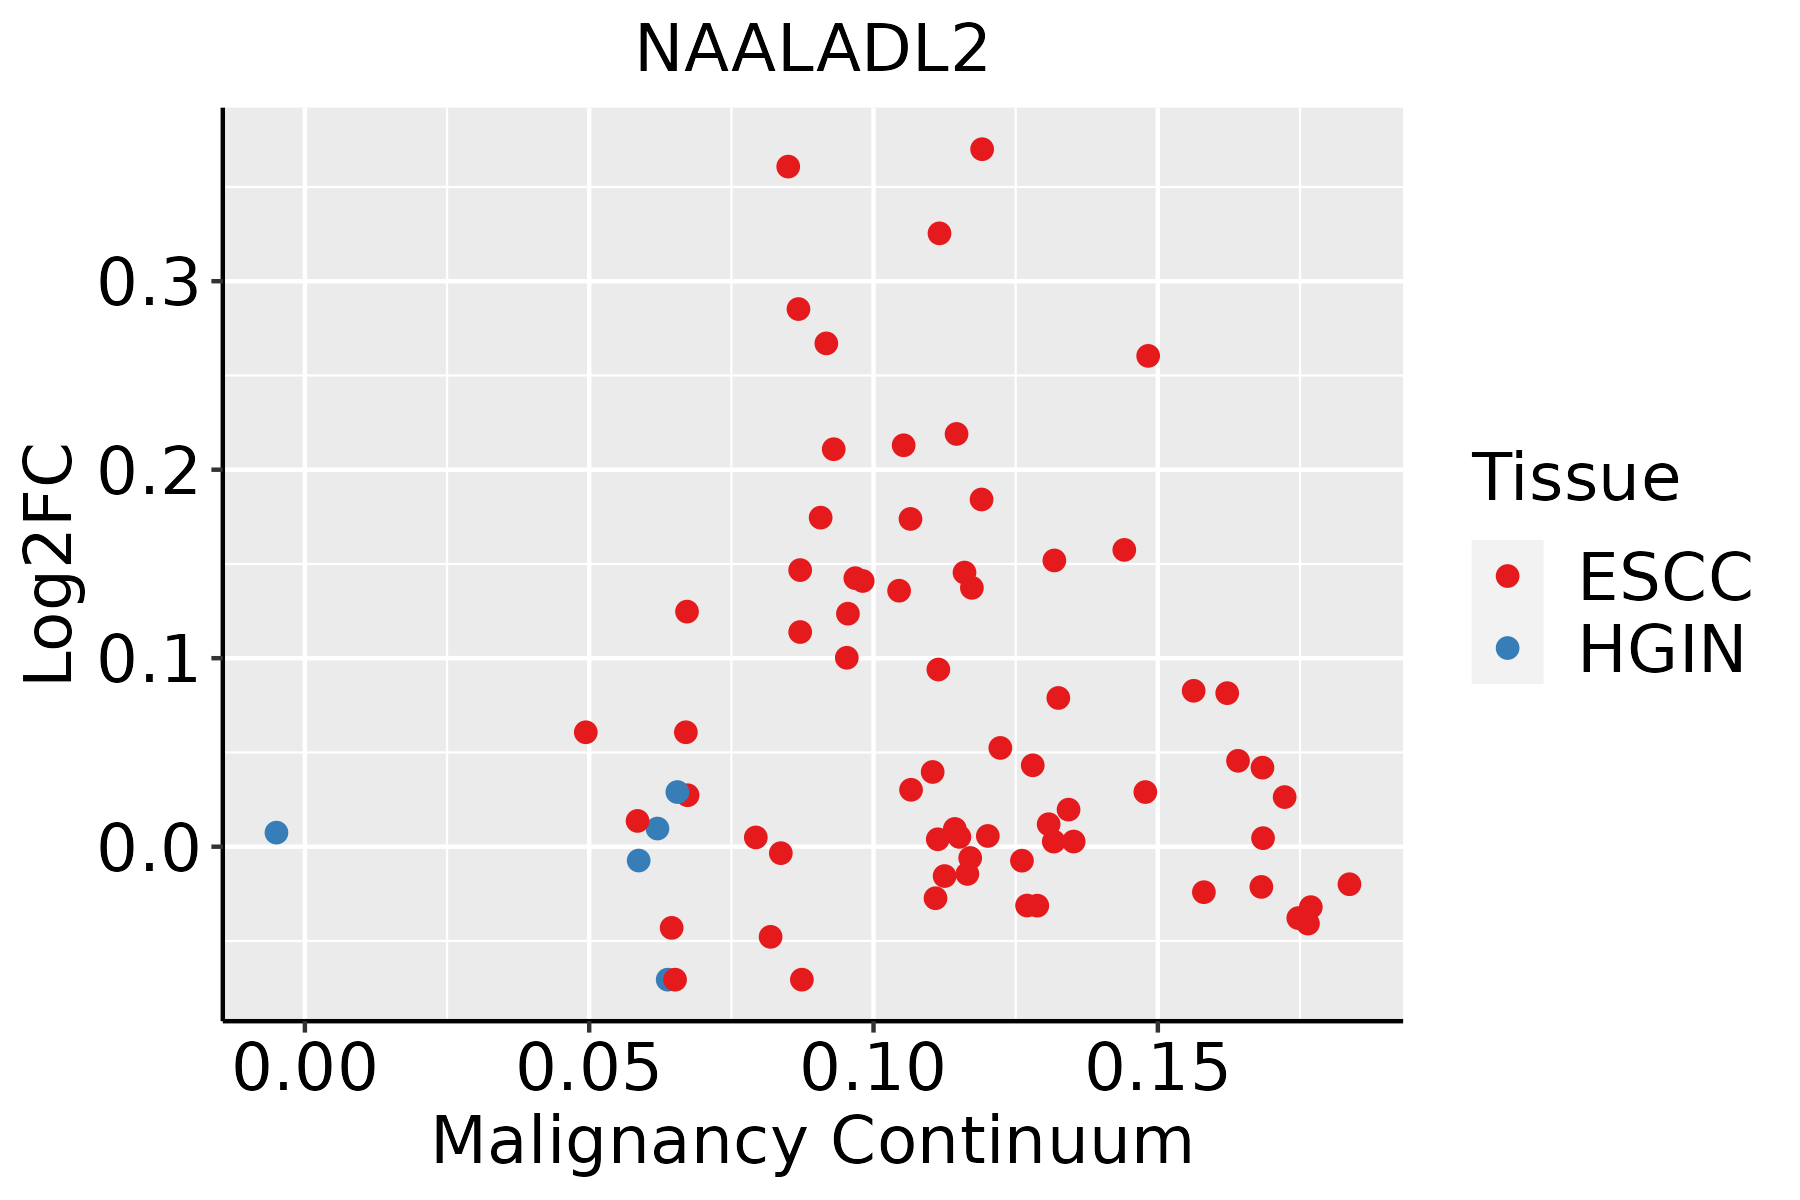 | ESCC: Esophageal squamous cell carcinoma |
| HGIN: High-grade intraepithelial neoplasias | ||
| LGIN: Low-grade intraepithelial neoplasias | ||
| GC | 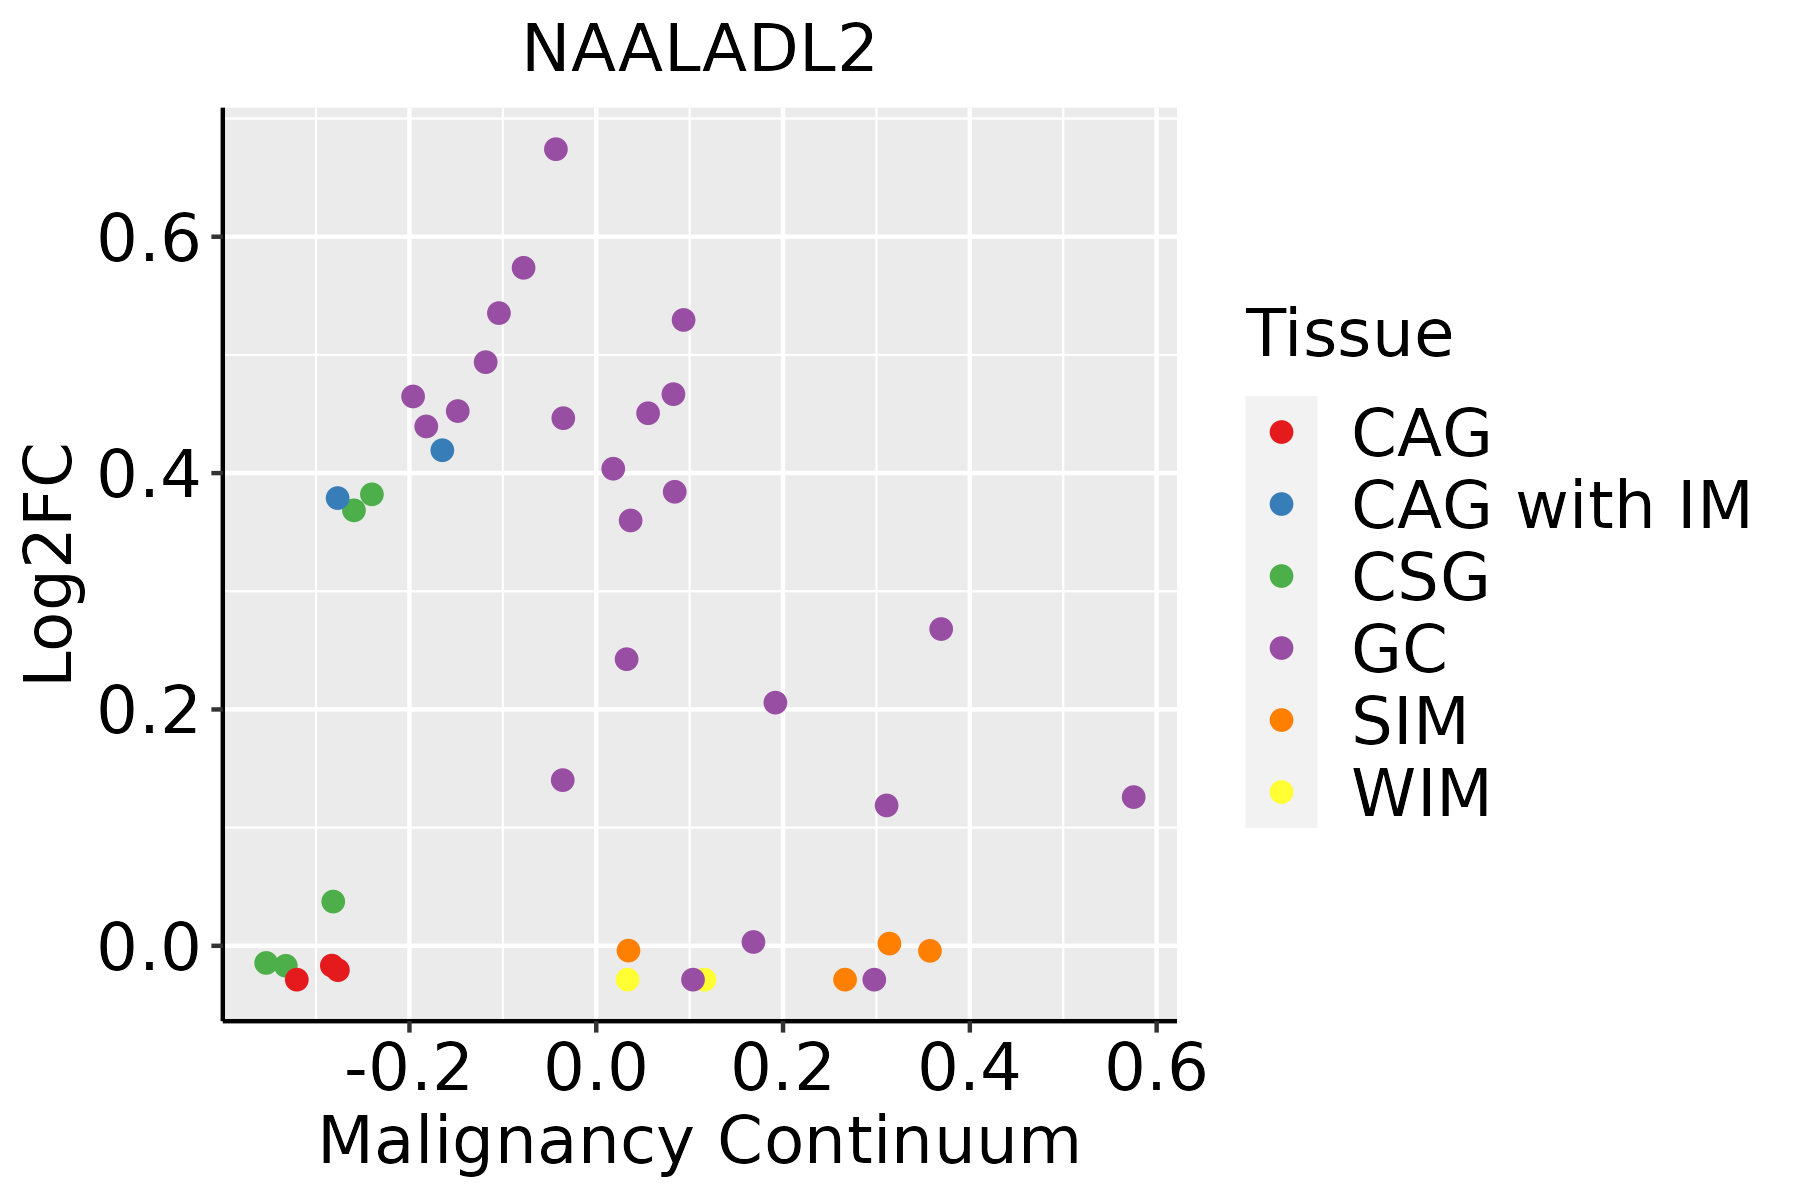 | CAG: Chronic atrophic gastritis |
| CAG with IM: Chronic atrophic gastritis with intestinal metaplasia | ||
| CSG: Chronic superficial gastritis | ||
| GC: Gastric cancer | ||
| SIM: Severe intestinal metaplasia | ||
| WIM: Wild intestinal metaplasia | ||
| Lung | 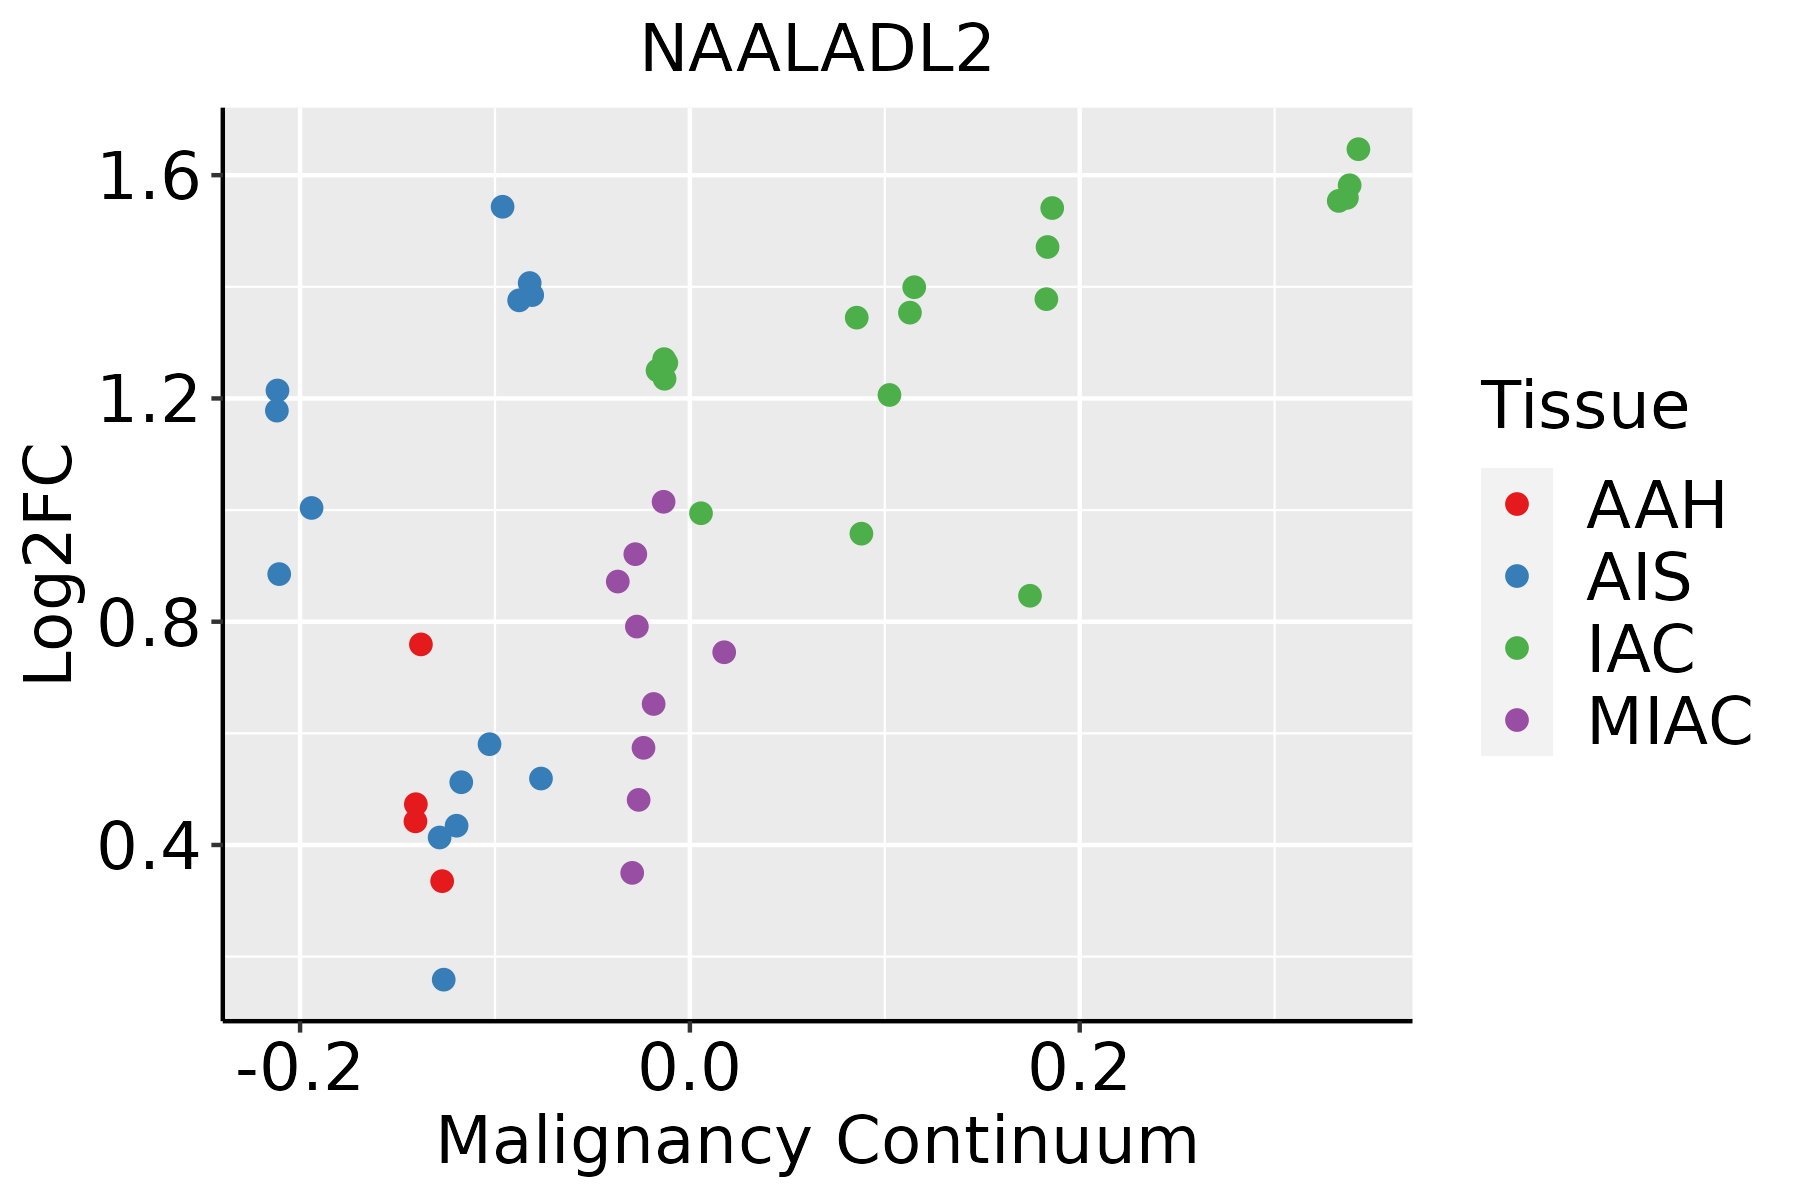 | AAH: Atypical adenomatous hyperplasia |
| AIS: Adenocarcinoma in situ | ||
| IAC: Invasive lung adenocarcinoma | ||
| MIA: Minimally invasive adenocarcinoma | ||
| Prostate | 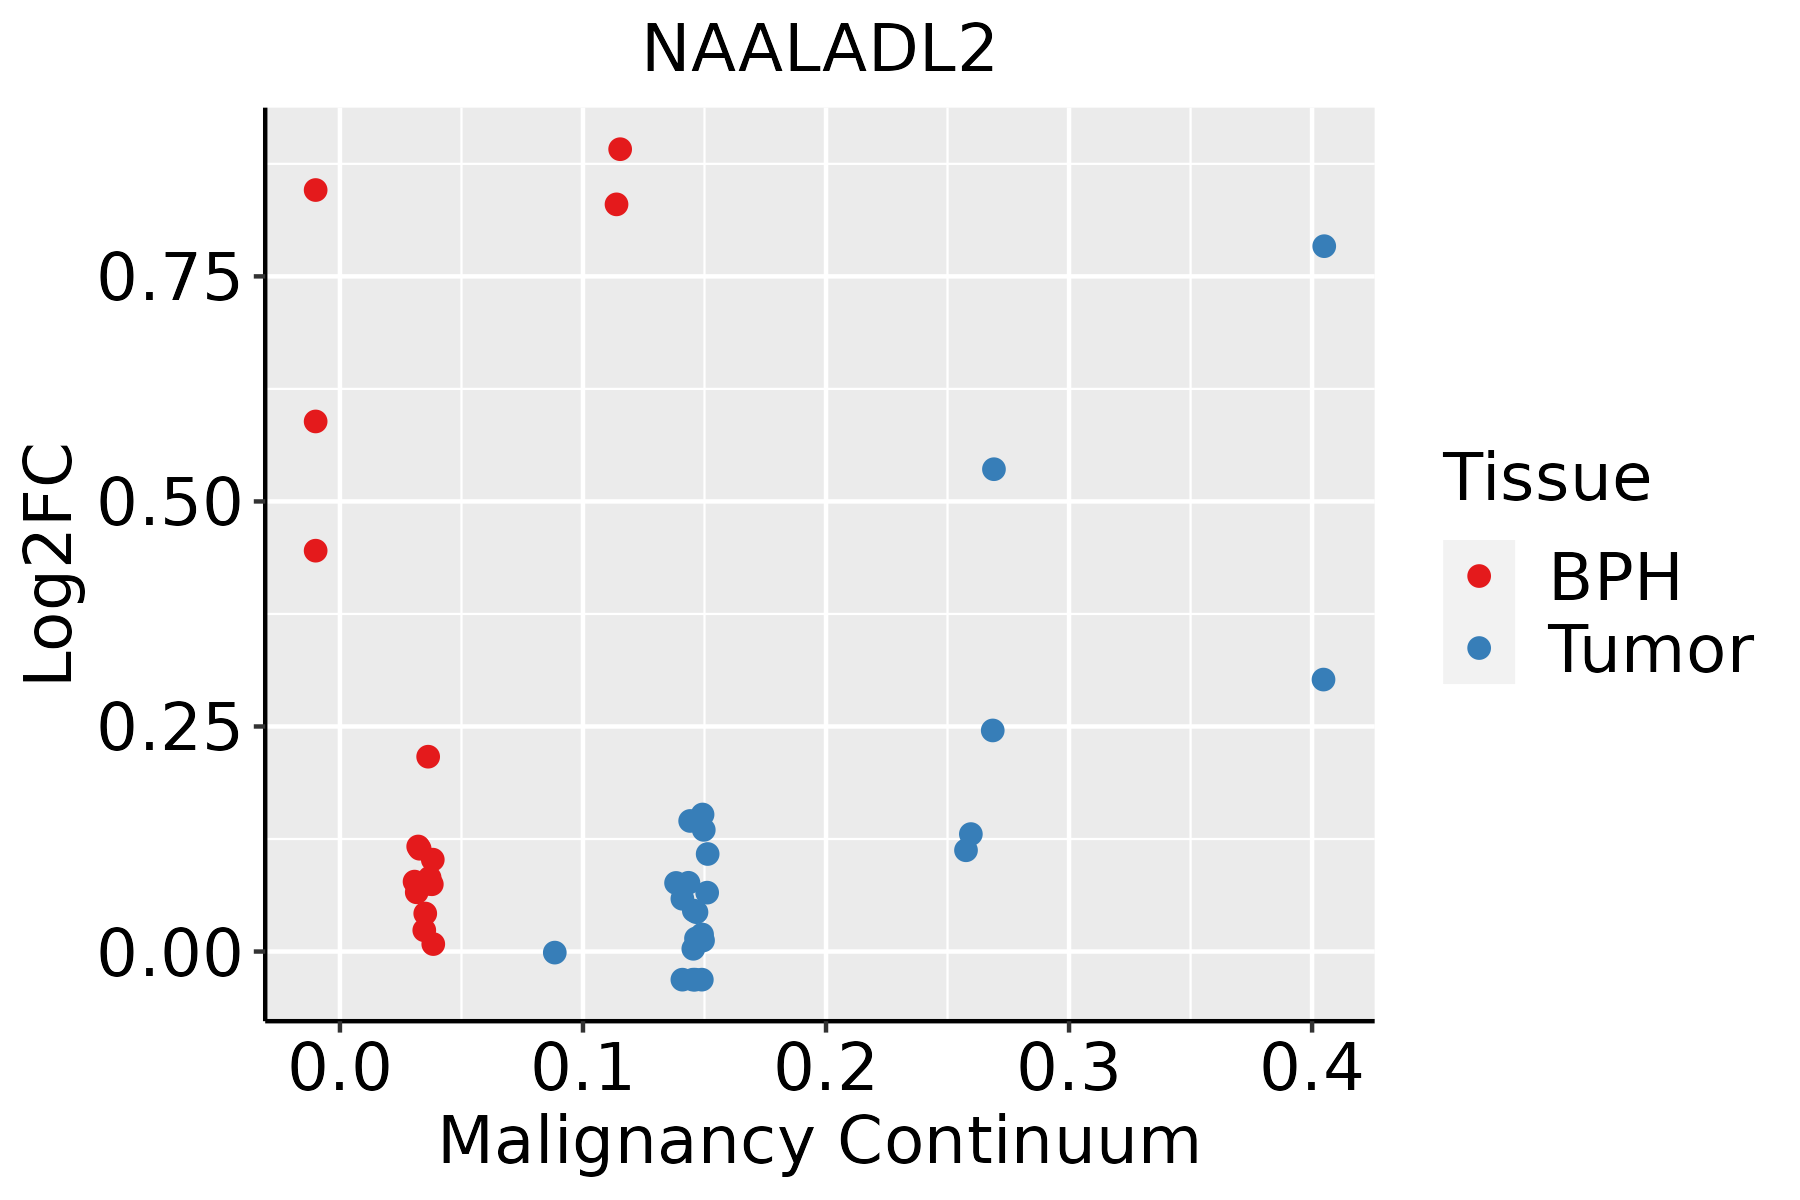 | BPH: Benign Prostatic Hyperplasia |
| ∗log2FC in expression of this searched gene in stem-like cells from each diseased tissue sample relative to stem-like cells in normal samples in each tissue plotted against the malignancy continuum. Samples are colored based on if they are from different disease stage. |
Top |
Malignant transformation related pathway analysis |
| Find out the enriched GO biological processes and KEGG pathways involved in transition from healthy to precancer to cancer |
| Tissue | Disease Stage | Enriched GO biological Processes |
| Colorectum | AD |  |
| Colorectum | SER |  |
| Colorectum | MSS |  |
| Colorectum | MSI-H |  |
| Colorectum | FAP |  |
| ∗Top 15 enriched GO BP terms are showed in the bar plot of each disease state in each tissue. Each row represents a significant GO biological process which is colored according to the -log10(p.adjust). |
| Page: 1 2 3 4 5 6 7 8 9 |
| GO ID | Tissue | Disease Stage | Description | Gene Ratio | Bg Ratio | pvalue | p.adjust | Count |
| Page: 1 |
| Pathway ID | Tissue | Disease Stage | Description | Gene Ratio | Bg Ratio | pvalue | p.adjust | qvalue | Count |
| Page: 1 |
Top |
Cell-cell communication analysis |
| Identification of potential cell-cell interactions between two cell types and their ligand-receptor pairs for different disease states |
| Ligand | Receptor | LRpair | Pathway | Tissue | Disease Stage |
| Page: 1 |
Top |
Single-cell gene regulatory network inference analysis |
| Find out the significant the regulons (TFs) and the target genes of each regulon across cell types for different disease states |
| TF | Cell Type | Tissue | Disease Stage | Target Gene | RSS | Regulon Activity |
| ∗The dot plots of a searched regulon are shown for all cell subpopulations in each disease state of each tissue based on the regulon specific score inferred using pySCENIC and by calculating the average expression. |
| Page: 1 |
Top |
Somatic mutation of malignant transformation related genes |
| Annotation of somatic variants for genes involved in malignant transformation |
| Hugo Symbol | Variant Class | Variant Classification | dbSNP RS | HGVSc | HGVSp | HGVSp Short | SWISSPROT | BIOTYPE | SIFT | PolyPhen | Tumor Sample Barcode | Tissue | Histology | Sex | Age | Stage | Therapy Types | Drugs | Outcome |
| NAALADL2 | SNV | Missense_Mutation | rs367650158 | c.1681N>A | p.Ala561Thr | p.A561T | Q58DX5 | protein_coding | tolerated(0.68) | benign(0.003) | TCGA-A2-A0EV-01 | Breast | breast invasive carcinoma | Female | >=65 | I/II | Unknown | Unknown | SD |
| NAALADL2 | SNV | Missense_Mutation | novel | c.253N>T | p.Asp85Tyr | p.D85Y | Q58DX5 | protein_coding | deleterious(0) | possibly_damaging(0.781) | TCGA-AN-A046-01 | Breast | breast invasive carcinoma | Female | >=65 | I/II | Unknown | Unknown | SD |
| NAALADL2 | SNV | Missense_Mutation | novel | c.73G>A | p.Ala25Thr | p.A25T | Q58DX5 | protein_coding | deleterious(0.01) | possibly_damaging(0.769) | TCGA-B6-A0X1-01 | Breast | breast invasive carcinoma | Female | <65 | I/II | Unknown | Unknown | PD |
| NAALADL2 | SNV | Missense_Mutation | c.635N>C | p.Val212Ala | p.V212A | Q58DX5 | protein_coding | tolerated(0.43) | benign(0.138) | TCGA-D8-A1XK-01 | Breast | breast invasive carcinoma | Female | <65 | I/II | Chemotherapy | doxorubicine+cyclophosphamide | SD | |
| NAALADL2 | SNV | Missense_Mutation | c.857N>T | p.Asp286Val | p.D286V | Q58DX5 | protein_coding | deleterious(0) | probably_damaging(0.996) | TCGA-E2-A14S-01 | Breast | breast invasive carcinoma | Female | >=65 | I/II | Chemotherapy | cytoxan | SD | |
| NAALADL2 | SNV | Missense_Mutation | c.1023N>G | p.Ser341Arg | p.S341R | Q58DX5 | protein_coding | tolerated(0.42) | benign(0.168) | TCGA-E2-A155-01 | Breast | breast invasive carcinoma | Female | <65 | I/II | Chemotherapy | cytoxan | SD | |
| NAALADL2 | SNV | Missense_Mutation | c.1653N>T | p.Glu551Asp | p.E551D | Q58DX5 | protein_coding | tolerated(0.1) | probably_damaging(0.998) | TCGA-E2-A15K-06 | Breast | breast invasive carcinoma | Female | <65 | I/II | Chemotherapy | adriamycin | SD | |
| NAALADL2 | SNV | Missense_Mutation | novel | c.736N>A | p.Pro246Thr | p.P246T | Q58DX5 | protein_coding | tolerated(0.06) | possibly_damaging(0.477) | TCGA-LL-A740-01 | Breast | breast invasive carcinoma | Female | <65 | I/II | Chemotherapy | adriamycin | CR |
| NAALADL2 | SNV | Missense_Mutation | novel | c.1943N>A | p.Pro648His | p.P648H | Q58DX5 | protein_coding | deleterious(0) | probably_damaging(0.997) | TCGA-PL-A8LZ-01 | Breast | breast invasive carcinoma | Female | <65 | III/IV | Chemotherapy | paclitaxel | SD |
| NAALADL2 | SNV | Missense_Mutation | rs370137851 | c.1205C>T | p.Ala402Val | p.A402V | Q58DX5 | protein_coding | tolerated(0.47) | benign(0) | TCGA-2W-A8YY-01 | Cervix | cervical & endocervical cancer | Female | <65 | I/II | Chemotherapy | cisplatin | CR |
| Page: 1 2 3 4 5 6 7 8 9 10 11 |
Top |
Related drugs of malignant transformation related genes |
| Identification of chemicals and drugs interact with genes involved in malignant transfromation |
| (DGIdb 4.0) |
| Entrez ID | Symbol | Category | Interaction Types | Drug Claim Name | Drug Name | PMIDs |
| Page: 1 |

Copyright 2023-Present -The University of Texas Health Science Center at Houston |