
|
|||||
|
 | |
| |
| |
| |
| |
| |
|
Gene: NAAA |
Gene summary for NAAA |
| Gene information | Species | Human | Gene symbol | NAAA | Gene ID | 27163 |
| Gene name | N-acylethanolamine acid amidase | |
| Gene Alias | ASAHL | |
| Cytomap | 4q21.1 | |
| Gene Type | protein-coding | GO ID | GO:0006066 | UniProtAcc | Q02083 |
Top |
Malignant transformation analysis |
| Identification of the aberrant gene expression in precancerous and cancerous lesions by comparing the gene expression of stem-like cells in diseased tissues with normal stem cells |
| Entrez ID | Symbol | Replicates | Species | Organ | Tissue | Adj P-value | Log2FC | Malignancy |
| 27163 | NAAA | HTA11_2487_2000001011 | Human | Colorectum | SER | 1.47e-04 | 5.26e-01 | -0.1808 |
| 27163 | NAAA | HTA11_347_2000001011 | Human | Colorectum | AD | 1.93e-38 | 1.10e+00 | -0.1954 |
| 27163 | NAAA | HTA11_2112_2000001011 | Human | Colorectum | SER | 3.16e-02 | 7.83e-01 | -0.2196 |
| 27163 | NAAA | HTA11_7663_2000001011 | Human | Colorectum | SER | 8.89e-05 | 6.77e-01 | 0.0131 |
| 27163 | NAAA | A001-C-207 | Human | Colorectum | FAP | 3.39e-02 | -2.14e-01 | 0.1278 |
| 27163 | NAAA | A015-C-203 | Human | Colorectum | FAP | 2.24e-06 | -1.94e-01 | -0.1294 |
| 27163 | NAAA | A002-C-201 | Human | Colorectum | FAP | 1.58e-05 | -2.19e-01 | 0.0324 |
| 27163 | NAAA | A001-C-119 | Human | Colorectum | FAP | 2.63e-02 | -2.34e-01 | -0.1557 |
| 27163 | NAAA | A001-C-108 | Human | Colorectum | FAP | 4.31e-04 | -1.65e-01 | -0.0272 |
| 27163 | NAAA | A002-C-205 | Human | Colorectum | FAP | 3.61e-06 | -2.09e-01 | -0.1236 |
| 27163 | NAAA | A015-C-006 | Human | Colorectum | FAP | 4.26e-05 | -2.71e-01 | -0.0994 |
| 27163 | NAAA | A015-C-106 | Human | Colorectum | FAP | 2.95e-02 | -1.72e-01 | -0.0511 |
| 27163 | NAAA | A002-C-114 | Human | Colorectum | FAP | 4.53e-07 | -2.75e-01 | -0.1561 |
| 27163 | NAAA | A015-C-104 | Human | Colorectum | FAP | 1.64e-07 | -1.66e-01 | -0.1899 |
| 27163 | NAAA | A001-C-014 | Human | Colorectum | FAP | 2.82e-02 | -1.87e-01 | 0.0135 |
| 27163 | NAAA | A002-C-016 | Human | Colorectum | FAP | 1.26e-05 | -1.93e-01 | 0.0521 |
| 27163 | NAAA | A002-C-116 | Human | Colorectum | FAP | 5.79e-06 | -1.53e-01 | -0.0452 |
| 27163 | NAAA | A018-E-020 | Human | Colorectum | FAP | 1.17e-04 | -2.02e-01 | -0.2034 |
| 27163 | NAAA | F034 | Human | Colorectum | FAP | 8.61e-04 | -2.02e-01 | -0.0665 |
| 27163 | NAAA | CRC-1-8810 | Human | Colorectum | CRC | 8.32e-05 | -2.30e-01 | 0.6257 |
| Page: 1 2 3 4 |
| Tissue | Expression Dynamics | Abbreviation |
| Colorectum (GSE201348) |  | FAP: Familial adenomatous polyposis |
| CRC: Colorectal cancer | ||
| Colorectum (HTA11) |  | AD: Adenomas |
| SER: Sessile serrated lesions | ||
| MSI-H: Microsatellite-high colorectal cancer | ||
| MSS: Microsatellite stable colorectal cancer | ||
| Esophagus |  | ESCC: Esophageal squamous cell carcinoma |
| HGIN: High-grade intraepithelial neoplasias | ||
| LGIN: Low-grade intraepithelial neoplasias | ||
| Liver | 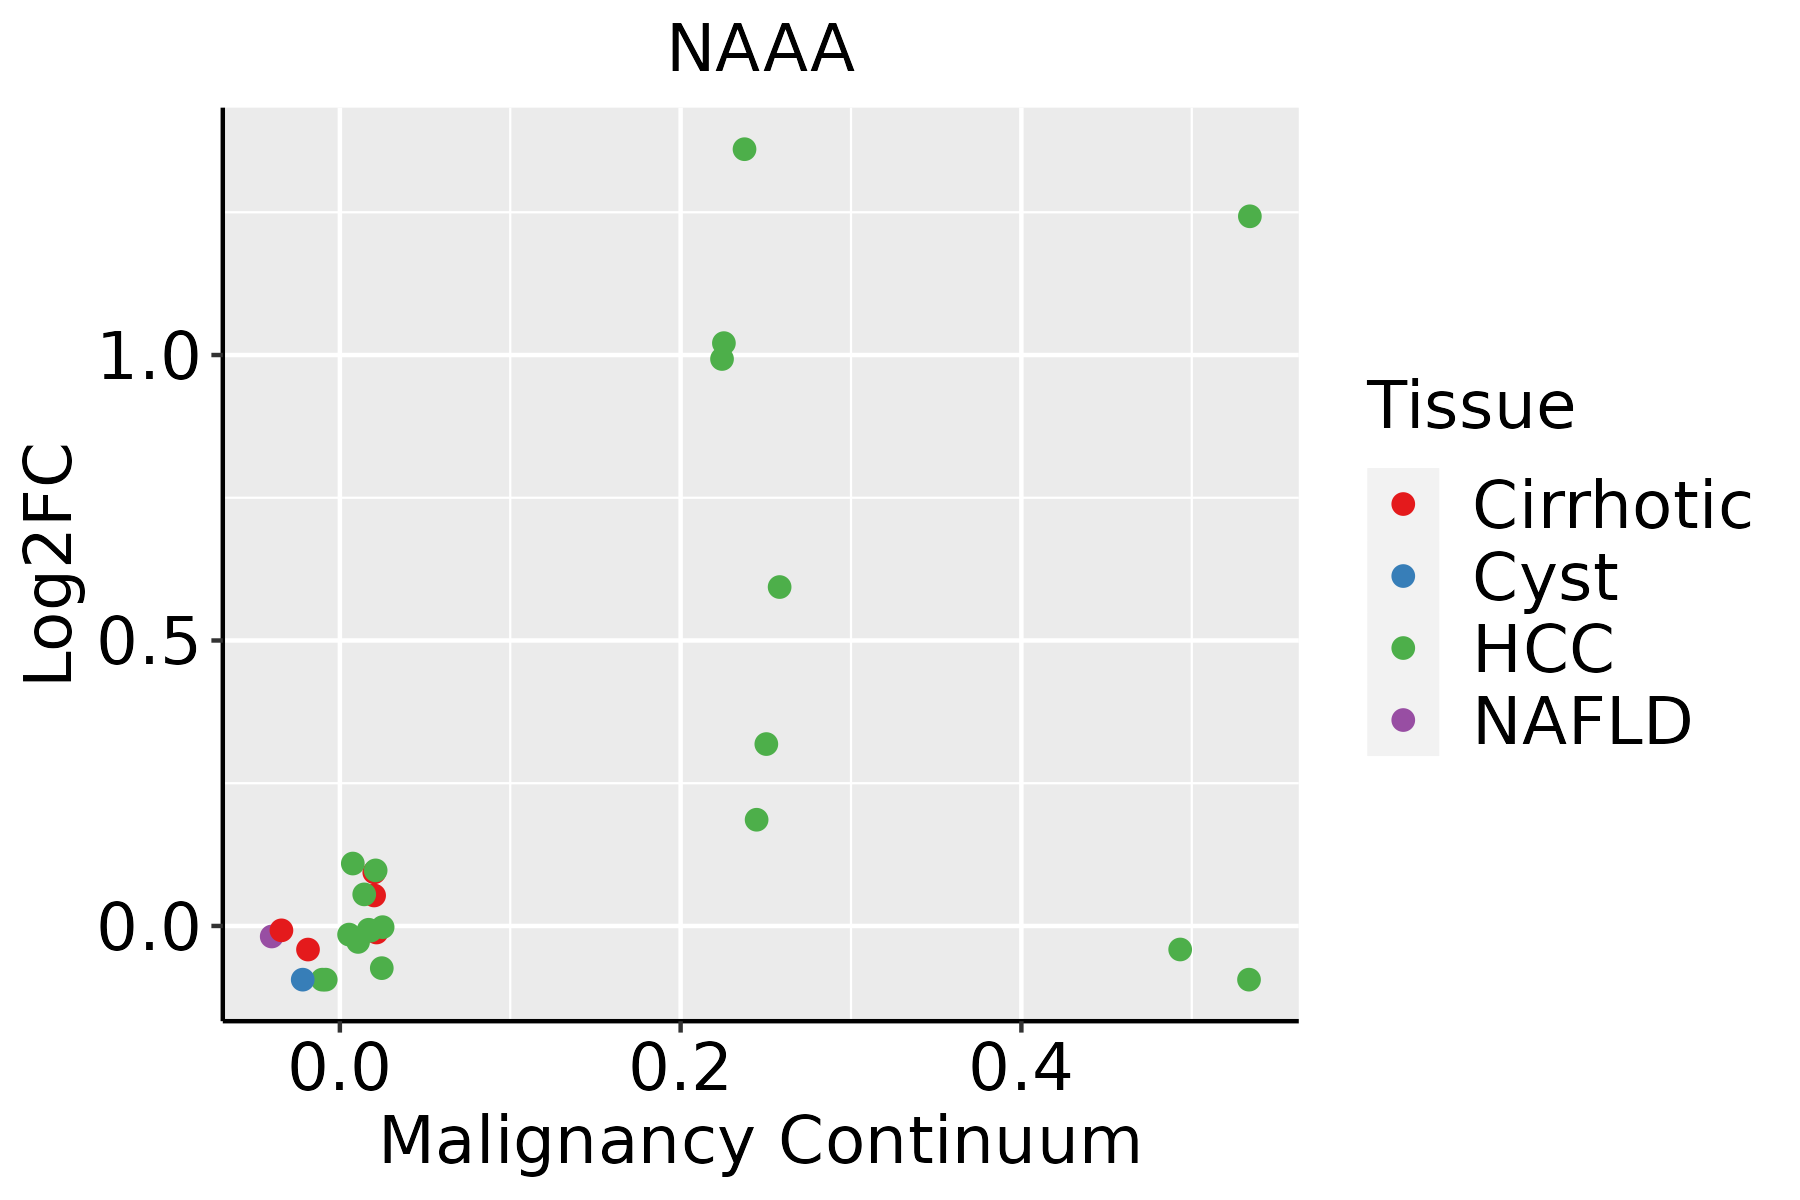 | HCC: Hepatocellular carcinoma |
| NAFLD: Non-alcoholic fatty liver disease | ||
| Prostate | 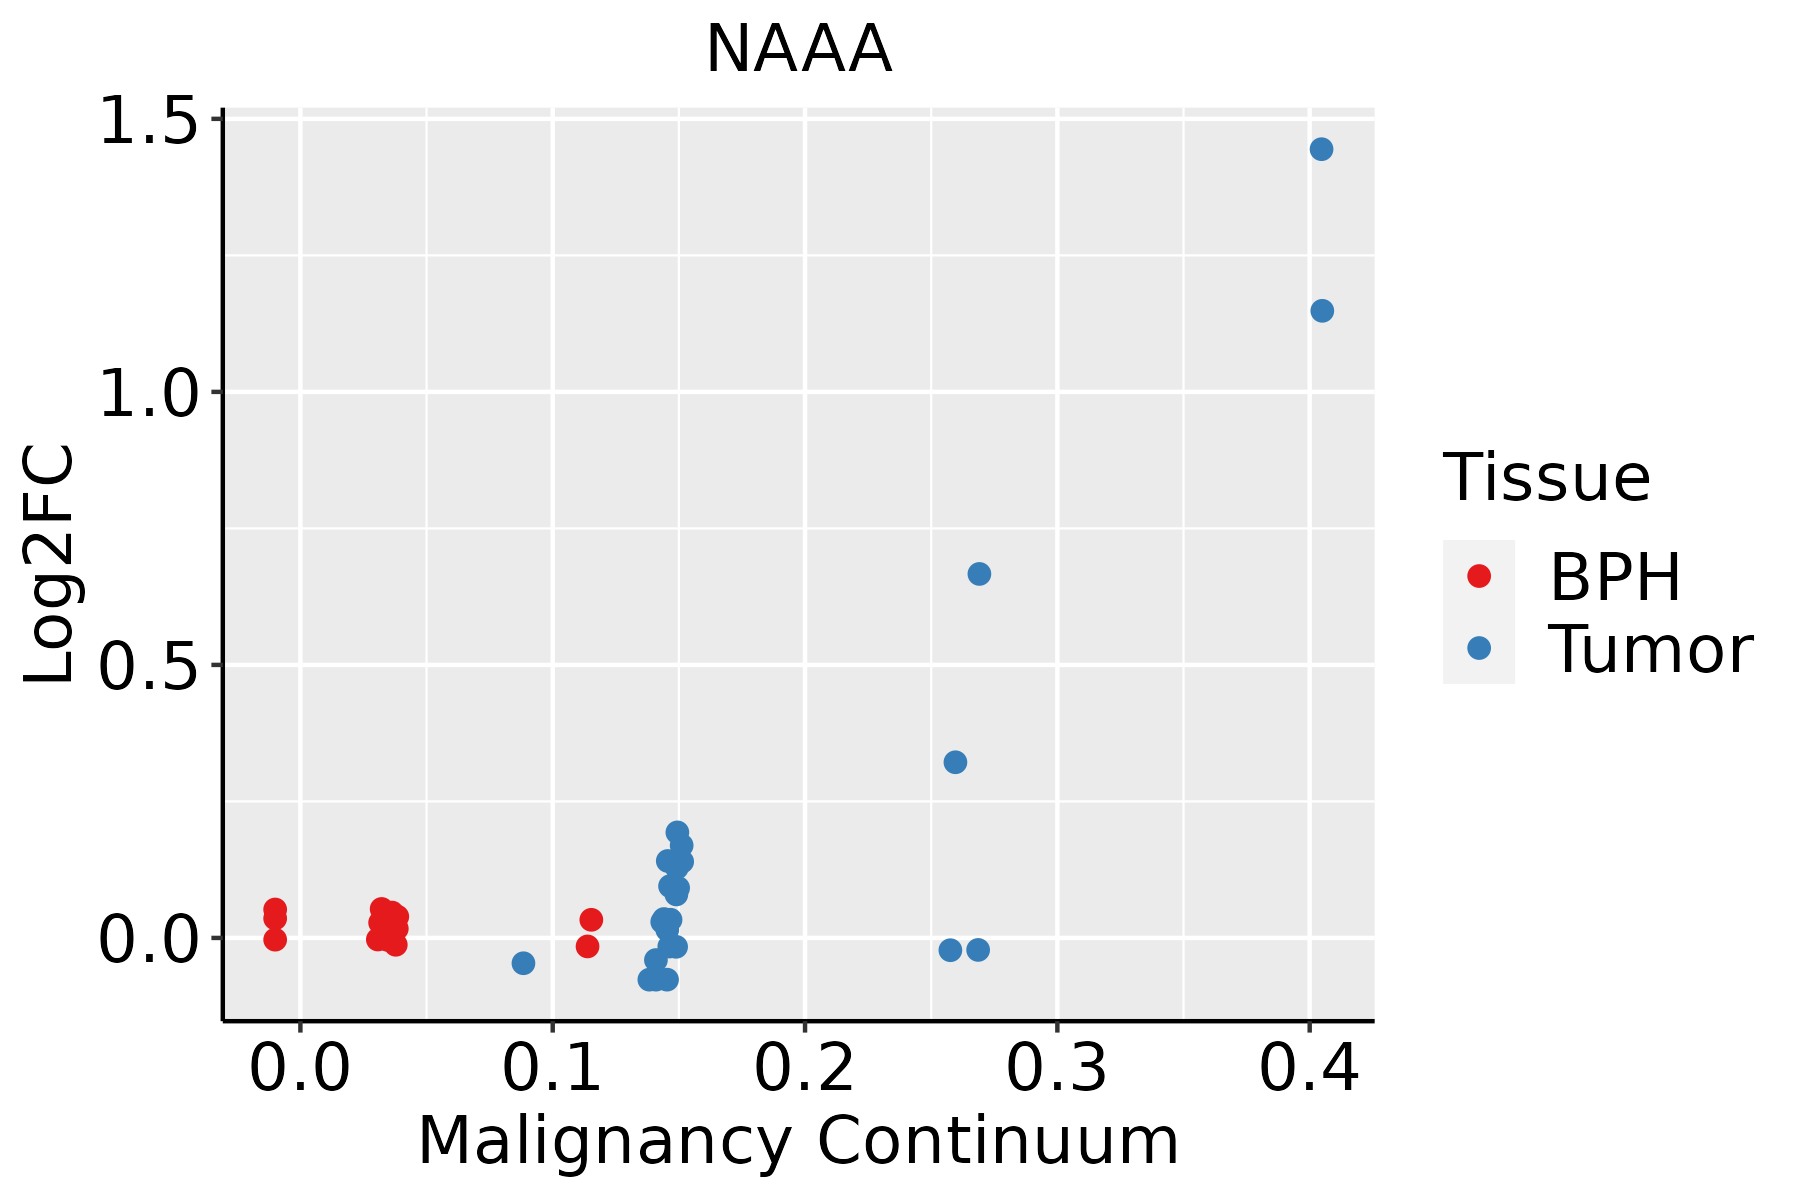 | BPH: Benign Prostatic Hyperplasia |
| ∗log2FC in expression of this searched gene in stem-like cells from each diseased tissue sample relative to stem-like cells in normal samples in each tissue plotted against the malignancy continuum. Samples are colored based on if they are from different disease stage. |
Top |
Malignant transformation related pathway analysis |
| Find out the enriched GO biological processes and KEGG pathways involved in transition from healthy to precancer to cancer |
| Tissue | Disease Stage | Enriched GO biological Processes |
| Colorectum | AD |  |
| Colorectum | SER |  |
| Colorectum | MSS |  |
| Colorectum | MSI-H |  |
| Colorectum | FAP |  |
| ∗Top 15 enriched GO BP terms are showed in the bar plot of each disease state in each tissue. Each row represents a significant GO biological process which is colored according to the -log10(p.adjust). |
| Page: 1 2 3 4 5 6 7 8 9 |
| GO ID | Tissue | Disease Stage | Description | Gene Ratio | Bg Ratio | pvalue | p.adjust | Count |
| GO:0006066 | Colorectum | AD | alcohol metabolic process | 106/3918 | 353/18723 | 3.02e-05 | 5.57e-04 | 106 |
| GO:0016042 | Colorectum | AD | lipid catabolic process | 97/3918 | 320/18723 | 4.31e-05 | 7.56e-04 | 97 |
| GO:0006631 | Colorectum | AD | fatty acid metabolic process | 114/3918 | 390/18723 | 5.58e-05 | 9.44e-04 | 114 |
| GO:0034308 | Colorectum | AD | primary alcohol metabolic process | 35/3918 | 102/18723 | 1.16e-03 | 1.05e-02 | 35 |
| GO:0006650 | Colorectum | AD | glycerophospholipid metabolic process | 83/3918 | 306/18723 | 5.40e-03 | 3.55e-02 | 83 |
| GO:0006644 | Colorectum | AD | phospholipid metabolic process | 101/3918 | 383/18723 | 5.80e-03 | 3.67e-02 | 101 |
| GO:00160421 | Colorectum | SER | lipid catabolic process | 77/2897 | 320/18723 | 3.52e-05 | 9.18e-04 | 77 |
| GO:00060661 | Colorectum | SER | alcohol metabolic process | 79/2897 | 353/18723 | 3.50e-04 | 5.50e-03 | 79 |
| GO:0046486 | Colorectum | SER | glycerolipid metabolic process | 82/2897 | 392/18723 | 2.26e-03 | 2.17e-02 | 82 |
| GO:00066441 | Colorectum | SER | phospholipid metabolic process | 79/2897 | 383/18723 | 3.94e-03 | 3.24e-02 | 79 |
| GO:00343081 | Colorectum | SER | primary alcohol metabolic process | 26/2897 | 102/18723 | 5.87e-03 | 4.29e-02 | 26 |
| GO:00066311 | Colorectum | SER | fatty acid metabolic process | 79/2897 | 390/18723 | 6.34e-03 | 4.56e-02 | 79 |
| GO:00066501 | Colorectum | SER | glycerophospholipid metabolic process | 64/2897 | 306/18723 | 6.41e-03 | 4.60e-02 | 64 |
| GO:00066313 | Colorectum | FAP | fatty acid metabolic process | 81/2622 | 390/18723 | 1.43e-04 | 2.24e-03 | 81 |
| GO:00160423 | Colorectum | FAP | lipid catabolic process | 65/2622 | 320/18723 | 1.13e-03 | 1.08e-02 | 65 |
| GO:00066502 | Colorectum | FAP | glycerophospholipid metabolic process | 62/2622 | 306/18723 | 1.54e-03 | 1.38e-02 | 62 |
| GO:00066442 | Colorectum | FAP | phospholipid metabolic process | 74/2622 | 383/18723 | 2.24e-03 | 1.83e-02 | 74 |
| GO:00060663 | Colorectum | FAP | alcohol metabolic process | 69/2622 | 353/18723 | 2.29e-03 | 1.85e-02 | 69 |
| GO:0046519 | Colorectum | FAP | sphingoid metabolic process | 8/2622 | 21/18723 | 5.43e-03 | 3.53e-02 | 8 |
| GO:00066503 | Colorectum | CRC | glycerophospholipid metabolic process | 55/2078 | 306/18723 | 2.10e-04 | 3.55e-03 | 55 |
| Page: 1 2 3 |
| Pathway ID | Tissue | Disease Stage | Description | Gene Ratio | Bg Ratio | pvalue | p.adjust | qvalue | Count |
| Page: 1 |
Top |
Cell-cell communication analysis |
| Identification of potential cell-cell interactions between two cell types and their ligand-receptor pairs for different disease states |
| Ligand | Receptor | LRpair | Pathway | Tissue | Disease Stage |
| Page: 1 |
Top |
Single-cell gene regulatory network inference analysis |
| Find out the significant the regulons (TFs) and the target genes of each regulon across cell types for different disease states |
| TF | Cell Type | Tissue | Disease Stage | Target Gene | RSS | Regulon Activity |
| ∗The dot plots of a searched regulon are shown for all cell subpopulations in each disease state of each tissue based on the regulon specific score inferred using pySCENIC and by calculating the average expression. |
| Page: 1 |
Top |
Somatic mutation of malignant transformation related genes |
| Annotation of somatic variants for genes involved in malignant transformation |
| Hugo Symbol | Variant Class | Variant Classification | dbSNP RS | HGVSc | HGVSp | HGVSp Short | SWISSPROT | BIOTYPE | SIFT | PolyPhen | Tumor Sample Barcode | Tissue | Histology | Sex | Age | Stage | Therapy Types | Drugs | Outcome |
| NAAA | SNV | Missense_Mutation | c.796N>C | p.Asp266His | p.D266H | Q02083 | protein_coding | tolerated(0.12) | possibly_damaging(0.587) | TCGA-EK-A3GK-01 | Cervix | cervical & endocervical cancer | Female | <65 | I/II | Unknown | Unknown | SD | |
| NAAA | SNV | Missense_Mutation | novel | c.284N>C | p.Phe95Ser | p.F95S | Q02083 | protein_coding | deleterious(0) | possibly_damaging(0.467) | TCGA-AA-3947-01 | Colorectum | colon adenocarcinoma | Female | <65 | I/II | Unknown | Unknown | SD |
| NAAA | SNV | Missense_Mutation | novel | c.961N>A | p.Leu321Ile | p.L321I | Q02083 | protein_coding | deleterious(0.04) | benign(0.288) | TCGA-AA-3952-01 | Colorectum | colon adenocarcinoma | Male | >=65 | III/IV | Unknown | Unknown | PD |
| NAAA | SNV | Missense_Mutation | novel | c.432N>T | p.Leu144Phe | p.L144F | Q02083 | protein_coding | tolerated(0.08) | probably_damaging(0.974) | TCGA-AA-3984-01 | Colorectum | colon adenocarcinoma | Female | <65 | I/II | Unknown | Unknown | SD |
| NAAA | SNV | Missense_Mutation | c.294N>T | p.Glu98Asp | p.E98D | Q02083 | protein_coding | deleterious(0) | probably_damaging(0.999) | TCGA-AA-A010-01 | Colorectum | colon adenocarcinoma | Female | <65 | I/II | Chemotherapy | folinic | CR | |
| NAAA | SNV | Missense_Mutation | c.139C>T | p.Arg47Cys | p.R47C | Q02083 | protein_coding | deleterious(0) | probably_damaging(0.999) | TCGA-AM-5821-01 | Colorectum | colon adenocarcinoma | Female | >=65 | I/II | Unknown | Unknown | SD | |
| NAAA | SNV | Missense_Mutation | c.910N>A | p.Ala304Thr | p.A304T | Q02083 | protein_coding | deleterious(0.01) | probably_damaging(0.998) | TCGA-AY-6197-01 | Colorectum | colon adenocarcinoma | Male | <65 | I/II | Unknown | Unknown | SD | |
| NAAA | SNV | Missense_Mutation | c.632N>A | p.Arg211Gln | p.R211Q | Q02083 | protein_coding | tolerated(0.74) | benign(0.001) | TCGA-G4-6588-01 | Colorectum | colon adenocarcinoma | Female | <65 | I/II | Unknown | Unknown | SD | |
| NAAA | SNV | Missense_Mutation | rs772892418 | c.619N>A | p.Ala207Thr | p.A207T | Q02083 | protein_coding | deleterious(0.04) | benign(0.151) | TCGA-NH-A5IV-01 | Colorectum | colon adenocarcinoma | Female | >=65 | I/II | Unknown | Unknown | SD |
| NAAA | SNV | Missense_Mutation | c.918G>T | p.Lys306Asn | p.K306N | Q02083 | protein_coding | tolerated(0.06) | possibly_damaging(0.705) | TCGA-DY-A1DD-01 | Colorectum | rectum adenocarcinoma | Female | >=65 | III/IV | Unknown | Unknown | SD |
| Page: 1 2 3 4 |
Top |
Related drugs of malignant transformation related genes |
| Identification of chemicals and drugs interact with genes involved in malignant transfromation |
| (DGIdb 4.0) |
| Entrez ID | Symbol | Category | Interaction Types | Drug Claim Name | Drug Name | PMIDs |
| 27163 | NAAA | ENZYME, DRUGGABLE GENOME | inhibitor | 381118830 | ||
| 27163 | NAAA | ENZYME, DRUGGABLE GENOME | inhibitor | 178101852 | ||
| 27163 | NAAA | ENZYME, DRUGGABLE GENOME | inhibitor | 315661261 | ||
| 27163 | NAAA | ENZYME, DRUGGABLE GENOME | inhibitor | 381118831 | ||
| 27163 | NAAA | ENZYME, DRUGGABLE GENOME | CYCLOPENTYL PALMITATE | CYCLOPENTYL PALMITATE | 20022504 |
| Page: 1 |

Copyright 2023-Present -The University of Texas Health Science Center at Houston |