
|
|||||
|
 | |
| |
| |
| |
| |
| |
|
Gene: NAA50 |
Gene summary for NAA50 |
| Gene information | Species | Human | Gene symbol | NAA50 | Gene ID | 80218 |
| Gene name | N-alpha-acetyltransferase 50, NatE catalytic subunit | |
| Gene Alias | MAK3 | |
| Cytomap | 3q13.31 | |
| Gene Type | protein-coding | GO ID | GO:0000070 | UniProtAcc | E7EQ69 |
Top |
Malignant transformation analysis |
| Identification of the aberrant gene expression in precancerous and cancerous lesions by comparing the gene expression of stem-like cells in diseased tissues with normal stem cells |
| Entrez ID | Symbol | Replicates | Species | Organ | Tissue | Adj P-value | Log2FC | Malignancy |
| 80218 | NAA50 | CA_HPV_3 | Human | Cervix | CC | 6.83e-03 | 1.21e-01 | 0.0414 |
| 80218 | NAA50 | CCI_2 | Human | Cervix | CC | 2.47e-09 | 8.33e-01 | 0.5249 |
| 80218 | NAA50 | CCI_3 | Human | Cervix | CC | 1.89e-08 | 9.96e-01 | 0.516 |
| 80218 | NAA50 | Tumor | Human | Cervix | CC | 1.25e-18 | 4.72e-01 | 0.1241 |
| 80218 | NAA50 | sample1 | Human | Cervix | CC | 2.20e-06 | 4.65e-01 | 0.0959 |
| 80218 | NAA50 | sample3 | Human | Cervix | CC | 9.71e-26 | 4.57e-01 | 0.1387 |
| 80218 | NAA50 | T1 | Human | Cervix | CC | 5.88e-07 | 3.77e-01 | 0.0918 |
| 80218 | NAA50 | T3 | Human | Cervix | CC | 3.20e-23 | 4.48e-01 | 0.1389 |
| 80218 | NAA50 | HTA11_3410_2000001011 | Human | Colorectum | AD | 4.71e-10 | -4.71e-01 | 0.0155 |
| 80218 | NAA50 | HTA11_3361_2000001011 | Human | Colorectum | AD | 1.77e-02 | -4.55e-01 | -0.1207 |
| 80218 | NAA50 | HTA11_696_2000001011 | Human | Colorectum | AD | 2.15e-12 | -3.91e-01 | -0.1464 |
| 80218 | NAA50 | HTA11_866_2000001011 | Human | Colorectum | AD | 5.89e-05 | -3.37e-01 | -0.1001 |
| 80218 | NAA50 | HTA11_866_3004761011 | Human | Colorectum | AD | 2.92e-03 | -3.39e-01 | 0.096 |
| 80218 | NAA50 | HTA11_10711_2000001011 | Human | Colorectum | AD | 5.57e-03 | -4.34e-01 | 0.0338 |
| 80218 | NAA50 | HTA11_7696_3000711011 | Human | Colorectum | AD | 2.84e-05 | -3.69e-01 | 0.0674 |
| 80218 | NAA50 | HTA11_99999971662_82457 | Human | Colorectum | MSS | 2.92e-03 | -2.83e-01 | 0.3859 |
| 80218 | NAA50 | HTA11_99999974143_84620 | Human | Colorectum | MSS | 5.26e-15 | -4.80e-01 | 0.3005 |
| 80218 | NAA50 | F007 | Human | Colorectum | FAP | 2.47e-02 | -3.39e-01 | 0.1176 |
| 80218 | NAA50 | A001-C-207 | Human | Colorectum | FAP | 1.03e-03 | -3.05e-01 | 0.1278 |
| 80218 | NAA50 | A015-C-203 | Human | Colorectum | FAP | 6.96e-24 | -4.32e-01 | -0.1294 |
| Page: 1 2 3 4 5 6 7 8 9 |
| Tissue | Expression Dynamics | Abbreviation |
| Cervix | 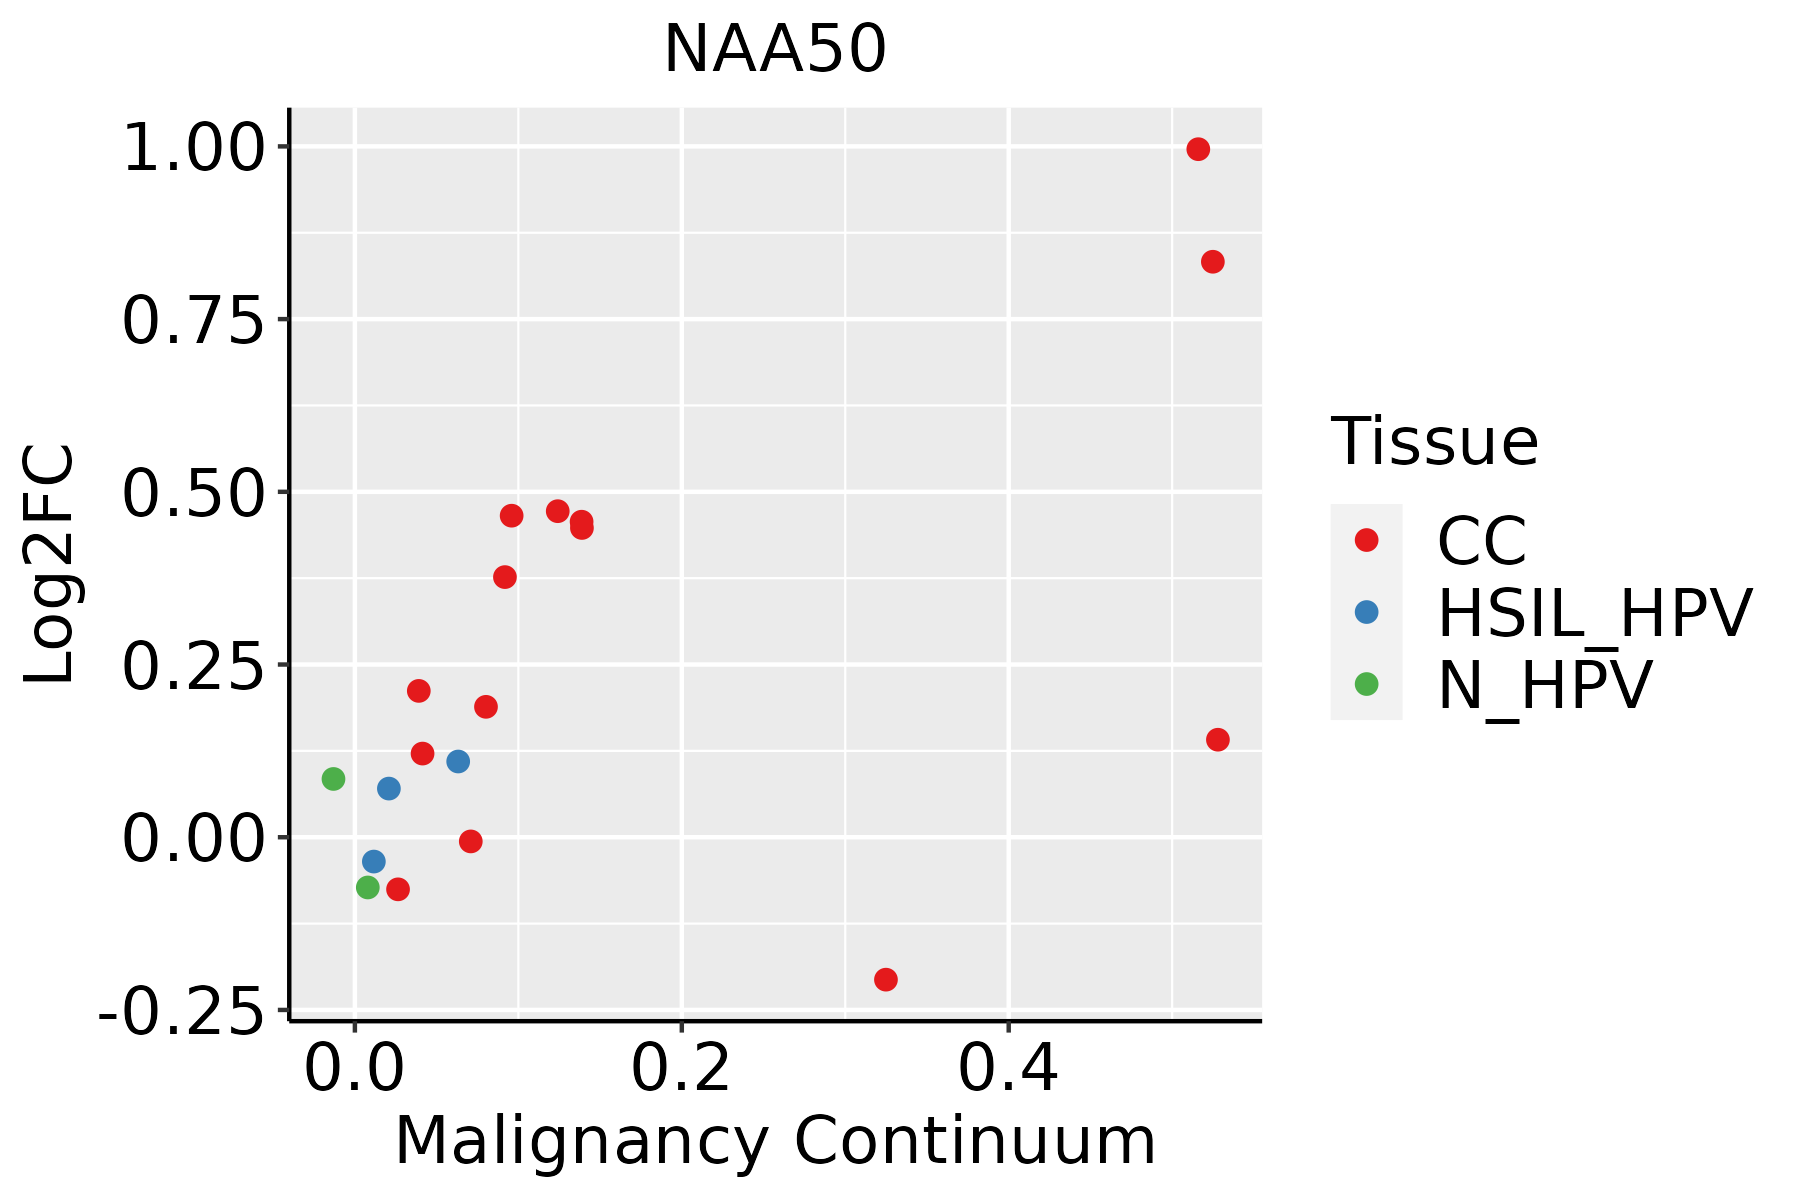 | CC: Cervix cancer |
| HSIL_HPV: HPV-infected high-grade squamous intraepithelial lesions | ||
| N_HPV: HPV-infected normal cervix | ||
| Colorectum (GSE201348) |  | FAP: Familial adenomatous polyposis |
| CRC: Colorectal cancer | ||
| Colorectum (HTA11) |  | AD: Adenomas |
| SER: Sessile serrated lesions | ||
| MSI-H: Microsatellite-high colorectal cancer | ||
| MSS: Microsatellite stable colorectal cancer | ||
| Esophagus | 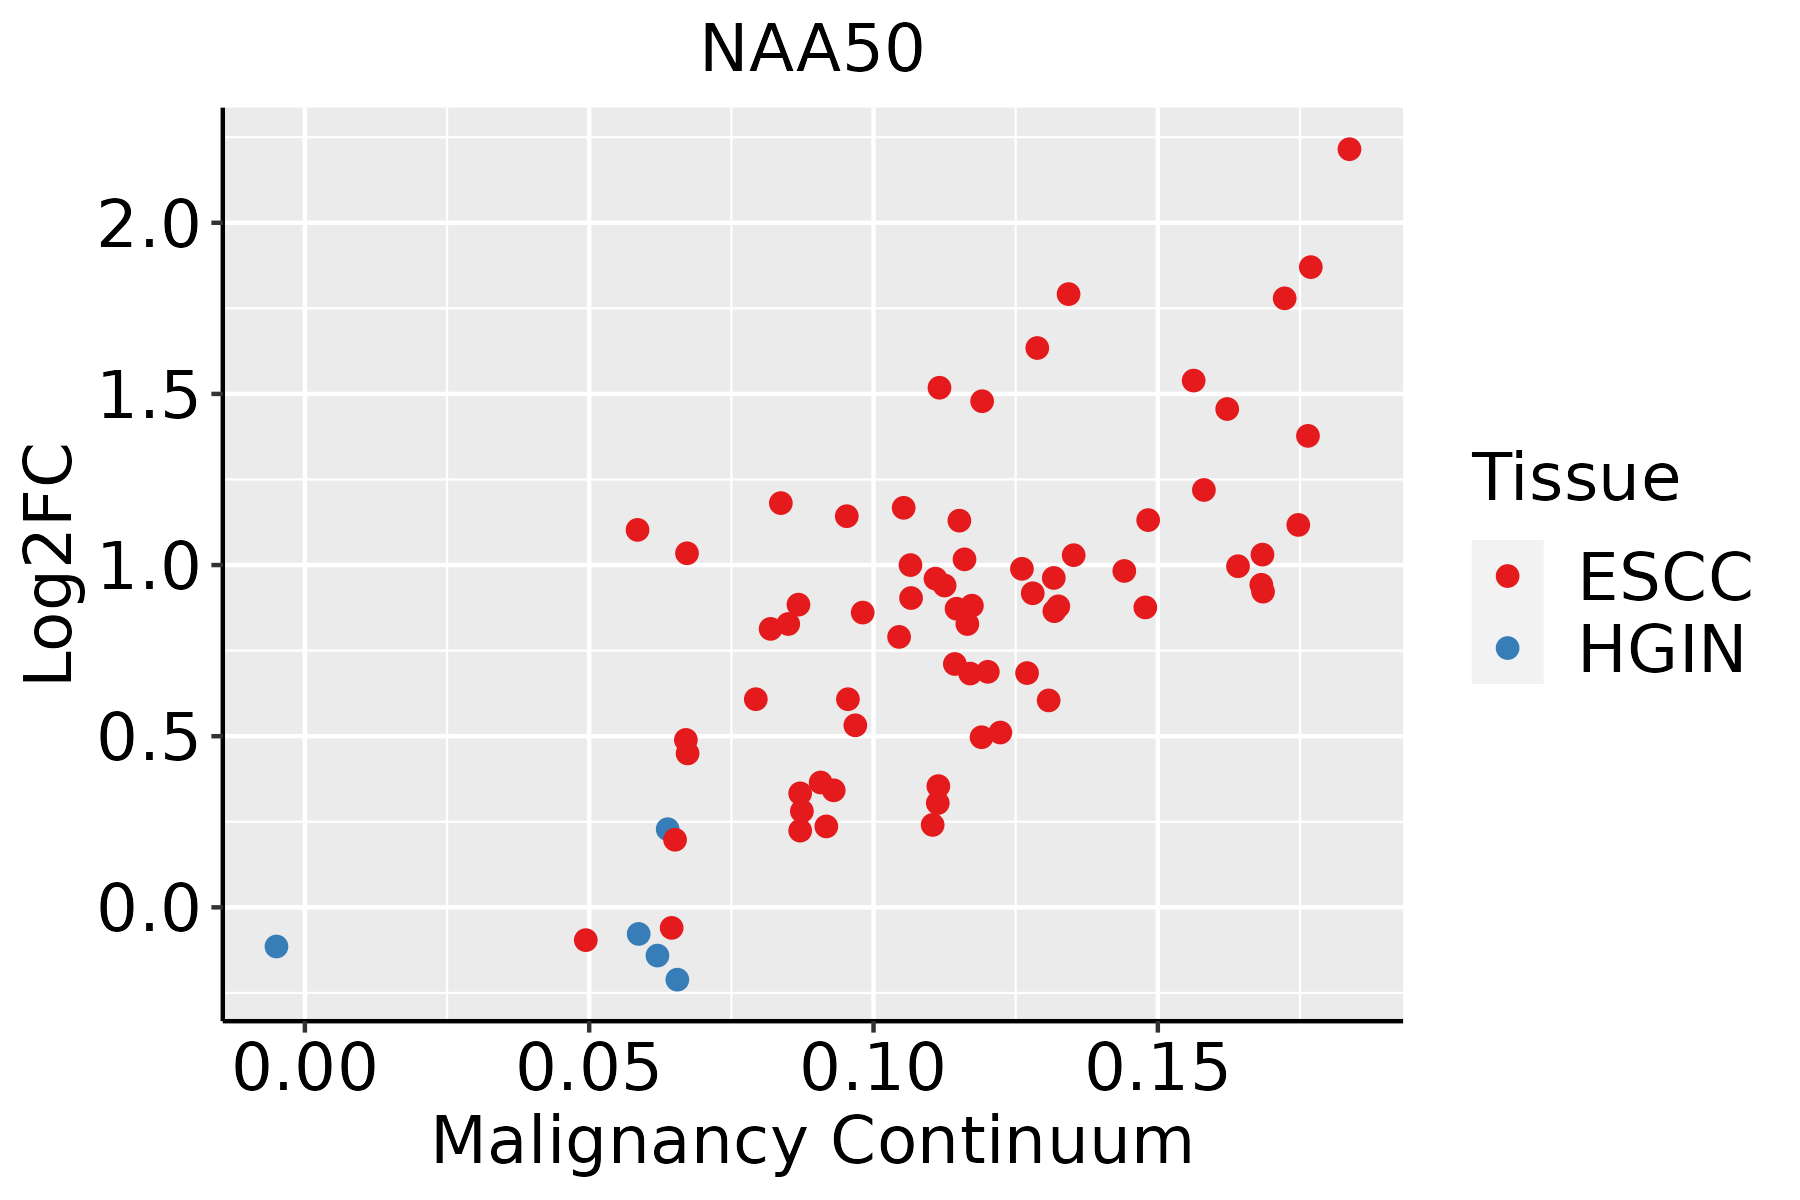 | ESCC: Esophageal squamous cell carcinoma |
| HGIN: High-grade intraepithelial neoplasias | ||
| LGIN: Low-grade intraepithelial neoplasias | ||
| Liver | 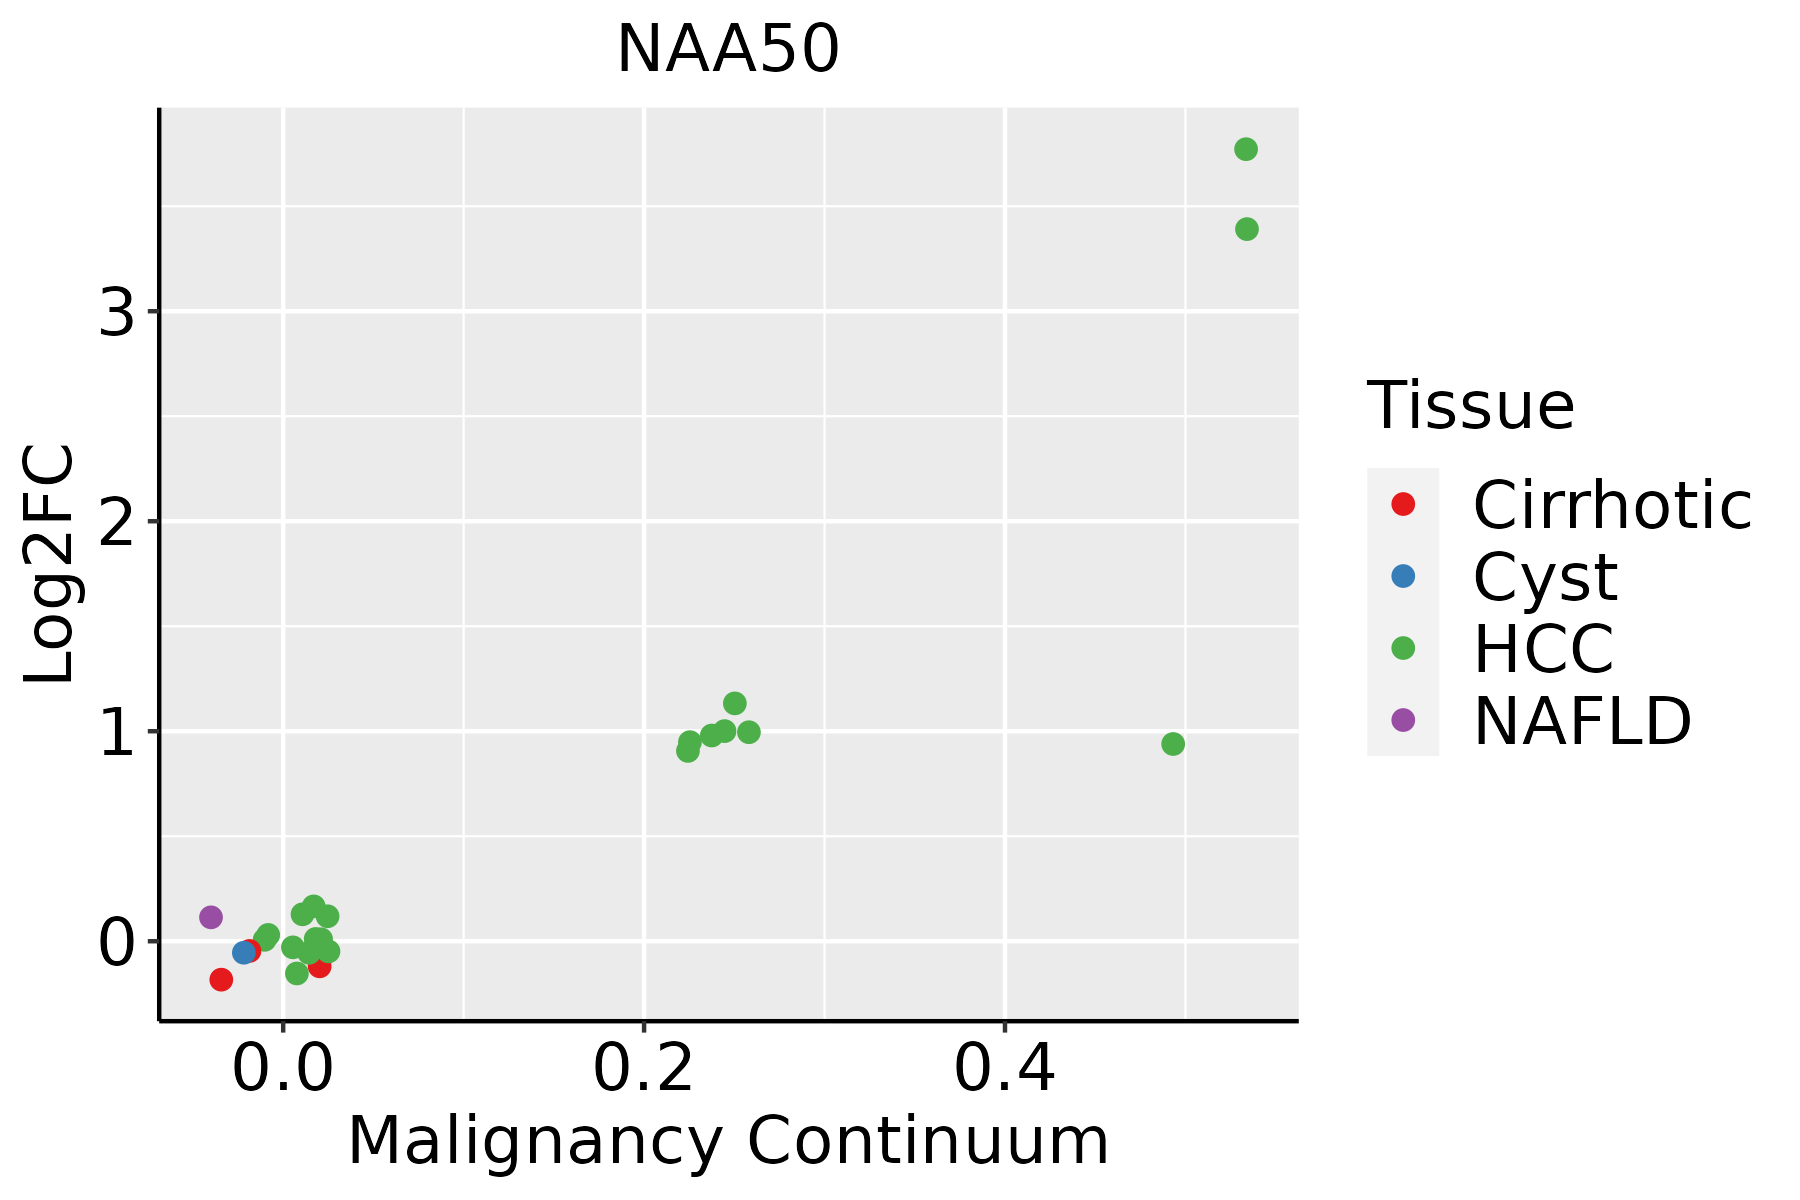 | HCC: Hepatocellular carcinoma |
| NAFLD: Non-alcoholic fatty liver disease | ||
| Oral Cavity | 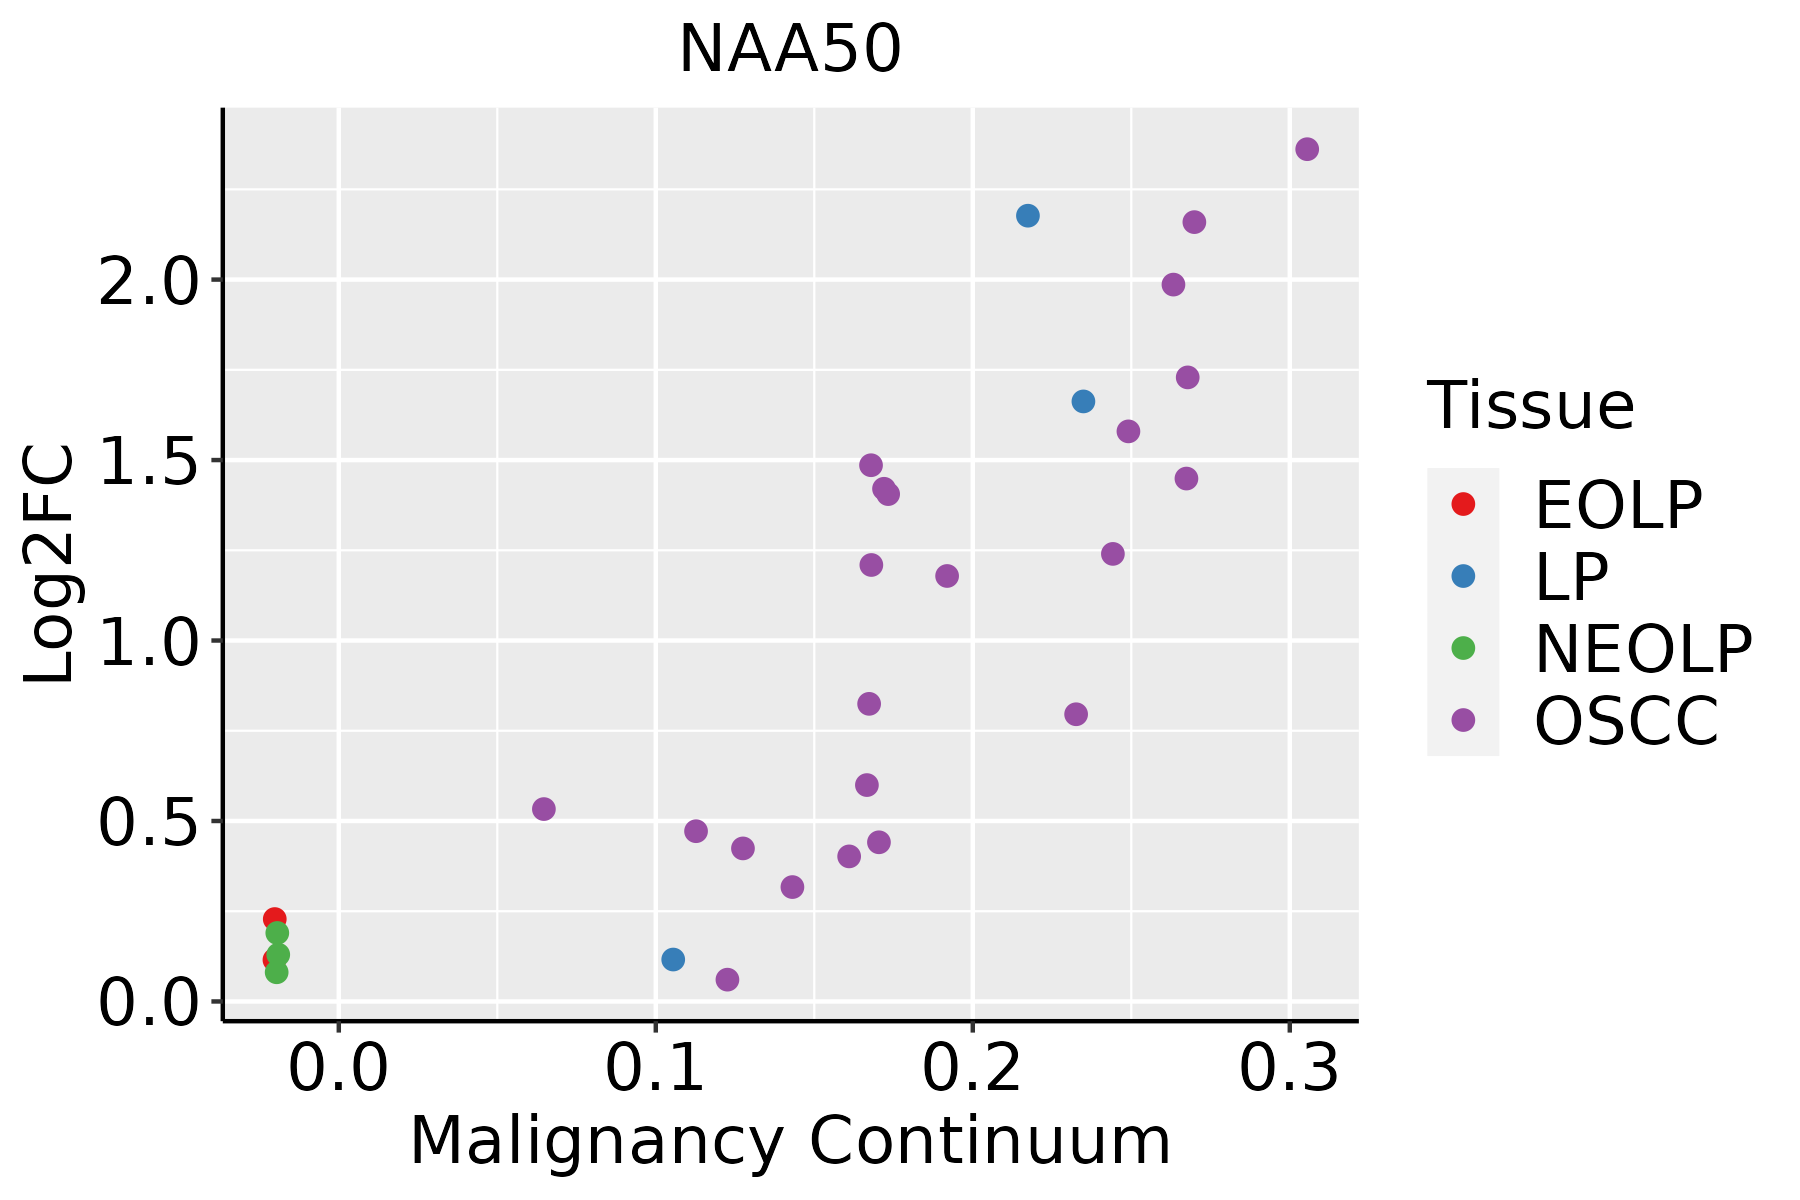 | EOLP: Erosive Oral lichen planus |
| LP: leukoplakia | ||
| NEOLP: Non-erosive oral lichen planus | ||
| OSCC: Oral squamous cell carcinoma | ||
| Skin | 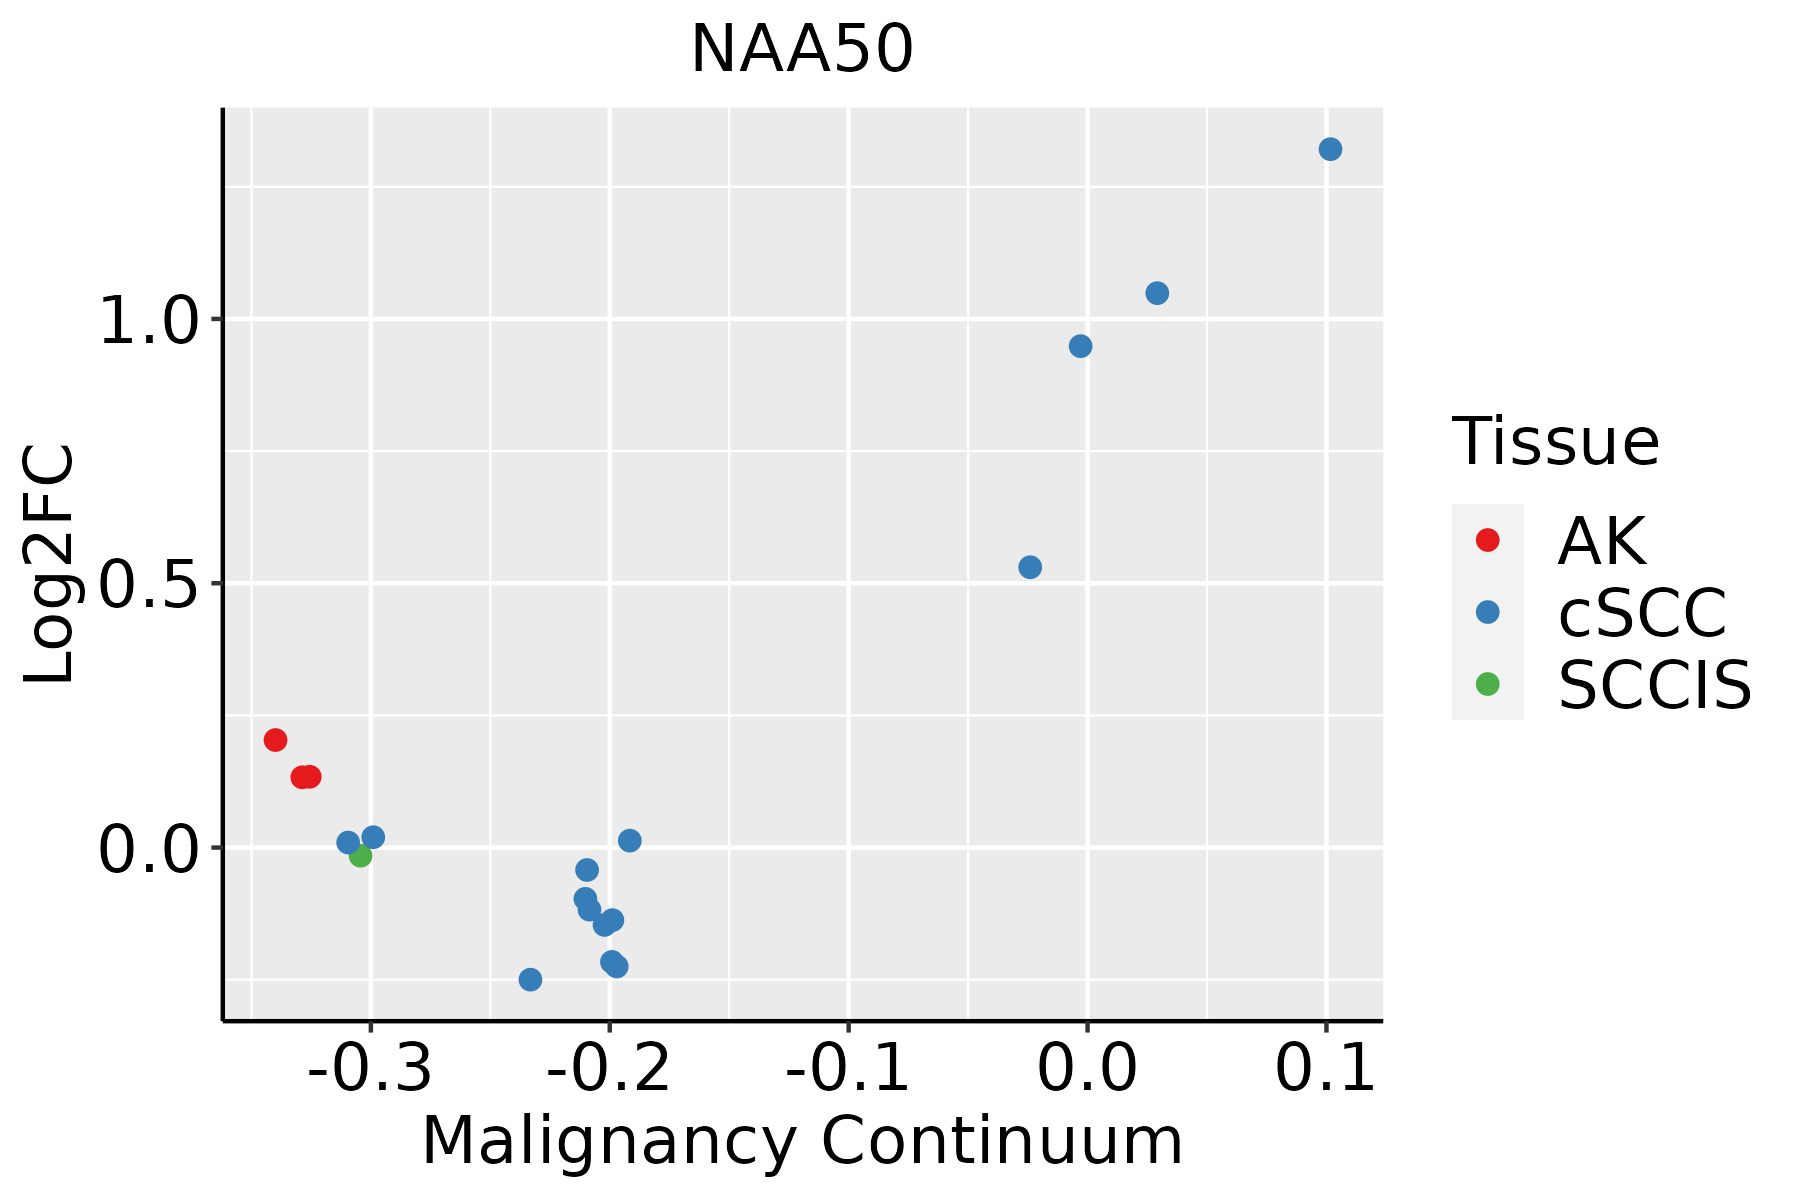 | AK: Actinic keratosis |
| cSCC: Cutaneous squamous cell carcinoma | ||
| SCCIS:squamous cell carcinoma in situ | ||
| Thyroid | 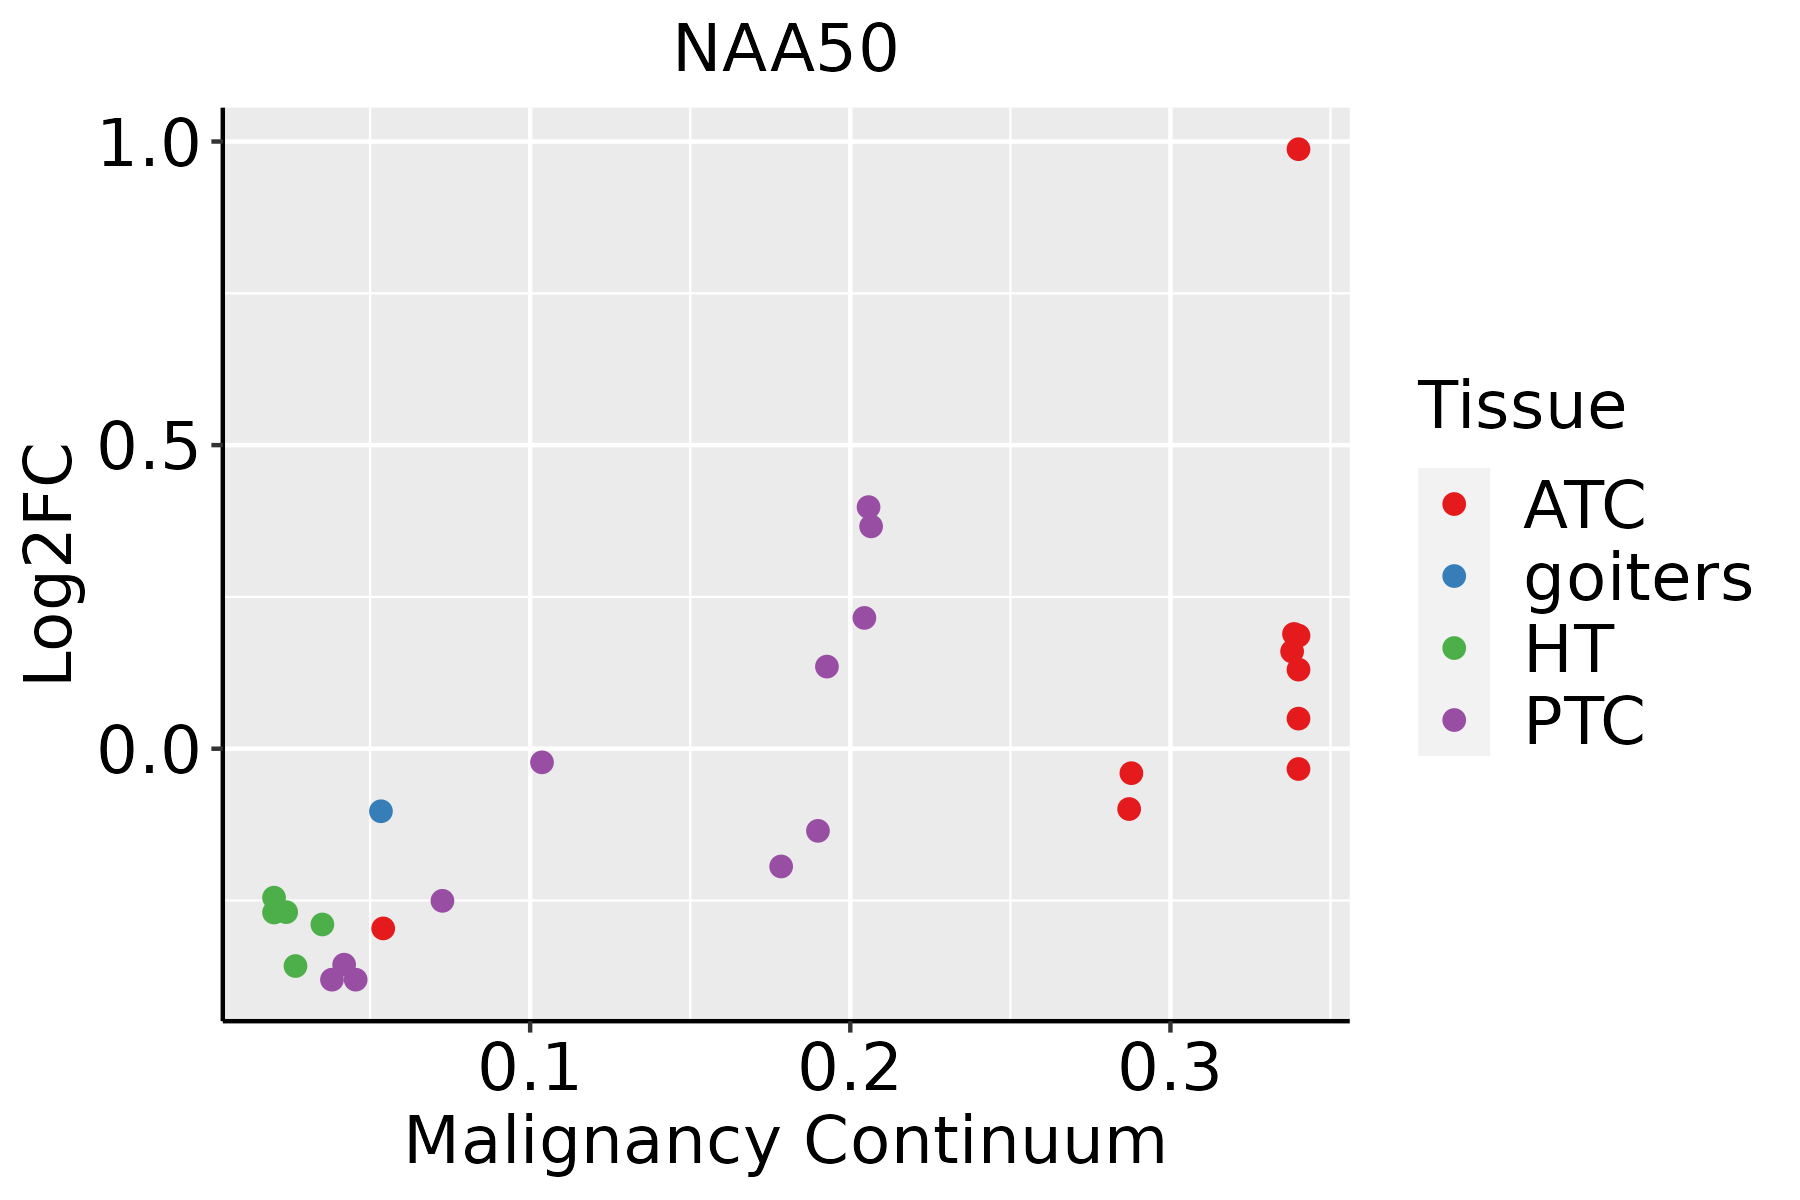 | ATC: Anaplastic thyroid cancer |
| HT: Hashimoto's thyroiditis | ||
| PTC: Papillary thyroid cancer |
| ∗log2FC in expression of this searched gene in stem-like cells from each diseased tissue sample relative to stem-like cells in normal samples in each tissue plotted against the malignancy continuum. Samples are colored based on if they are from different disease stage. |
Top |
Malignant transformation related pathway analysis |
| Find out the enriched GO biological processes and KEGG pathways involved in transition from healthy to precancer to cancer |
| Tissue | Disease Stage | Enriched GO biological Processes |
| Colorectum | AD |  |
| Colorectum | SER |  |
| Colorectum | MSS |  |
| Colorectum | MSI-H |  |
| Colorectum | FAP |  |
| ∗Top 15 enriched GO BP terms are showed in the bar plot of each disease state in each tissue. Each row represents a significant GO biological process which is colored according to the -log10(p.adjust). |
| Page: 1 2 3 4 5 6 7 8 9 |
| GO ID | Tissue | Disease Stage | Description | Gene Ratio | Bg Ratio | pvalue | p.adjust | Count |
| GO:00070646 | Cervix | CC | mitotic sister chromatid cohesion | 12/2311 | 28/18723 | 5.47e-05 | 8.06e-04 | 12 |
| GO:00165705 | Cervix | CC | histone modification | 84/2311 | 463/18723 | 1.70e-04 | 2.01e-03 | 84 |
| GO:00516048 | Cervix | CC | protein maturation | 56/2311 | 294/18723 | 5.90e-04 | 5.59e-03 | 56 |
| GO:01400143 | Cervix | CC | mitotic nuclear division | 50/2311 | 287/18723 | 7.27e-03 | 3.91e-02 | 50 |
| GO:00070625 | Cervix | CC | sister chromatid cohesion | 15/2311 | 62/18723 | 7.30e-03 | 3.92e-02 | 15 |
| GO:00482851 | Cervix | CC | organelle fission | 78/2311 | 488/18723 | 9.70e-03 | 4.79e-02 | 78 |
| GO:00182054 | Cervix | CC | peptidyl-lysine modification | 62/2311 | 376/18723 | 1.04e-02 | 4.97e-02 | 62 |
| GO:0051604 | Colorectum | AD | protein maturation | 85/3918 | 294/18723 | 6.73e-04 | 6.91e-03 | 85 |
| GO:0007064 | Colorectum | AD | mitotic sister chromatid cohesion | 13/3918 | 28/18723 | 2.22e-03 | 1.75e-02 | 13 |
| GO:0007062 | Colorectum | AD | sister chromatid cohesion | 23/3918 | 62/18723 | 2.51e-03 | 1.92e-02 | 23 |
| GO:0140014 | Colorectum | AD | mitotic nuclear division | 78/3918 | 287/18723 | 6.48e-03 | 4.05e-02 | 78 |
| GO:0016570 | Colorectum | MSS | histone modification | 113/3467 | 463/18723 | 8.37e-04 | 8.68e-03 | 113 |
| GO:00516042 | Colorectum | MSS | protein maturation | 75/3467 | 294/18723 | 1.70e-03 | 1.53e-02 | 75 |
| GO:00070621 | Colorectum | MSS | sister chromatid cohesion | 20/3467 | 62/18723 | 6.63e-03 | 4.38e-02 | 20 |
| GO:01400141 | Colorectum | MSS | mitotic nuclear division | 70/3467 | 287/18723 | 7.48e-03 | 4.72e-02 | 70 |
| GO:00070641 | Colorectum | MSS | mitotic sister chromatid cohesion | 11/3467 | 28/18723 | 8.30e-03 | 5.00e-02 | 11 |
| GO:00165701 | Colorectum | FAP | histone modification | 94/2622 | 463/18723 | 1.06e-04 | 1.76e-03 | 94 |
| GO:00070642 | Colorectum | FAP | mitotic sister chromatid cohesion | 11/2622 | 28/18723 | 8.55e-04 | 8.79e-03 | 11 |
| GO:00070622 | Colorectum | FAP | sister chromatid cohesion | 18/2622 | 62/18723 | 1.60e-03 | 1.42e-02 | 18 |
| GO:00165702 | Colorectum | CRC | histone modification | 75/2078 | 463/18723 | 4.95e-04 | 7.06e-03 | 75 |
| Page: 1 2 3 4 5 6 7 8 9 10 |
| Pathway ID | Tissue | Disease Stage | Description | Gene Ratio | Bg Ratio | pvalue | p.adjust | qvalue | Count |
| Page: 1 |
Top |
Cell-cell communication analysis |
| Identification of potential cell-cell interactions between two cell types and their ligand-receptor pairs for different disease states |
| Ligand | Receptor | LRpair | Pathway | Tissue | Disease Stage |
| Page: 1 |
Top |
Single-cell gene regulatory network inference analysis |
| Find out the significant the regulons (TFs) and the target genes of each regulon across cell types for different disease states |
| TF | Cell Type | Tissue | Disease Stage | Target Gene | RSS | Regulon Activity |
| ∗The dot plots of a searched regulon are shown for all cell subpopulations in each disease state of each tissue based on the regulon specific score inferred using pySCENIC and by calculating the average expression. |
| Page: 1 |
Top |
Somatic mutation of malignant transformation related genes |
| Annotation of somatic variants for genes involved in malignant transformation |
| Hugo Symbol | Variant Class | Variant Classification | dbSNP RS | HGVSc | HGVSp | HGVSp Short | SWISSPROT | BIOTYPE | SIFT | PolyPhen | Tumor Sample Barcode | Tissue | Histology | Sex | Age | Stage | Therapy Types | Drugs | Outcome |
| NAA50 | SNV | Missense_Mutation | rs777291080 | c.433G>A | p.Ala145Thr | p.A145T | Q9GZZ1 | protein_coding | tolerated(0.14) | benign(0.049) | TCGA-AR-A1AY-01 | Breast | breast invasive carcinoma | Female | >=65 | I/II | Unspecific | Doxorubicin | SD |
| NAA50 | SNV | Missense_Mutation | c.388N>C | p.Glu130Gln | p.E130Q | Q9GZZ1 | protein_coding | tolerated(0.07) | benign(0.01) | TCGA-IR-A3LH-01 | Cervix | cervical & endocervical cancer | Female | <65 | I/II | Chemotherapy | cisplatin | CR | |
| NAA50 | SNV | Missense_Mutation | novel | c.131N>G | p.Glu44Gly | p.E44G | Q9GZZ1 | protein_coding | deleterious(0) | benign(0.151) | TCGA-MA-AA42-01 | Cervix | cervical & endocervical cancer | Female | >=65 | I/II | Unknown | Unknown | SD |
| NAA50 | SNV | Missense_Mutation | c.74N>C | p.Val25Ala | p.V25A | Q9GZZ1 | protein_coding | tolerated(0.3) | benign(0.018) | TCGA-AA-3673-01 | Colorectum | colon adenocarcinoma | Female | <65 | I/II | Unknown | Unknown | SD | |
| NAA50 | SNV | Missense_Mutation | novel | c.405N>T | p.Lys135Asn | p.K135N | Q9GZZ1 | protein_coding | tolerated(0.21) | possibly_damaging(0.503) | TCGA-A5-A0G2-01 | Endometrium | uterine corpus endometrioid carcinoma | Female | <65 | III/IV | Unknown | Unknown | SD |
| NAA50 | SNV | Missense_Mutation | novel | c.301N>C | p.Glu101Gln | p.E101Q | Q9GZZ1 | protein_coding | tolerated(0.19) | benign(0.277) | TCGA-AX-A2H2-01 | Endometrium | uterine corpus endometrioid carcinoma | Female | >=65 | I/II | Unknown | Unknown | SD |
| NAA50 | SNV | Missense_Mutation | novel | c.153N>A | p.Phe51Leu | p.F51L | Q9GZZ1 | protein_coding | tolerated(0.1) | benign(0.067) | TCGA-EO-A22X-01 | Endometrium | uterine corpus endometrioid carcinoma | Female | <65 | III/IV | Unspecific | Carboplatin | Complete Response |
| NAA50 | SNV | Missense_Mutation | novel | c.334C>T | p.His112Tyr | p.H112Y | Q9GZZ1 | protein_coding | deleterious(0) | probably_damaging(1) | TCGA-FI-A2D6-01 | Endometrium | uterine corpus endometrioid carcinoma | Female | >=65 | I/II | Unknown | Unknown | SD |
| NAA50 | SNV | Missense_Mutation | rs763096981 | c.251G>A | p.Arg84Gln | p.R84Q | Q9GZZ1 | protein_coding | deleterious(0) | probably_damaging(1) | TCGA-94-7943-01 | Lung | lung squamous cell carcinoma | Male | >=65 | I/II | Unknown | Unknown | PD |
| NAA50 | SNV | Missense_Mutation | novel | c.236N>A | p.Cys79Tyr | p.C79Y | Q9GZZ1 | protein_coding | deleterious(0) | probably_damaging(0.993) | TCGA-XK-AAIW-01 | Prostate | prostate adenocarcinoma | Male | >=65 | 9 | Unknown | Unknown | PD |
| Page: 1 2 |
Top |
Related drugs of malignant transformation related genes |
| Identification of chemicals and drugs interact with genes involved in malignant transfromation |
| (DGIdb 4.0) |
| Entrez ID | Symbol | Category | Interaction Types | Drug Claim Name | Drug Name | PMIDs |
| Page: 1 |

Copyright 2023-Present -The University of Texas Health Science Center at Houston |