
|
|||||
|
 | |
| |
| |
| |
| |
| |
|
Gene: NAA40 |
Gene summary for NAA40 |
| Gene information | Species | Human | Gene symbol | NAA40 | Gene ID | 79829 |
| Gene name | N-alpha-acetyltransferase 40, NatD catalytic subunit | |
| Gene Alias | NAT11 | |
| Cytomap | 11q13.1 | |
| Gene Type | protein-coding | GO ID | GO:0006464 | UniProtAcc | Q86UY6 |
Top |
Malignant transformation analysis |
| Identification of the aberrant gene expression in precancerous and cancerous lesions by comparing the gene expression of stem-like cells in diseased tissues with normal stem cells |
| Entrez ID | Symbol | Replicates | Species | Organ | Tissue | Adj P-value | Log2FC | Malignancy |
| 79829 | NAA40 | LZE7T | Human | Esophagus | ESCC | 1.62e-02 | 1.58e-01 | 0.0667 |
| 79829 | NAA40 | LZE24T | Human | Esophagus | ESCC | 2.51e-02 | 6.14e-02 | 0.0596 |
| 79829 | NAA40 | P2T-E | Human | Esophagus | ESCC | 5.93e-15 | 2.20e-01 | 0.1177 |
| 79829 | NAA40 | P4T-E | Human | Esophagus | ESCC | 9.23e-14 | 2.78e-01 | 0.1323 |
| 79829 | NAA40 | P5T-E | Human | Esophagus | ESCC | 6.04e-03 | 6.27e-02 | 0.1327 |
| 79829 | NAA40 | P8T-E | Human | Esophagus | ESCC | 3.43e-06 | 9.99e-02 | 0.0889 |
| 79829 | NAA40 | P9T-E | Human | Esophagus | ESCC | 1.69e-03 | 4.94e-02 | 0.1131 |
| 79829 | NAA40 | P10T-E | Human | Esophagus | ESCC | 1.43e-06 | 1.02e-01 | 0.116 |
| 79829 | NAA40 | P11T-E | Human | Esophagus | ESCC | 1.02e-05 | 2.14e-01 | 0.1426 |
| 79829 | NAA40 | P12T-E | Human | Esophagus | ESCC | 1.10e-07 | 1.83e-01 | 0.1122 |
| 79829 | NAA40 | P15T-E | Human | Esophagus | ESCC | 2.60e-04 | 6.75e-02 | 0.1149 |
| 79829 | NAA40 | P16T-E | Human | Esophagus | ESCC | 4.35e-13 | 1.83e-01 | 0.1153 |
| 79829 | NAA40 | P20T-E | Human | Esophagus | ESCC | 5.14e-03 | 8.97e-02 | 0.1124 |
| 79829 | NAA40 | P21T-E | Human | Esophagus | ESCC | 1.56e-04 | 1.09e-01 | 0.1617 |
| 79829 | NAA40 | P22T-E | Human | Esophagus | ESCC | 5.56e-04 | 8.60e-02 | 0.1236 |
| 79829 | NAA40 | P23T-E | Human | Esophagus | ESCC | 4.43e-06 | 8.11e-02 | 0.108 |
| 79829 | NAA40 | P24T-E | Human | Esophagus | ESCC | 6.81e-05 | 6.49e-02 | 0.1287 |
| 79829 | NAA40 | P26T-E | Human | Esophagus | ESCC | 6.00e-07 | 1.60e-01 | 0.1276 |
| 79829 | NAA40 | P27T-E | Human | Esophagus | ESCC | 2.28e-11 | 1.71e-01 | 0.1055 |
| 79829 | NAA40 | P28T-E | Human | Esophagus | ESCC | 9.72e-14 | 2.69e-01 | 0.1149 |
| Page: 1 2 3 |
| Tissue | Expression Dynamics | Abbreviation |
| Esophagus | 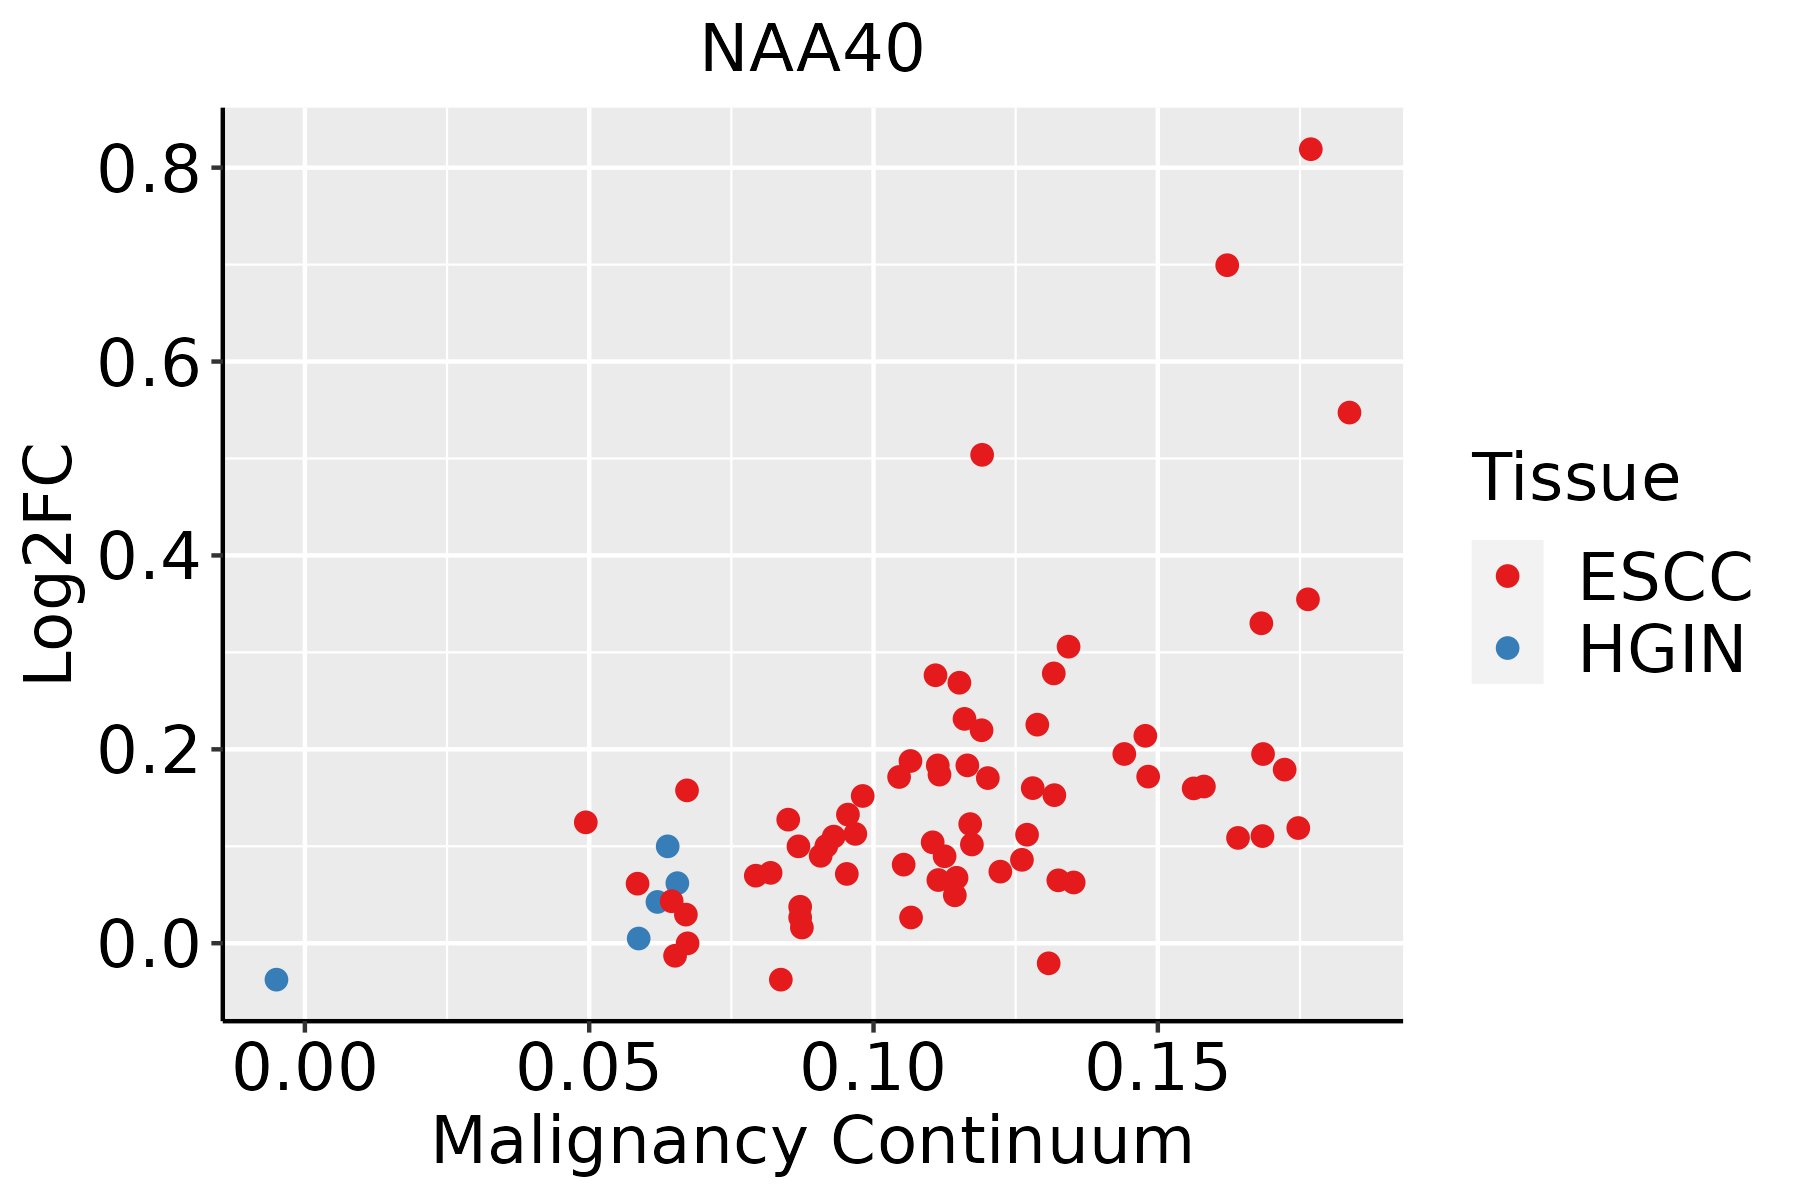 | ESCC: Esophageal squamous cell carcinoma |
| HGIN: High-grade intraepithelial neoplasias | ||
| LGIN: Low-grade intraepithelial neoplasias | ||
| Liver | 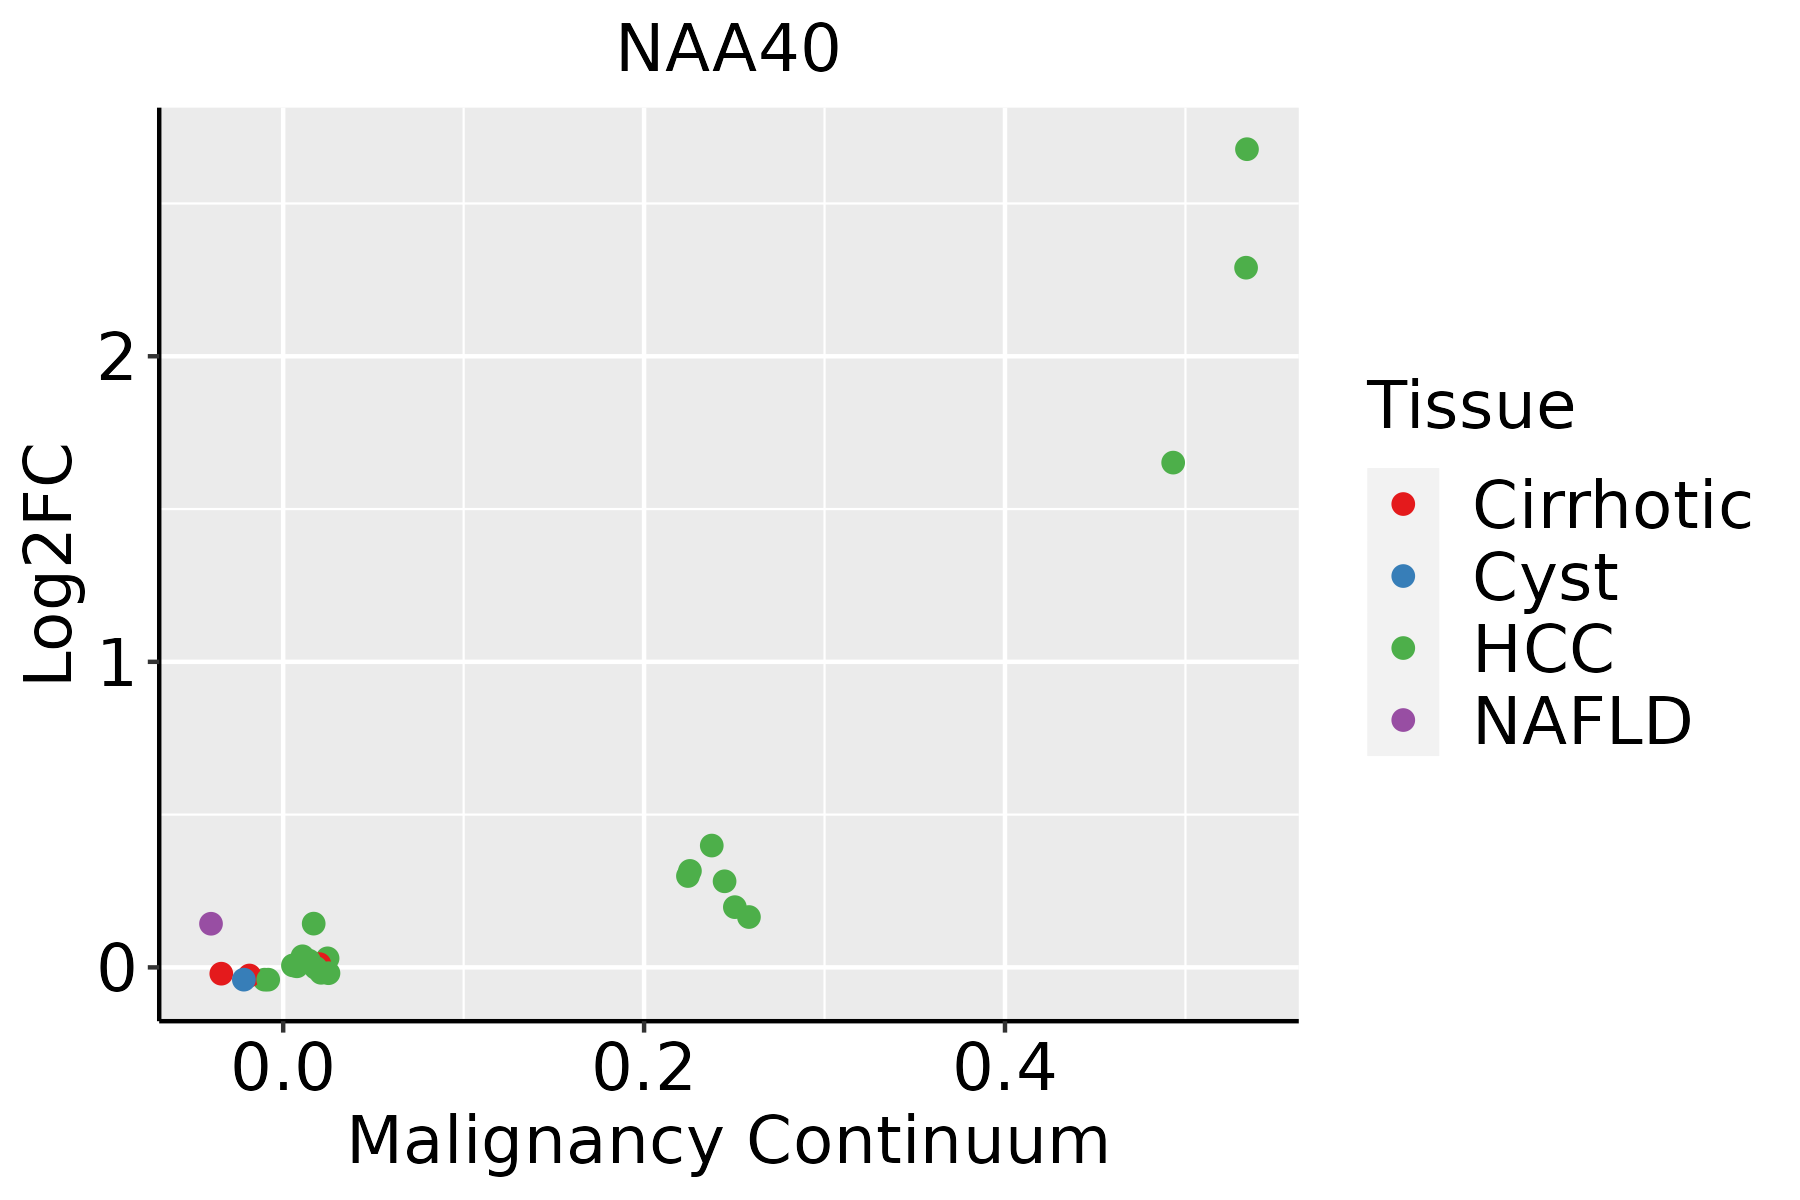 | HCC: Hepatocellular carcinoma |
| NAFLD: Non-alcoholic fatty liver disease |
| ∗log2FC in expression of this searched gene in stem-like cells from each diseased tissue sample relative to stem-like cells in normal samples in each tissue plotted against the malignancy continuum. Samples are colored based on if they are from different disease stage. |
Top |
Malignant transformation related pathway analysis |
| Find out the enriched GO biological processes and KEGG pathways involved in transition from healthy to precancer to cancer |
| Tissue | Disease Stage | Enriched GO biological Processes |
| Colorectum | AD |  |
| Colorectum | SER |  |
| Colorectum | MSS |  |
| Colorectum | MSI-H |  |
| Colorectum | FAP |  |
| ∗Top 15 enriched GO BP terms are showed in the bar plot of each disease state in each tissue. Each row represents a significant GO biological process which is colored according to the -log10(p.adjust). |
| Page: 1 2 3 4 5 6 7 8 9 |
| GO ID | Tissue | Disease Stage | Description | Gene Ratio | Bg Ratio | pvalue | p.adjust | Count |
| GO:001657015 | Esophagus | ESCC | histone modification | 323/8552 | 463/18723 | 2.61e-26 | 7.88e-24 | 323 |
| GO:001820514 | Esophagus | ESCC | peptidyl-lysine modification | 259/8552 | 376/18723 | 3.90e-20 | 5.26e-18 | 259 |
| GO:001839413 | Esophagus | ESCC | peptidyl-lysine acetylation | 123/8552 | 169/18723 | 6.58e-13 | 2.94e-11 | 123 |
| GO:004354313 | Esophagus | ESCC | protein acylation | 165/8552 | 243/18723 | 1.69e-12 | 7.14e-11 | 165 |
| GO:000647313 | Esophagus | ESCC | protein acetylation | 140/8552 | 201/18723 | 4.37e-12 | 1.69e-10 | 140 |
| GO:001839313 | Esophagus | ESCC | internal peptidyl-lysine acetylation | 114/8552 | 158/18723 | 1.16e-11 | 4.24e-10 | 114 |
| GO:000647513 | Esophagus | ESCC | internal protein amino acid acetylation | 115/8552 | 160/18723 | 1.43e-11 | 5.08e-10 | 115 |
| GO:00165735 | Esophagus | ESCC | histone acetylation | 110/8552 | 152/18723 | 1.95e-11 | 6.81e-10 | 110 |
| GO:005160418 | Esophagus | ESCC | protein maturation | 189/8552 | 294/18723 | 7.64e-11 | 2.39e-09 | 189 |
| GO:004396712 | Esophagus | ESCC | histone H4 acetylation | 53/8552 | 67/18723 | 2.11e-08 | 4.03e-07 | 53 |
| GO:00439682 | Esophagus | ESCC | histone H2A acetylation | 15/8552 | 17/18723 | 3.48e-04 | 2.03e-03 | 15 |
| GO:0031365 | Esophagus | ESCC | N-terminal protein amino acid modification | 21/8552 | 30/18723 | 6.17e-03 | 2.27e-02 | 21 |
| GO:0006474 | Esophagus | ESCC | N-terminal protein amino acid acetylation | 13/8552 | 17/18723 | 1.00e-02 | 3.42e-02 | 13 |
| GO:001657021 | Liver | HCC | histone modification | 283/7958 | 463/18723 | 2.68e-16 | 2.33e-14 | 283 |
| GO:00182052 | Liver | HCC | peptidyl-lysine modification | 230/7958 | 376/18723 | 1.51e-13 | 8.32e-12 | 230 |
| GO:00064732 | Liver | HCC | protein acetylation | 135/7958 | 201/18723 | 1.20e-12 | 5.92e-11 | 135 |
| GO:00435432 | Liver | HCC | protein acylation | 157/7958 | 243/18723 | 2.40e-12 | 1.12e-10 | 157 |
| GO:00183942 | Liver | HCC | peptidyl-lysine acetylation | 116/7958 | 169/18723 | 5.11e-12 | 2.23e-10 | 116 |
| GO:00064752 | Liver | HCC | internal protein amino acid acetylation | 107/7958 | 160/18723 | 3.77e-10 | 1.23e-08 | 107 |
| GO:00183932 | Liver | HCC | internal peptidyl-lysine acetylation | 105/7958 | 158/18723 | 9.48e-10 | 2.90e-08 | 105 |
| Page: 1 2 |
| Pathway ID | Tissue | Disease Stage | Description | Gene Ratio | Bg Ratio | pvalue | p.adjust | qvalue | Count |
| Page: 1 |
Top |
Cell-cell communication analysis |
| Identification of potential cell-cell interactions between two cell types and their ligand-receptor pairs for different disease states |
| Ligand | Receptor | LRpair | Pathway | Tissue | Disease Stage |
| Page: 1 |
Top |
Single-cell gene regulatory network inference analysis |
| Find out the significant the regulons (TFs) and the target genes of each regulon across cell types for different disease states |
| TF | Cell Type | Tissue | Disease Stage | Target Gene | RSS | Regulon Activity |
| ∗The dot plots of a searched regulon are shown for all cell subpopulations in each disease state of each tissue based on the regulon specific score inferred using pySCENIC and by calculating the average expression. |
| Page: 1 |
Top |
Somatic mutation of malignant transformation related genes |
| Annotation of somatic variants for genes involved in malignant transformation |
| Hugo Symbol | Variant Class | Variant Classification | dbSNP RS | HGVSc | HGVSp | HGVSp Short | SWISSPROT | BIOTYPE | SIFT | PolyPhen | Tumor Sample Barcode | Tissue | Histology | Sex | Age | Stage | Therapy Types | Drugs | Outcome |
| NAA40 | insertion | In_Frame_Ins | novel | c.56_57insCTGTCTCCTCCCTGAAGCGGTCTTCAGTGTGTCTAA | p.Arg19_Ala20insCysLeuLeuProGluAlaValPheSerValSerLys | p.R19_A20insCLLPEAVFSVSK | Q86UY6 | protein_coding | TCGA-B6-A0IN-01 | Breast | breast invasive carcinoma | Female | <65 | I/II | Unknown | Unknown | PD | ||
| NAA40 | SNV | Missense_Mutation | c.628N>C | p.Ser210Pro | p.S210P | Q86UY6 | protein_coding | tolerated(0.13) | benign(0.202) | TCGA-EA-A6QX-01 | Cervix | cervical & endocervical cancer | Female | <65 | III/IV | Unknown | Unknown | SD | |
| NAA40 | SNV | Missense_Mutation | c.329T>C | p.Ile110Thr | p.I110T | Q86UY6 | protein_coding | deleterious(0) | possibly_damaging(0.583) | TCGA-F4-6459-01 | Colorectum | colon adenocarcinoma | Female | <65 | III/IV | Unknown | Unknown | SD | |
| NAA40 | SNV | Missense_Mutation | c.614G>T | p.Cys205Phe | p.C205F | Q86UY6 | protein_coding | tolerated(0.31) | possibly_damaging(0.648) | TCGA-AG-3727-01 | Colorectum | rectum adenocarcinoma | Female | >=65 | III/IV | Unknown | Unknown | SD | |
| NAA40 | SNV | Missense_Mutation | rs780326108 | c.284N>A | p.Arg95Gln | p.R95Q | Q86UY6 | protein_coding | tolerated(0.21) | possibly_damaging(0.778) | TCGA-A5-A0G2-01 | Endometrium | uterine corpus endometrioid carcinoma | Female | <65 | III/IV | Unknown | Unknown | SD |
| NAA40 | SNV | Missense_Mutation | novel | c.668N>T | p.Ser223Ile | p.S223I | Q86UY6 | protein_coding | deleterious_low_confidence(0.02) | benign(0.119) | TCGA-A5-A2K5-01 | Endometrium | uterine corpus endometrioid carcinoma | Female | >=65 | I/II | Unknown | Unknown | SD |
| NAA40 | SNV | Missense_Mutation | rs745329285 | c.223N>A | p.Asp75Asn | p.D75N | Q86UY6 | protein_coding | tolerated(0.14) | benign(0.006) | TCGA-AX-A05Z-01 | Endometrium | uterine corpus endometrioid carcinoma | Female | <65 | III/IV | Chemotherapy | adriamycin | SD |
| NAA40 | SNV | Missense_Mutation | c.288N>T | p.Glu96Asp | p.E96D | Q86UY6 | protein_coding | tolerated(0.23) | possibly_damaging(0.628) | TCGA-AX-A05Z-01 | Endometrium | uterine corpus endometrioid carcinoma | Female | <65 | III/IV | Chemotherapy | adriamycin | SD | |
| NAA40 | SNV | Missense_Mutation | rs776573148 | c.332C>T | p.Ala111Val | p.A111V | Q86UY6 | protein_coding | tolerated(0.1) | possibly_damaging(0.816) | TCGA-AX-A0J1-01 | Endometrium | uterine corpus endometrioid carcinoma | Female | >=65 | I/II | Unknown | Unknown | SD |
| NAA40 | SNV | Missense_Mutation | novel | c.314G>A | p.Arg105Gln | p.R105Q | Q86UY6 | protein_coding | tolerated(0.21) | benign(0.074) | TCGA-BG-A3EW-01 | Endometrium | uterine corpus endometrioid carcinoma | Female | <65 | III/IV | Unknown | Unknown | SD |
| Page: 1 2 |
Top |
Related drugs of malignant transformation related genes |
| Identification of chemicals and drugs interact with genes involved in malignant transfromation |
| (DGIdb 4.0) |
| Entrez ID | Symbol | Category | Interaction Types | Drug Claim Name | Drug Name | PMIDs |
| Page: 1 |

Copyright 2023-Present -The University of Texas Health Science Center at Houston |