
|
|||||
|
 | |
| |
| |
| |
| |
| |
|
Gene: NAA35 |
Gene summary for NAA35 |
| Gene information | Species | Human | Gene symbol | NAA35 | Gene ID | 60560 |
| Gene name | N-alpha-acetyltransferase 35, NatC auxiliary subunit | |
| Gene Alias | EGAP | |
| Cytomap | 9q21.33 | |
| Gene Type | protein-coding | GO ID | GO:0006464 | UniProtAcc | A8K874 |
Top |
Malignant transformation analysis |
| Identification of the aberrant gene expression in precancerous and cancerous lesions by comparing the gene expression of stem-like cells in diseased tissues with normal stem cells |
| Entrez ID | Symbol | Replicates | Species | Organ | Tissue | Adj P-value | Log2FC | Malignancy |
| 60560 | NAA35 | CA_HPV_1 | Human | Cervix | CC | 2.30e-02 | -1.29e-01 | 0.0264 |
| 60560 | NAA35 | CCI_2 | Human | Cervix | CC | 3.82e-13 | 1.14e+00 | 0.5249 |
| 60560 | NAA35 | CCI_3 | Human | Cervix | CC | 1.43e-11 | 7.46e-01 | 0.516 |
| 60560 | NAA35 | LZE4T | Human | Esophagus | ESCC | 5.77e-11 | 1.66e-01 | 0.0811 |
| 60560 | NAA35 | LZE8T | Human | Esophagus | ESCC | 1.38e-04 | 9.60e-02 | 0.067 |
| 60560 | NAA35 | LZE22T | Human | Esophagus | ESCC | 8.12e-05 | 2.31e-01 | 0.068 |
| 60560 | NAA35 | LZE24T | Human | Esophagus | ESCC | 2.82e-14 | 1.87e-01 | 0.0596 |
| 60560 | NAA35 | P2T-E | Human | Esophagus | ESCC | 1.14e-26 | 3.68e-01 | 0.1177 |
| 60560 | NAA35 | P4T-E | Human | Esophagus | ESCC | 4.22e-06 | 9.19e-02 | 0.1323 |
| 60560 | NAA35 | P5T-E | Human | Esophagus | ESCC | 1.52e-05 | 2.55e-02 | 0.1327 |
| 60560 | NAA35 | P8T-E | Human | Esophagus | ESCC | 4.50e-06 | 8.54e-02 | 0.0889 |
| 60560 | NAA35 | P9T-E | Human | Esophagus | ESCC | 4.03e-06 | 1.67e-01 | 0.1131 |
| 60560 | NAA35 | P10T-E | Human | Esophagus | ESCC | 1.02e-13 | 2.16e-01 | 0.116 |
| 60560 | NAA35 | P11T-E | Human | Esophagus | ESCC | 5.12e-08 | 2.17e-01 | 0.1426 |
| 60560 | NAA35 | P12T-E | Human | Esophagus | ESCC | 1.27e-12 | 1.71e-01 | 0.1122 |
| 60560 | NAA35 | P15T-E | Human | Esophagus | ESCC | 2.16e-12 | 1.48e-01 | 0.1149 |
| 60560 | NAA35 | P16T-E | Human | Esophagus | ESCC | 2.48e-08 | 1.57e-01 | 0.1153 |
| 60560 | NAA35 | P17T-E | Human | Esophagus | ESCC | 5.80e-03 | 8.58e-02 | 0.1278 |
| 60560 | NAA35 | P19T-E | Human | Esophagus | ESCC | 4.02e-02 | 1.78e-01 | 0.1662 |
| 60560 | NAA35 | P20T-E | Human | Esophagus | ESCC | 1.59e-08 | 1.34e-01 | 0.1124 |
| Page: 1 2 3 4 5 |
| Tissue | Expression Dynamics | Abbreviation |
| Cervix | 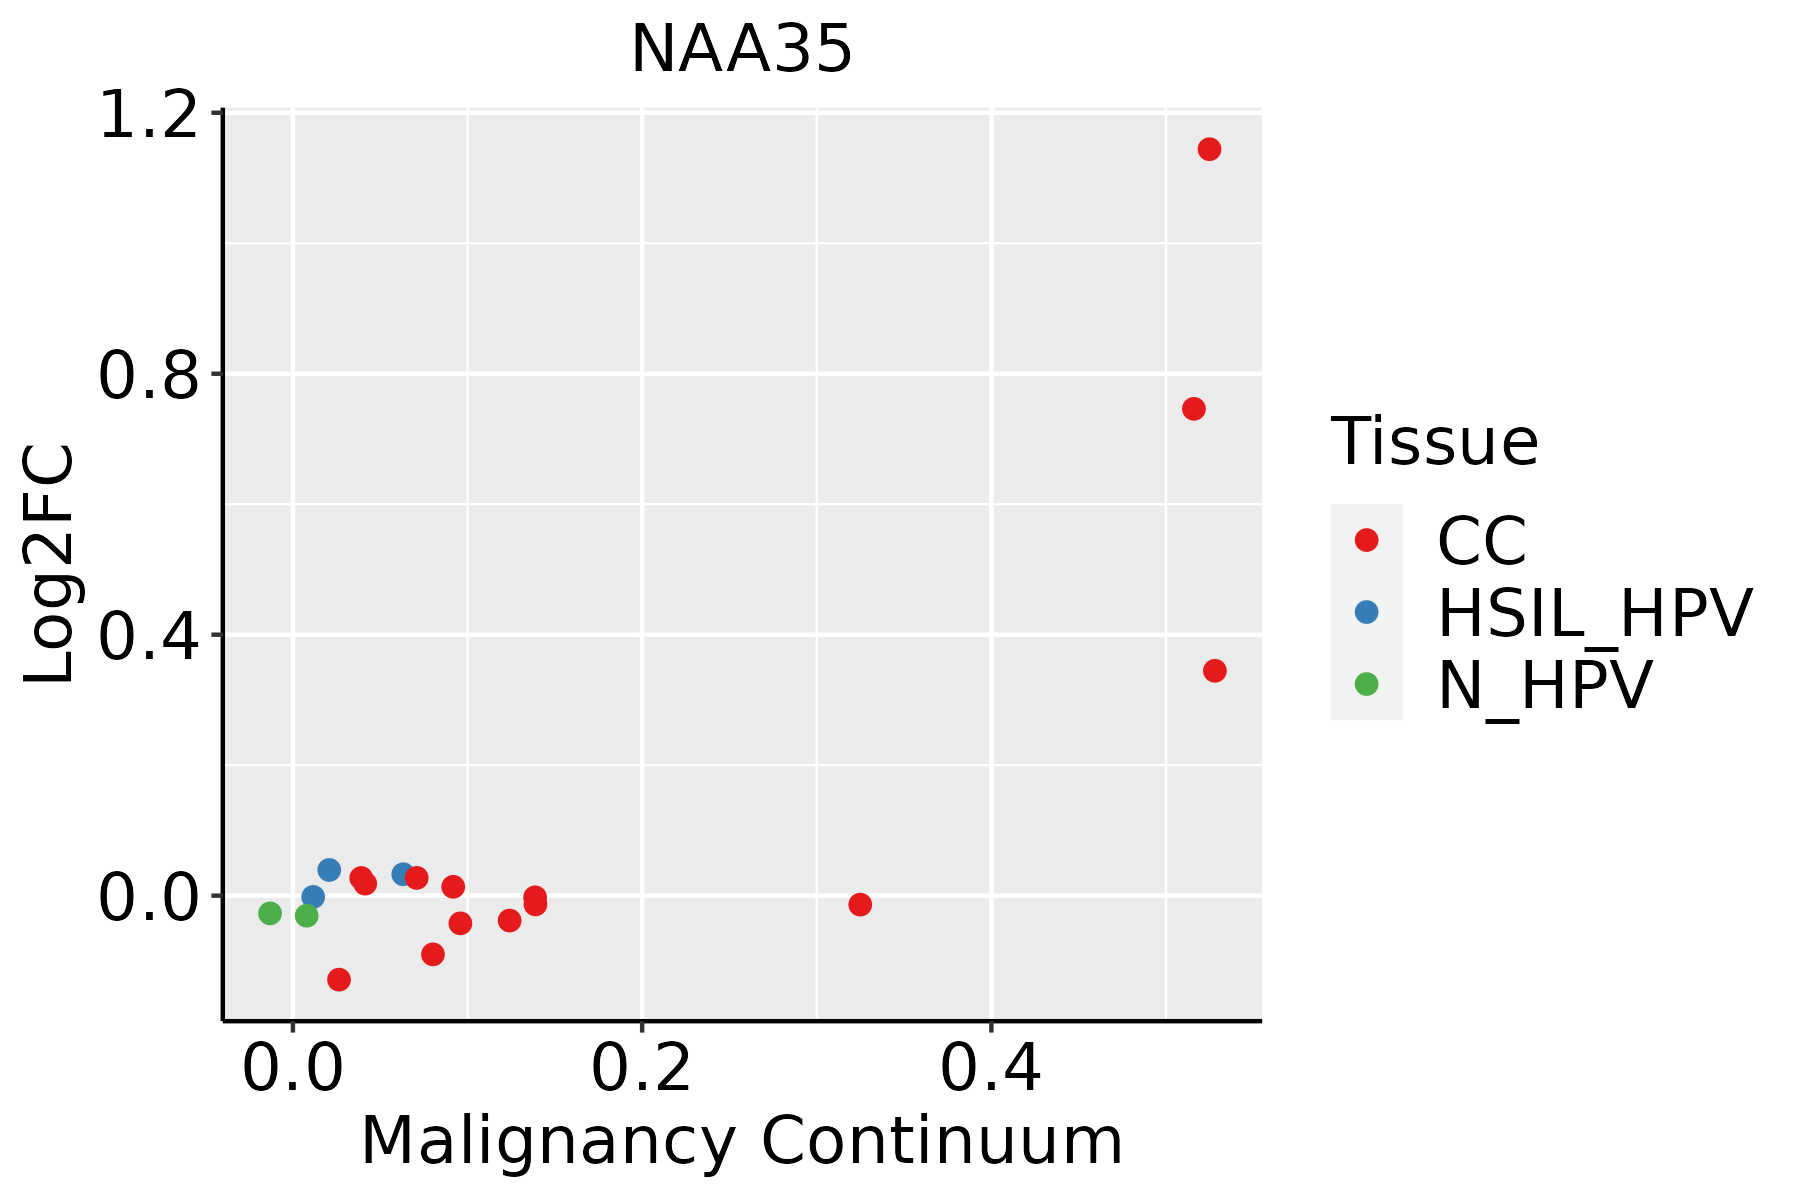 | CC: Cervix cancer |
| HSIL_HPV: HPV-infected high-grade squamous intraepithelial lesions | ||
| N_HPV: HPV-infected normal cervix | ||
| Esophagus | 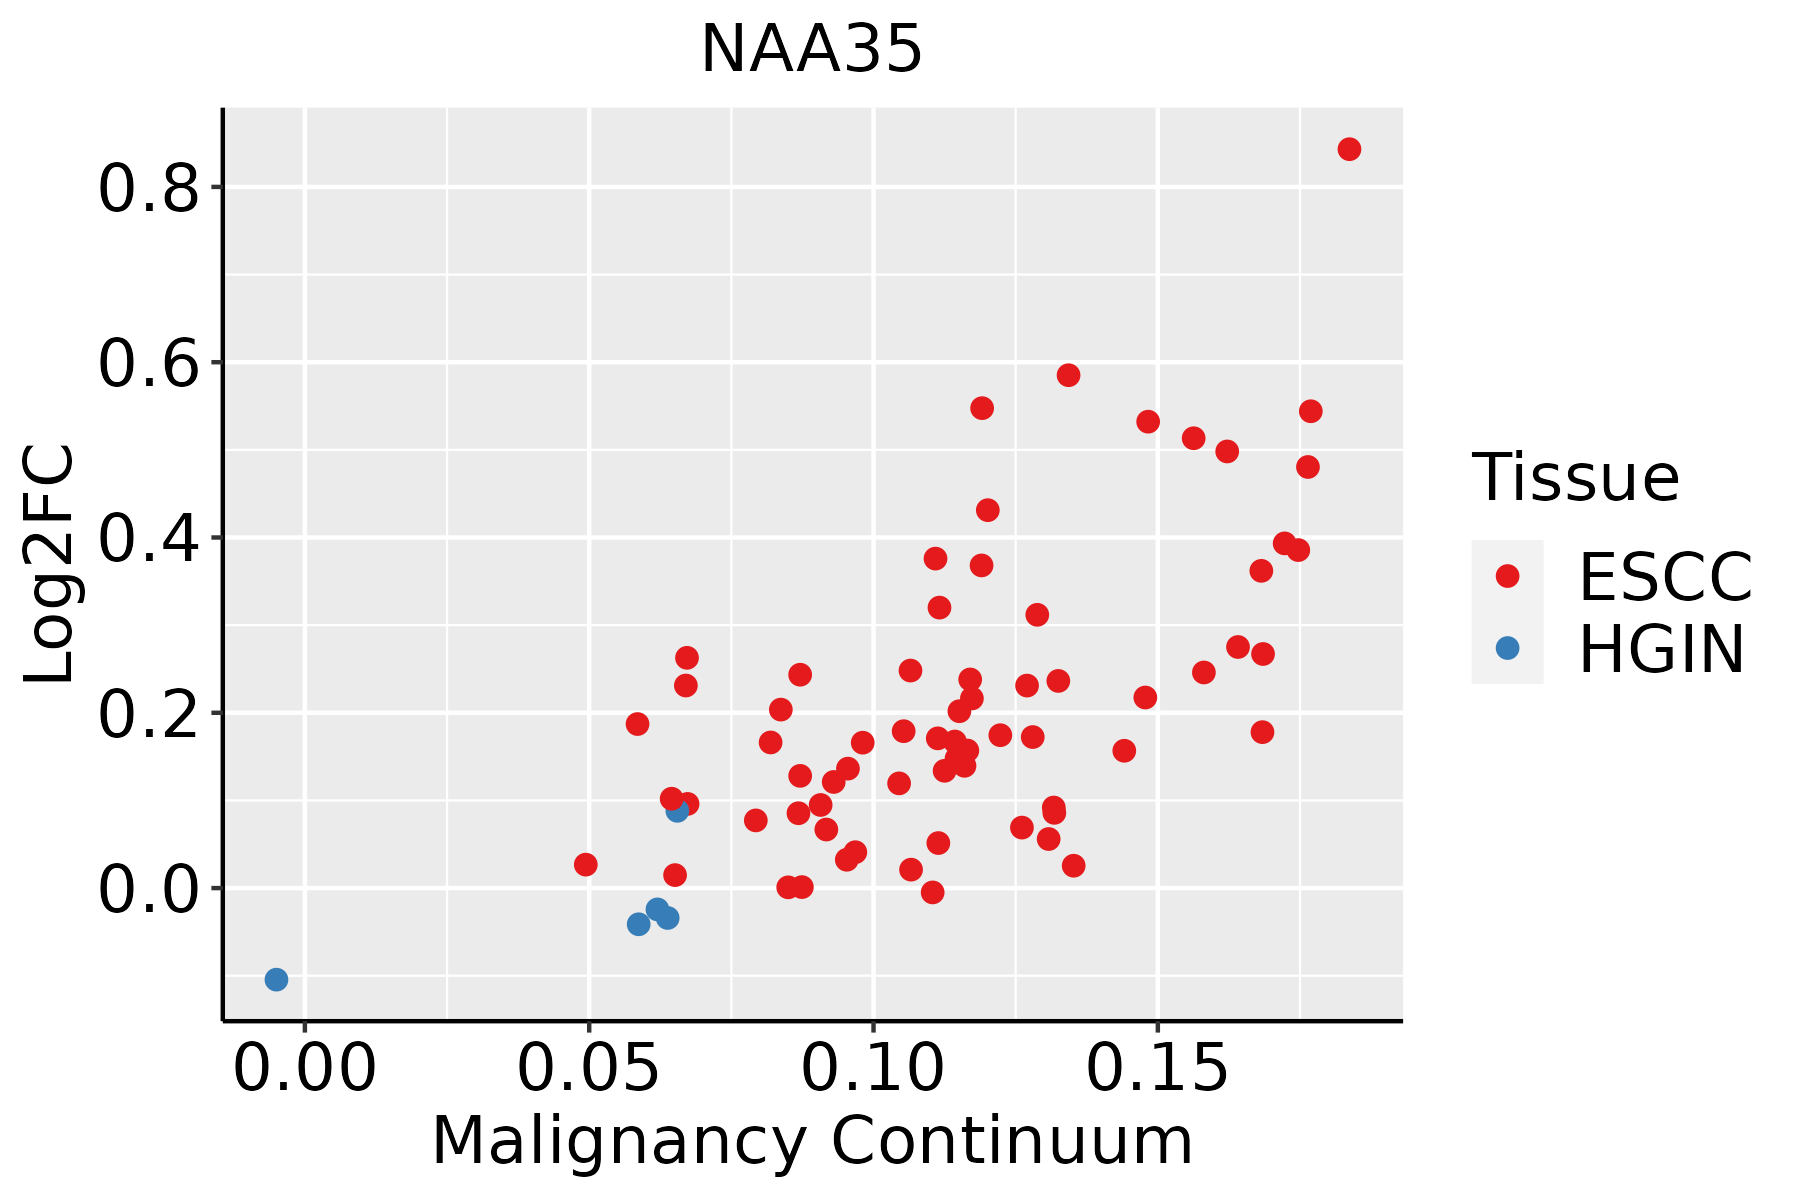 | ESCC: Esophageal squamous cell carcinoma |
| HGIN: High-grade intraepithelial neoplasias | ||
| LGIN: Low-grade intraepithelial neoplasias | ||
| Oral Cavity |  | EOLP: Erosive Oral lichen planus |
| LP: leukoplakia | ||
| NEOLP: Non-erosive oral lichen planus | ||
| OSCC: Oral squamous cell carcinoma | ||
| Skin | 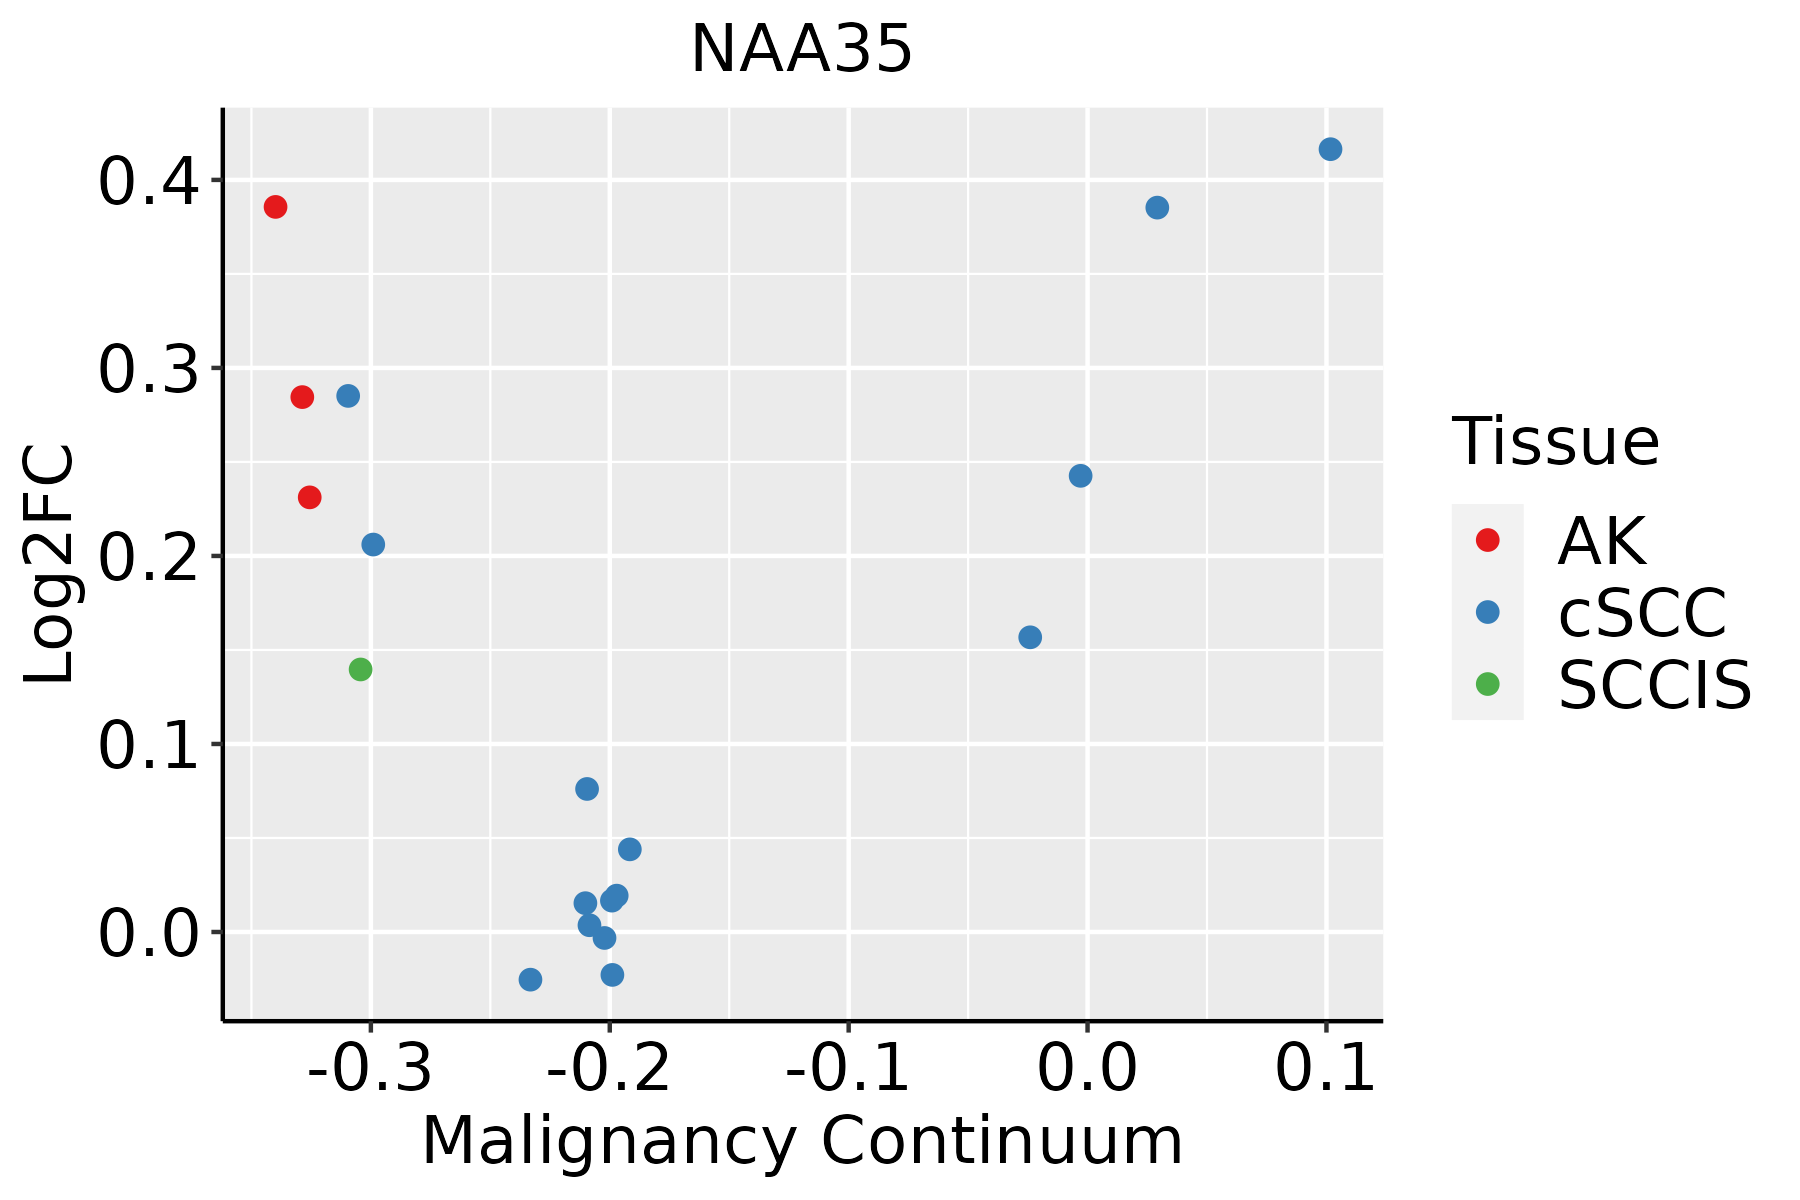 | AK: Actinic keratosis |
| cSCC: Cutaneous squamous cell carcinoma | ||
| SCCIS:squamous cell carcinoma in situ | ||
| Thyroid |  | ATC: Anaplastic thyroid cancer |
| HT: Hashimoto's thyroiditis | ||
| PTC: Papillary thyroid cancer |
| ∗log2FC in expression of this searched gene in stem-like cells from each diseased tissue sample relative to stem-like cells in normal samples in each tissue plotted against the malignancy continuum. Samples are colored based on if they are from different disease stage. |
Top |
Malignant transformation related pathway analysis |
| Find out the enriched GO biological processes and KEGG pathways involved in transition from healthy to precancer to cancer |
| Tissue | Disease Stage | Enriched GO biological Processes |
| Colorectum | AD |  |
| Colorectum | SER |  |
| Colorectum | MSS |  |
| Colorectum | MSI-H |  |
| Colorectum | FAP |  |
| ∗Top 15 enriched GO BP terms are showed in the bar plot of each disease state in each tissue. Each row represents a significant GO biological process which is colored according to the -log10(p.adjust). |
| Page: 1 2 3 4 5 6 7 8 9 |
| GO ID | Tissue | Disease Stage | Description | Gene Ratio | Bg Ratio | pvalue | p.adjust | Count |
| GO:0033002 | Cervix | CC | muscle cell proliferation | 49/2311 | 248/18723 | 5.43e-04 | 5.24e-03 | 49 |
| GO:00516048 | Cervix | CC | protein maturation | 56/2311 | 294/18723 | 5.90e-04 | 5.59e-03 | 56 |
| GO:00486593 | Cervix | CC | smooth muscle cell proliferation | 36/2311 | 184/18723 | 3.27e-03 | 2.13e-02 | 36 |
| GO:004354313 | Esophagus | ESCC | protein acylation | 165/8552 | 243/18723 | 1.69e-12 | 7.14e-11 | 165 |
| GO:000647313 | Esophagus | ESCC | protein acetylation | 140/8552 | 201/18723 | 4.37e-12 | 1.69e-10 | 140 |
| GO:005160418 | Esophagus | ESCC | protein maturation | 189/8552 | 294/18723 | 7.64e-11 | 2.39e-09 | 189 |
| GO:00182061 | Esophagus | ESCC | peptidyl-methionine modification | 12/8552 | 13/18723 | 6.18e-04 | 3.32e-03 | 12 |
| GO:00486597 | Esophagus | ESCC | smooth muscle cell proliferation | 103/8552 | 184/18723 | 3.08e-03 | 1.28e-02 | 103 |
| GO:00330025 | Esophagus | ESCC | muscle cell proliferation | 134/8552 | 248/18723 | 4.80e-03 | 1.86e-02 | 134 |
| GO:0031365 | Esophagus | ESCC | N-terminal protein amino acid modification | 21/8552 | 30/18723 | 6.17e-03 | 2.27e-02 | 21 |
| GO:0006474 | Esophagus | ESCC | N-terminal protein amino acid acetylation | 13/8552 | 17/18723 | 1.00e-02 | 3.42e-02 | 13 |
| GO:00435434 | Oral cavity | OSCC | protein acylation | 149/7305 | 243/18723 | 1.33e-12 | 5.80e-11 | 149 |
| GO:005160410 | Oral cavity | OSCC | protein maturation | 170/7305 | 294/18723 | 3.97e-11 | 1.28e-09 | 170 |
| GO:00064734 | Oral cavity | OSCC | protein acetylation | 124/7305 | 201/18723 | 5.59e-11 | 1.74e-09 | 124 |
| GO:00486596 | Oral cavity | OSCC | smooth muscle cell proliferation | 89/7305 | 184/18723 | 5.95e-03 | 2.27e-02 | 89 |
| GO:00330024 | Oral cavity | OSCC | muscle cell proliferation | 115/7305 | 248/18723 | 1.05e-02 | 3.58e-02 | 115 |
| GO:003300212 | Oral cavity | EOLP | muscle cell proliferation | 56/2218 | 248/18723 | 1.25e-06 | 3.00e-05 | 56 |
| GO:004865915 | Oral cavity | EOLP | smooth muscle cell proliferation | 44/2218 | 184/18723 | 3.47e-06 | 7.48e-05 | 44 |
| GO:004354321 | Oral cavity | EOLP | protein acylation | 51/2218 | 243/18723 | 3.11e-05 | 4.41e-04 | 51 |
| GO:000647321 | Oral cavity | EOLP | protein acetylation | 44/2218 | 201/18723 | 3.69e-05 | 5.12e-04 | 44 |
| Page: 1 2 |
| Pathway ID | Tissue | Disease Stage | Description | Gene Ratio | Bg Ratio | pvalue | p.adjust | qvalue | Count |
| Page: 1 |
Top |
Cell-cell communication analysis |
| Identification of potential cell-cell interactions between two cell types and their ligand-receptor pairs for different disease states |
| Ligand | Receptor | LRpair | Pathway | Tissue | Disease Stage |
| Page: 1 |
Top |
Single-cell gene regulatory network inference analysis |
| Find out the significant the regulons (TFs) and the target genes of each regulon across cell types for different disease states |
| TF | Cell Type | Tissue | Disease Stage | Target Gene | RSS | Regulon Activity |
| ∗The dot plots of a searched regulon are shown for all cell subpopulations in each disease state of each tissue based on the regulon specific score inferred using pySCENIC and by calculating the average expression. |
| Page: 1 |
Top |
Somatic mutation of malignant transformation related genes |
| Annotation of somatic variants for genes involved in malignant transformation |
| Hugo Symbol | Variant Class | Variant Classification | dbSNP RS | HGVSc | HGVSp | HGVSp Short | SWISSPROT | BIOTYPE | SIFT | PolyPhen | Tumor Sample Barcode | Tissue | Histology | Sex | Age | Stage | Therapy Types | Drugs | Outcome |
| NAA35 | SNV | Missense_Mutation | novel | c.1520N>A | p.Gly507Asp | p.G507D | Q5VZE5 | protein_coding | deleterious(0) | probably_damaging(0.998) | TCGA-AN-A046-01 | Breast | breast invasive carcinoma | Female | >=65 | I/II | Unknown | Unknown | SD |
| NAA35 | SNV | Missense_Mutation | c.1795N>T | p.Asp599Tyr | p.D599Y | Q5VZE5 | protein_coding | deleterious(0) | possibly_damaging(0.907) | TCGA-E9-A22E-01 | Breast | breast invasive carcinoma | Female | <65 | III/IV | Chemotherapy | cyclophosphane | SD | |
| NAA35 | SNV | Missense_Mutation | c.1951N>G | p.Gln651Glu | p.Q651E | Q5VZE5 | protein_coding | tolerated(1) | benign(0.001) | TCGA-IR-A3LA-01 | Cervix | cervical & endocervical cancer | Female | <65 | I/II | Chemotherapy | cisplatin | CR | |
| NAA35 | SNV | Missense_Mutation | c.1307N>G | p.Ile436Ser | p.I436S | Q5VZE5 | protein_coding | deleterious(0.01) | possibly_damaging(0.68) | TCGA-A6-5665-01 | Colorectum | colon adenocarcinoma | Female | >=65 | I/II | Unknown | Unknown | PD | |
| NAA35 | SNV | Missense_Mutation | rs138043991 | c.1288N>T | p.Arg430Trp | p.R430W | Q5VZE5 | protein_coding | deleterious(0) | probably_damaging(0.948) | TCGA-AA-3510-01 | Colorectum | colon adenocarcinoma | Male | >=65 | I/II | Unknown | Unknown | SD |
| NAA35 | SNV | Missense_Mutation | c.250N>A | p.Leu84Ile | p.L84I | Q5VZE5 | protein_coding | tolerated(0.17) | benign(0.406) | TCGA-AA-3977-01 | Colorectum | colon adenocarcinoma | Male | >=65 | I/II | Unknown | Unknown | SD | |
| NAA35 | SNV | Missense_Mutation | rs776821188 | c.1889C>T | p.Pro630Leu | p.P630L | Q5VZE5 | protein_coding | deleterious(0) | benign(0.301) | TCGA-AD-5900-01 | Colorectum | colon adenocarcinoma | Male | >=65 | I/II | Unknown | Unknown | SD |
| NAA35 | SNV | Missense_Mutation | c.242G>A | p.Arg81Gln | p.R81Q | Q5VZE5 | protein_coding | tolerated(0.1) | benign(0.152) | TCGA-CA-6717-01 | Colorectum | colon adenocarcinoma | Male | <65 | I/II | Chemotherapy | oxaliplatin | CR | |
| NAA35 | SNV | Missense_Mutation | c.1709N>A | p.Arg570His | p.R570H | Q5VZE5 | protein_coding | tolerated(0.08) | benign(0.125) | TCGA-CM-6162-01 | Colorectum | colon adenocarcinoma | Female | <65 | III/IV | Chemotherapy | oxaliplatin | SD | |
| NAA35 | SNV | Missense_Mutation | c.434C>T | p.Ala145Val | p.A145V | Q5VZE5 | protein_coding | tolerated(1) | benign(0.023) | TCGA-G4-6309-01 | Colorectum | colon adenocarcinoma | Female | <65 | III/IV | Chemotherapy | xeloda | PD |
| Page: 1 2 3 4 5 6 7 8 |
Top |
Related drugs of malignant transformation related genes |
| Identification of chemicals and drugs interact with genes involved in malignant transfromation |
| (DGIdb 4.0) |
| Entrez ID | Symbol | Category | Interaction Types | Drug Claim Name | Drug Name | PMIDs |
| Page: 1 |

Copyright 2023-Present -The University of Texas Health Science Center at Houston |