
|
|||||
|
 | |
| |
| |
| |
| |
| |
|
Gene: NAA30 |
Gene summary for NAA30 |
| Gene information | Species | Human | Gene symbol | NAA30 | Gene ID | 122830 |
| Gene name | N-alpha-acetyltransferase 30, NatC catalytic subunit | |
| Gene Alias | C14orf35 | |
| Cytomap | 14q22.3 | |
| Gene Type | protein-coding | GO ID | GO:0006464 | UniProtAcc | B3KS28 |
Top |
Malignant transformation analysis |
| Identification of the aberrant gene expression in precancerous and cancerous lesions by comparing the gene expression of stem-like cells in diseased tissues with normal stem cells |
| Entrez ID | Symbol | Replicates | Species | Organ | Tissue | Adj P-value | Log2FC | Malignancy |
| 122830 | NAA30 | LZE4T | Human | Esophagus | ESCC | 2.27e-08 | 1.89e-01 | 0.0811 |
| 122830 | NAA30 | LZE20T | Human | Esophagus | ESCC | 1.09e-06 | 2.30e-01 | 0.0662 |
| 122830 | NAA30 | LZE24T | Human | Esophagus | ESCC | 5.06e-14 | 3.62e-01 | 0.0596 |
| 122830 | NAA30 | P1T-E | Human | Esophagus | ESCC | 3.00e-02 | 1.59e-01 | 0.0875 |
| 122830 | NAA30 | P2T-E | Human | Esophagus | ESCC | 1.22e-22 | 2.60e-01 | 0.1177 |
| 122830 | NAA30 | P4T-E | Human | Esophagus | ESCC | 9.28e-22 | 3.50e-01 | 0.1323 |
| 122830 | NAA30 | P5T-E | Human | Esophagus | ESCC | 5.63e-10 | 1.88e-01 | 0.1327 |
| 122830 | NAA30 | P8T-E | Human | Esophagus | ESCC | 1.34e-10 | 2.43e-01 | 0.0889 |
| 122830 | NAA30 | P9T-E | Human | Esophagus | ESCC | 5.16e-07 | 9.37e-02 | 0.1131 |
| 122830 | NAA30 | P10T-E | Human | Esophagus | ESCC | 2.19e-19 | 4.10e-01 | 0.116 |
| 122830 | NAA30 | P11T-E | Human | Esophagus | ESCC | 6.29e-09 | 3.71e-01 | 0.1426 |
| 122830 | NAA30 | P12T-E | Human | Esophagus | ESCC | 2.23e-18 | 3.64e-01 | 0.1122 |
| 122830 | NAA30 | P15T-E | Human | Esophagus | ESCC | 2.66e-31 | 7.08e-01 | 0.1149 |
| 122830 | NAA30 | P16T-E | Human | Esophagus | ESCC | 7.11e-17 | 2.43e-01 | 0.1153 |
| 122830 | NAA30 | P17T-E | Human | Esophagus | ESCC | 2.22e-05 | 2.33e-01 | 0.1278 |
| 122830 | NAA30 | P20T-E | Human | Esophagus | ESCC | 9.84e-18 | 2.09e-01 | 0.1124 |
| 122830 | NAA30 | P21T-E | Human | Esophagus | ESCC | 1.11e-21 | 1.83e-01 | 0.1617 |
| 122830 | NAA30 | P22T-E | Human | Esophagus | ESCC | 8.85e-13 | 2.13e-01 | 0.1236 |
| 122830 | NAA30 | P23T-E | Human | Esophagus | ESCC | 2.72e-09 | 2.02e-01 | 0.108 |
| 122830 | NAA30 | P24T-E | Human | Esophagus | ESCC | 1.44e-11 | 2.24e-01 | 0.1287 |
| Page: 1 2 3 4 |
| Tissue | Expression Dynamics | Abbreviation |
| Esophagus | 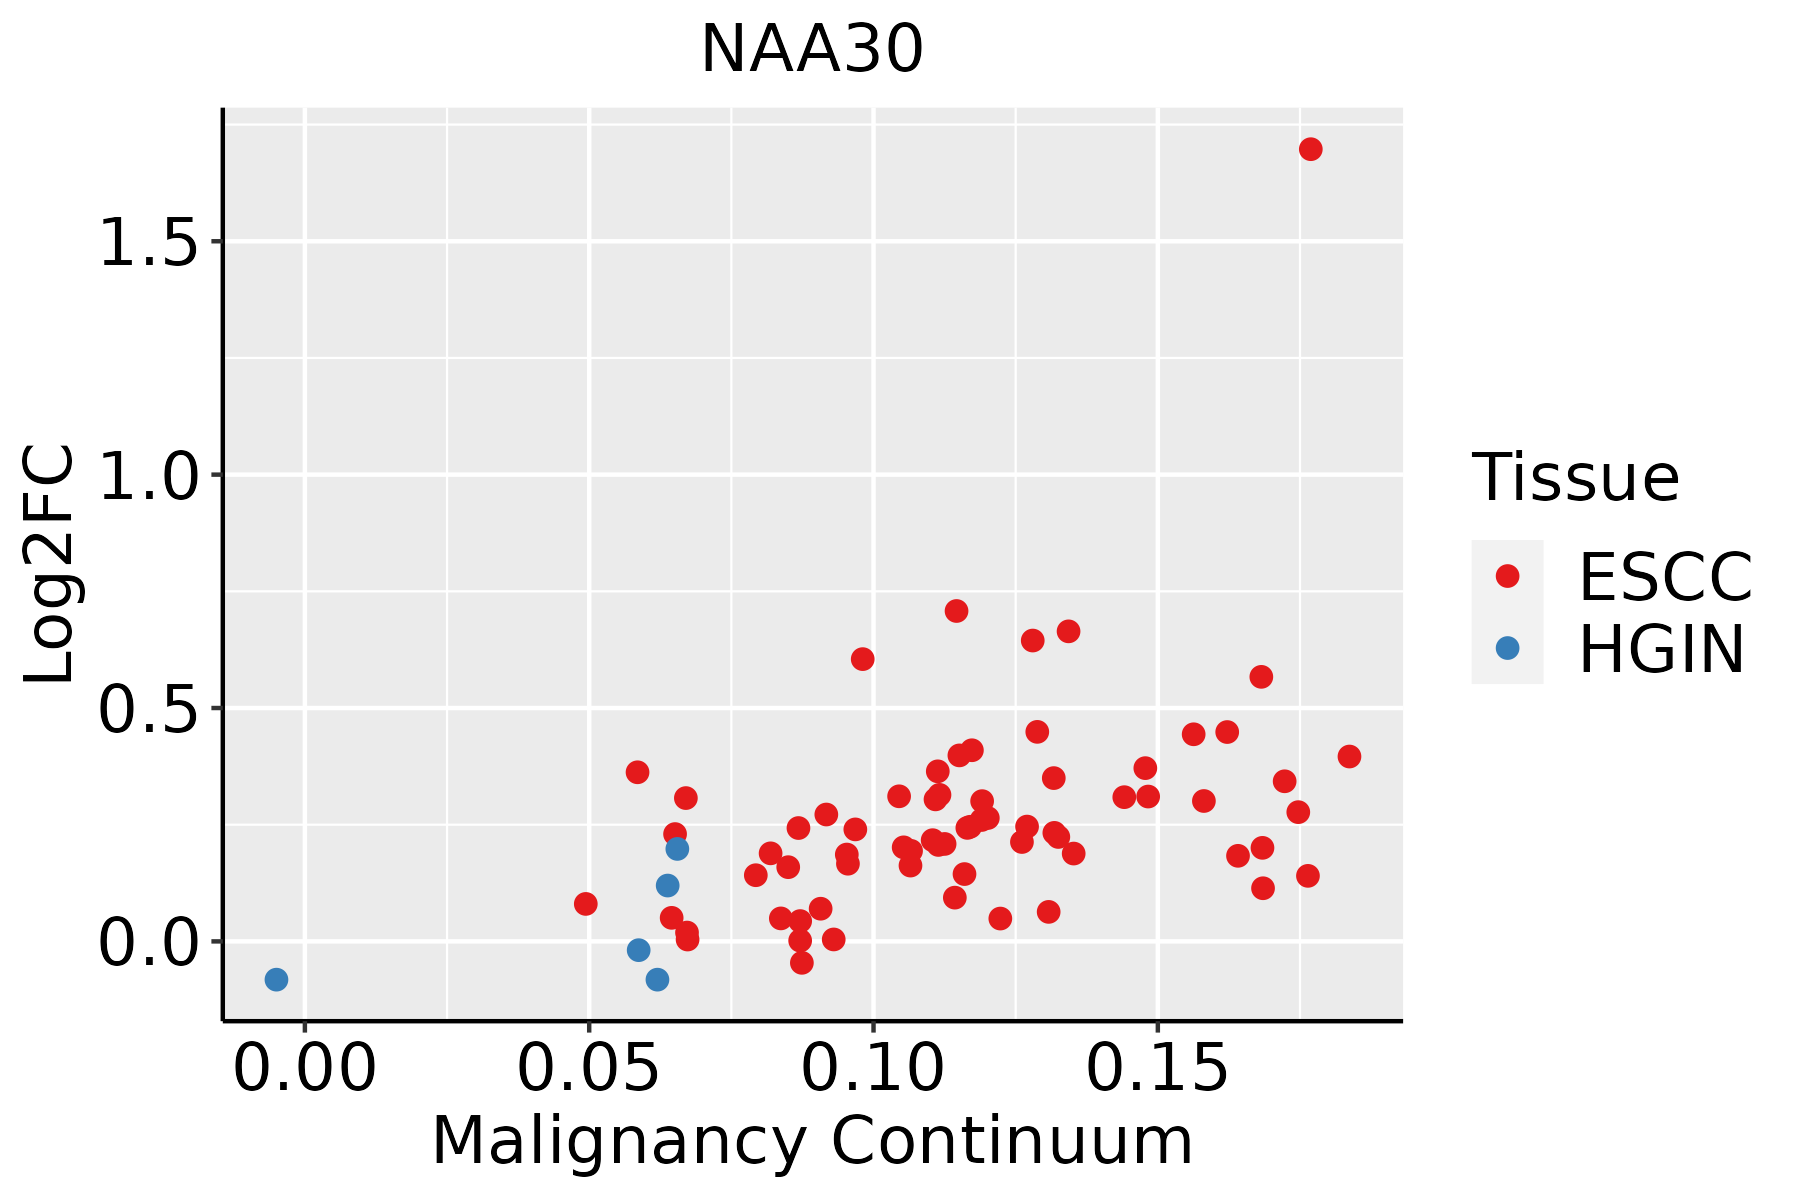 | ESCC: Esophageal squamous cell carcinoma |
| HGIN: High-grade intraepithelial neoplasias | ||
| LGIN: Low-grade intraepithelial neoplasias | ||
| Oral Cavity | 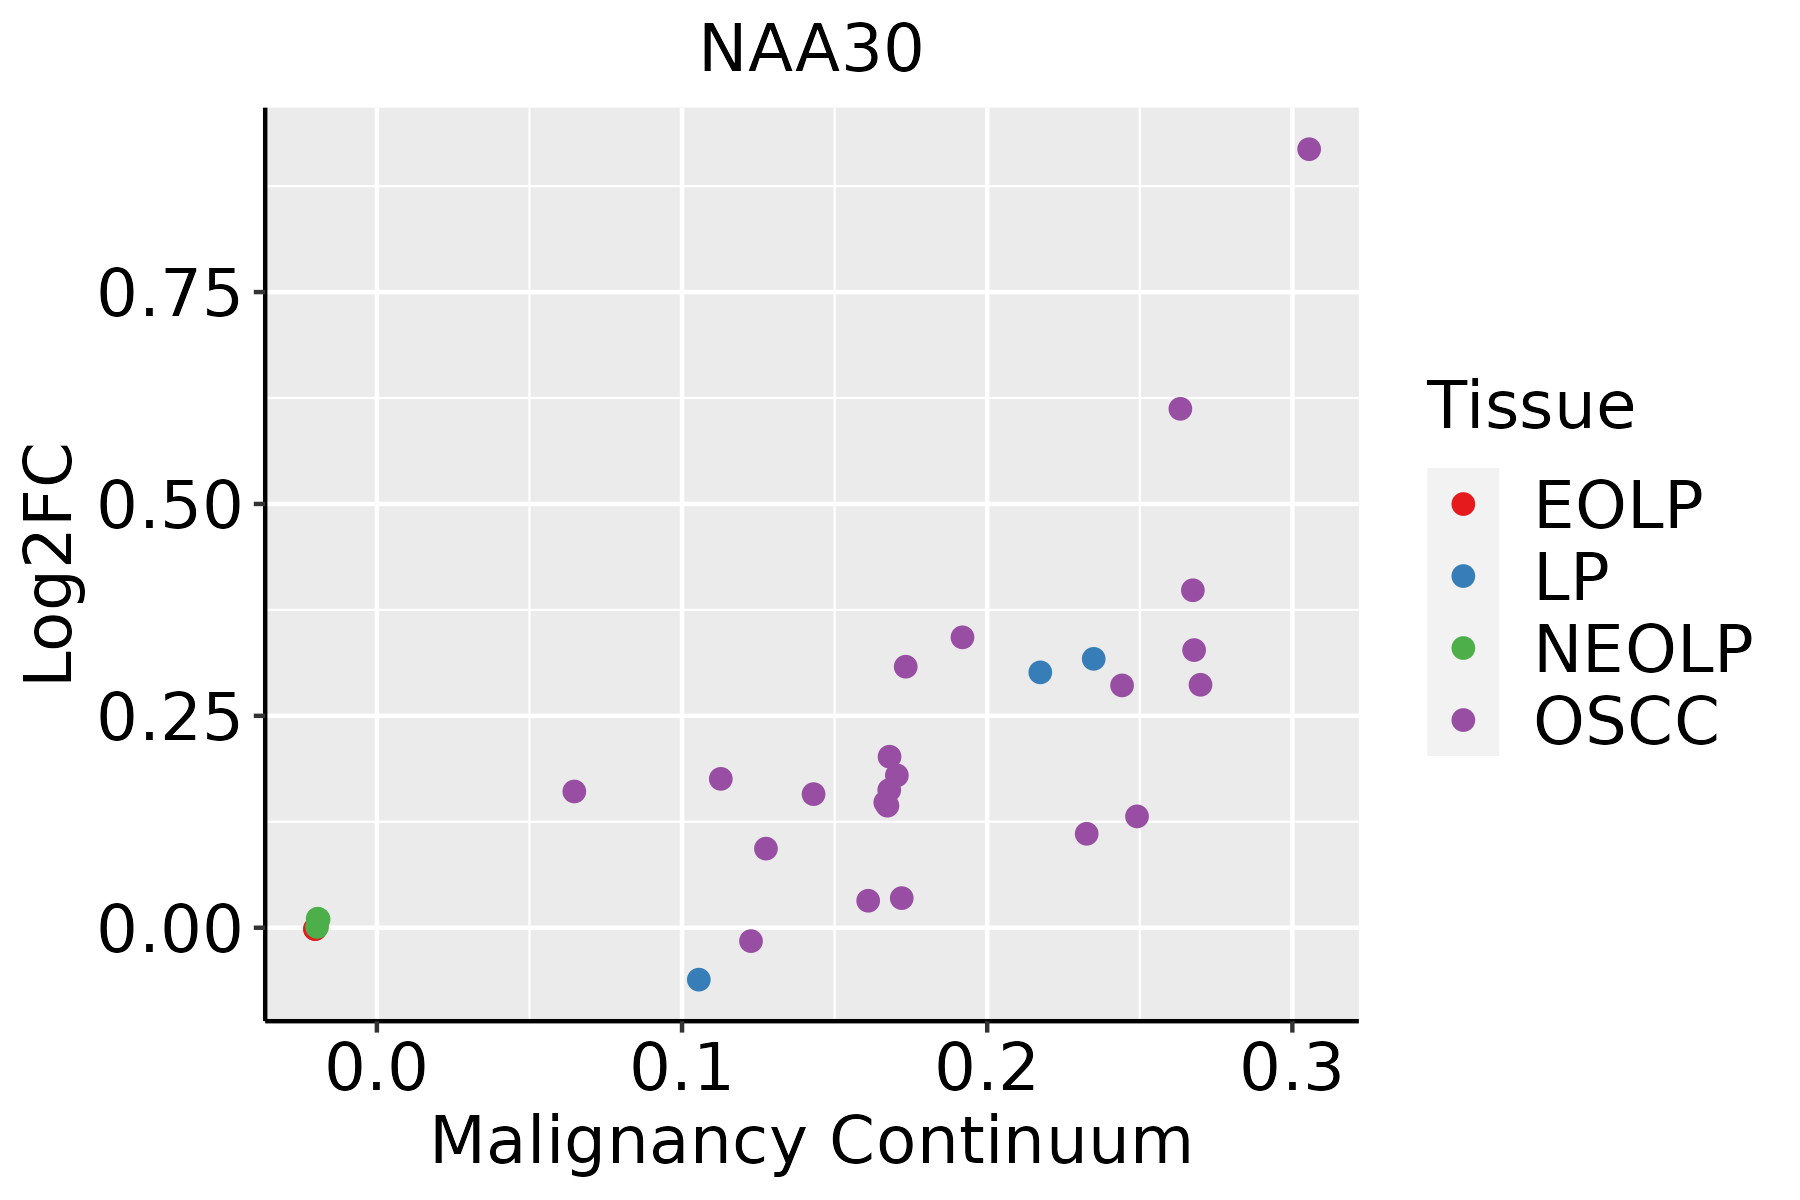 | EOLP: Erosive Oral lichen planus |
| LP: leukoplakia | ||
| NEOLP: Non-erosive oral lichen planus | ||
| OSCC: Oral squamous cell carcinoma |
| ∗log2FC in expression of this searched gene in stem-like cells from each diseased tissue sample relative to stem-like cells in normal samples in each tissue plotted against the malignancy continuum. Samples are colored based on if they are from different disease stage. |
Top |
Malignant transformation related pathway analysis |
| Find out the enriched GO biological processes and KEGG pathways involved in transition from healthy to precancer to cancer |
| Tissue | Disease Stage | Enriched GO biological Processes |
| Colorectum | AD |  |
| Colorectum | SER |  |
| Colorectum | MSS |  |
| Colorectum | MSI-H |  |
| Colorectum | FAP |  |
| ∗Top 15 enriched GO BP terms are showed in the bar plot of each disease state in each tissue. Each row represents a significant GO biological process which is colored according to the -log10(p.adjust). |
| Page: 1 2 3 4 5 6 7 8 9 |
| GO ID | Tissue | Disease Stage | Description | Gene Ratio | Bg Ratio | pvalue | p.adjust | Count |
| GO:004354313 | Esophagus | ESCC | protein acylation | 165/8552 | 243/18723 | 1.69e-12 | 7.14e-11 | 165 |
| GO:000647313 | Esophagus | ESCC | protein acetylation | 140/8552 | 201/18723 | 4.37e-12 | 1.69e-10 | 140 |
| GO:005160418 | Esophagus | ESCC | protein maturation | 189/8552 | 294/18723 | 7.64e-11 | 2.39e-09 | 189 |
| GO:00182061 | Esophagus | ESCC | peptidyl-methionine modification | 12/8552 | 13/18723 | 6.18e-04 | 3.32e-03 | 12 |
| GO:0031365 | Esophagus | ESCC | N-terminal protein amino acid modification | 21/8552 | 30/18723 | 6.17e-03 | 2.27e-02 | 21 |
| GO:0006474 | Esophagus | ESCC | N-terminal protein amino acid acetylation | 13/8552 | 17/18723 | 1.00e-02 | 3.42e-02 | 13 |
| GO:00435434 | Oral cavity | OSCC | protein acylation | 149/7305 | 243/18723 | 1.33e-12 | 5.80e-11 | 149 |
| GO:005160410 | Oral cavity | OSCC | protein maturation | 170/7305 | 294/18723 | 3.97e-11 | 1.28e-09 | 170 |
| GO:00064734 | Oral cavity | OSCC | protein acetylation | 124/7305 | 201/18723 | 5.59e-11 | 1.74e-09 | 124 |
| Page: 1 |
| Pathway ID | Tissue | Disease Stage | Description | Gene Ratio | Bg Ratio | pvalue | p.adjust | qvalue | Count |
| Page: 1 |
Top |
Cell-cell communication analysis |
| Identification of potential cell-cell interactions between two cell types and their ligand-receptor pairs for different disease states |
| Ligand | Receptor | LRpair | Pathway | Tissue | Disease Stage |
| Page: 1 |
Top |
Single-cell gene regulatory network inference analysis |
| Find out the significant the regulons (TFs) and the target genes of each regulon across cell types for different disease states |
| TF | Cell Type | Tissue | Disease Stage | Target Gene | RSS | Regulon Activity |
| ∗The dot plots of a searched regulon are shown for all cell subpopulations in each disease state of each tissue based on the regulon specific score inferred using pySCENIC and by calculating the average expression. |
| Page: 1 |
Top |
Somatic mutation of malignant transformation related genes |
| Annotation of somatic variants for genes involved in malignant transformation |
| Hugo Symbol | Variant Class | Variant Classification | dbSNP RS | HGVSc | HGVSp | HGVSp Short | SWISSPROT | BIOTYPE | SIFT | PolyPhen | Tumor Sample Barcode | Tissue | Histology | Sex | Age | Stage | Therapy Types | Drugs | Outcome |
| NAA30 | SNV | Missense_Mutation | c.946N>A | p.Asp316Asn | p.D316N | Q147X3 | protein_coding | deleterious(0) | possibly_damaging(0.688) | TCGA-AN-A0FW-01 | Breast | breast invasive carcinoma | Female | >=65 | III/IV | Unknown | Unknown | SD | |
| NAA30 | SNV | Missense_Mutation | c.602N>T | p.Ser201Leu | p.S201L | Q147X3 | protein_coding | tolerated(0.11) | benign(0.001) | TCGA-AR-A2LE-01 | Breast | breast invasive carcinoma | Female | >=65 | I/II | Hormone Therapy | tamoxiphen | PD | |
| NAA30 | SNV | Missense_Mutation | novel | c.1006N>T | p.Leu336Phe | p.L336F | Q147X3 | protein_coding | deleterious(0) | possibly_damaging(0.841) | TCGA-VS-A9U7-01 | Cervix | cervical & endocervical cancer | Female | <65 | I/II | Chemotherapy | cisplatin | CR |
| NAA30 | SNV | Missense_Mutation | c.67N>A | p.Val23Ile | p.V23I | Q147X3 | protein_coding | tolerated(1) | benign(0.007) | TCGA-G4-6628-01 | Colorectum | colon adenocarcinoma | Male | >=65 | I/II | Unknown | Unknown | SD | |
| NAA30 | SNV | Missense_Mutation | c.994C>G | p.Leu332Val | p.L332V | Q147X3 | protein_coding | deleterious(0) | probably_damaging(0.954) | TCGA-AG-A00H-01 | Colorectum | rectum adenocarcinoma | Male | >=65 | I/II | Chemotherapy | 5-fluorouracil | PD | |
| NAA30 | SNV | Missense_Mutation | novel | c.914N>C | p.Lys305Thr | p.K305T | Q147X3 | protein_coding | deleterious(0) | possibly_damaging(0.474) | TCGA-F5-6814-01 | Colorectum | rectum adenocarcinoma | Male | <65 | I/II | Unknown | Unknown | SD |
| NAA30 | SNV | Missense_Mutation | novel | c.822G>A | p.Met274Ile | p.M274I | Q147X3 | protein_coding | tolerated(0.07) | benign(0.055) | TCGA-A5-A0G2-01 | Endometrium | uterine corpus endometrioid carcinoma | Female | <65 | III/IV | Unknown | Unknown | SD |
| NAA30 | SNV | Missense_Mutation | novel | c.1006C>A | p.Leu336Ile | p.L336I | Q147X3 | protein_coding | deleterious(0) | possibly_damaging(0.896) | TCGA-A5-A0G2-01 | Endometrium | uterine corpus endometrioid carcinoma | Female | <65 | III/IV | Unknown | Unknown | SD |
| NAA30 | SNV | Missense_Mutation | c.953T>C | p.Val318Ala | p.V318A | Q147X3 | protein_coding | deleterious(0) | possibly_damaging(0.874) | TCGA-A5-A0RA-01 | Endometrium | uterine corpus endometrioid carcinoma | Female | >=65 | I/II | Unknown | Unknown | SD | |
| NAA30 | SNV | Missense_Mutation | novel | c.967G>A | p.Glu323Lys | p.E323K | Q147X3 | protein_coding | deleterious(0) | probably_damaging(0.995) | TCGA-A5-A2K5-01 | Endometrium | uterine corpus endometrioid carcinoma | Female | >=65 | I/II | Unknown | Unknown | SD |
| Page: 1 2 3 4 |
Top |
Related drugs of malignant transformation related genes |
| Identification of chemicals and drugs interact with genes involved in malignant transfromation |
| (DGIdb 4.0) |
| Entrez ID | Symbol | Category | Interaction Types | Drug Claim Name | Drug Name | PMIDs |
| Page: 1 |

Copyright 2023-Present -The University of Texas Health Science Center at Houston |