
|
|||||
|
 | |
| |
| |
| |
| |
| |
|
Gene: NAA25 |
Gene summary for NAA25 |
| Gene information | Species | Human | Gene symbol | NAA25 | Gene ID | 80018 |
| Gene name | N-alpha-acetyltransferase 25, NatB auxiliary subunit | |
| Gene Alias | C12orf30 | |
| Cytomap | 12q24.13 | |
| Gene Type | protein-coding | GO ID | GO:0006464 | UniProtAcc | Q14CX7 |
Top |
Malignant transformation analysis |
| Identification of the aberrant gene expression in precancerous and cancerous lesions by comparing the gene expression of stem-like cells in diseased tissues with normal stem cells |
| Entrez ID | Symbol | Replicates | Species | Organ | Tissue | Adj P-value | Log2FC | Malignancy |
| 80018 | NAA25 | CCI_2 | Human | Cervix | CC | 1.20e-05 | 7.17e-01 | 0.5249 |
| 80018 | NAA25 | CCI_3 | Human | Cervix | CC | 4.10e-09 | 6.62e-01 | 0.516 |
| 80018 | NAA25 | HTA11_3410_2000001011 | Human | Colorectum | AD | 2.26e-04 | -3.66e-01 | 0.0155 |
| 80018 | NAA25 | HTA11_2487_2000001011 | Human | Colorectum | SER | 2.27e-05 | -4.59e-01 | -0.1808 |
| 80018 | NAA25 | HTA11_3361_2000001011 | Human | Colorectum | AD | 4.01e-04 | -4.76e-01 | -0.1207 |
| 80018 | NAA25 | HTA11_866_2000001011 | Human | Colorectum | AD | 3.26e-02 | -3.06e-01 | -0.1001 |
| 80018 | NAA25 | HTA11_866_3004761011 | Human | Colorectum | AD | 1.52e-06 | -4.38e-01 | 0.096 |
| 80018 | NAA25 | HTA11_99999974143_84620 | Human | Colorectum | MSS | 8.26e-05 | -3.17e-01 | 0.3005 |
| 80018 | NAA25 | F007 | Human | Colorectum | FAP | 1.49e-02 | -2.57e-01 | 0.1176 |
| 80018 | NAA25 | A015-C-203 | Human | Colorectum | FAP | 5.60e-25 | -2.98e-01 | -0.1294 |
| 80018 | NAA25 | A015-C-204 | Human | Colorectum | FAP | 4.74e-06 | -2.38e-01 | -0.0228 |
| 80018 | NAA25 | A014-C-040 | Human | Colorectum | FAP | 3.81e-05 | -5.37e-01 | -0.1184 |
| 80018 | NAA25 | A002-C-201 | Human | Colorectum | FAP | 2.31e-14 | -3.25e-01 | 0.0324 |
| 80018 | NAA25 | A002-C-203 | Human | Colorectum | FAP | 5.12e-05 | -1.30e-01 | 0.2786 |
| 80018 | NAA25 | A001-C-119 | Human | Colorectum | FAP | 3.31e-06 | -2.58e-01 | -0.1557 |
| 80018 | NAA25 | A001-C-108 | Human | Colorectum | FAP | 2.88e-16 | -2.52e-01 | -0.0272 |
| 80018 | NAA25 | A002-C-205 | Human | Colorectum | FAP | 2.18e-19 | -3.96e-01 | -0.1236 |
| 80018 | NAA25 | A015-C-005 | Human | Colorectum | FAP | 2.97e-03 | -1.65e-01 | -0.0336 |
| 80018 | NAA25 | A015-C-006 | Human | Colorectum | FAP | 6.27e-12 | -1.98e-01 | -0.0994 |
| 80018 | NAA25 | A015-C-106 | Human | Colorectum | FAP | 1.76e-08 | -1.49e-01 | -0.0511 |
| Page: 1 2 3 4 5 6 7 |
| Tissue | Expression Dynamics | Abbreviation |
| Cervix | 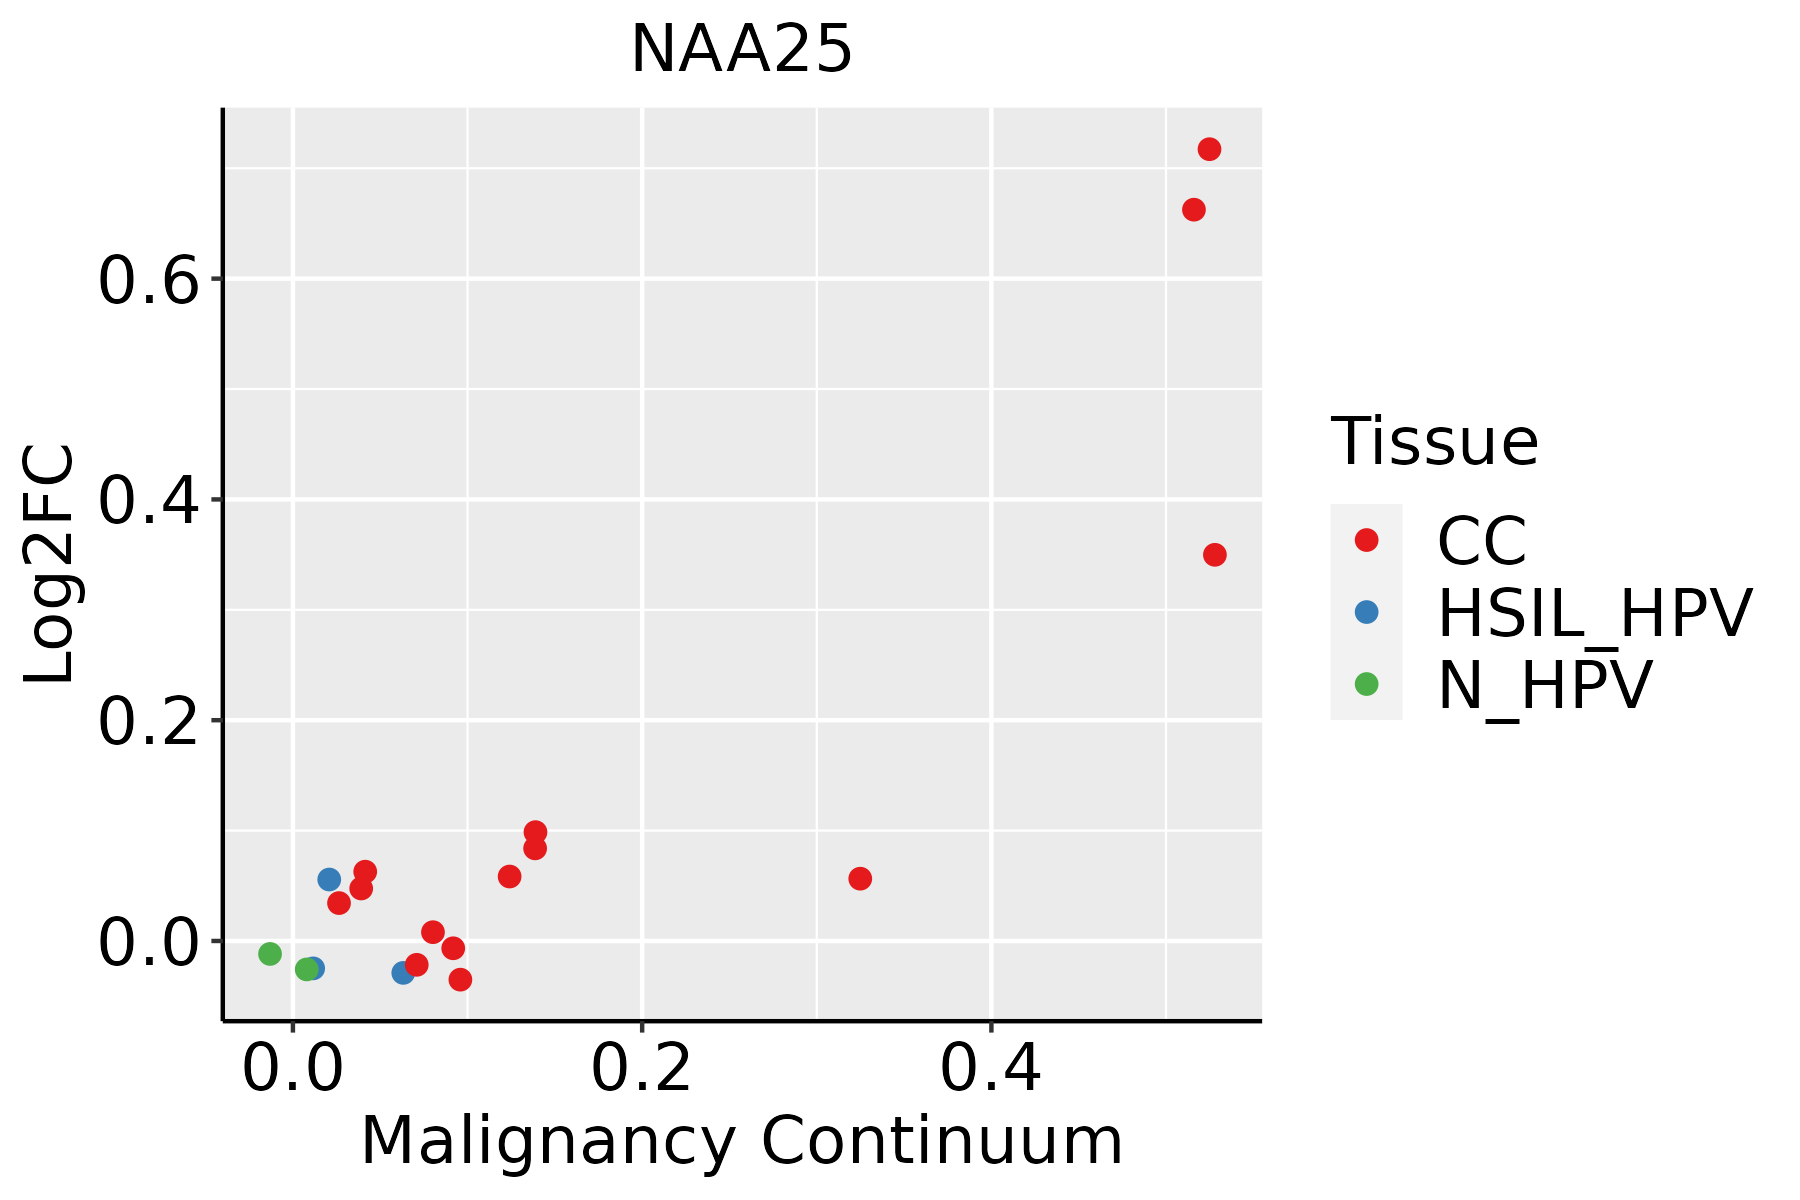 | CC: Cervix cancer |
| HSIL_HPV: HPV-infected high-grade squamous intraepithelial lesions | ||
| N_HPV: HPV-infected normal cervix | ||
| Colorectum (GSE201348) |  | FAP: Familial adenomatous polyposis |
| CRC: Colorectal cancer | ||
| Colorectum (HTA11) |  | AD: Adenomas |
| SER: Sessile serrated lesions | ||
| MSI-H: Microsatellite-high colorectal cancer | ||
| MSS: Microsatellite stable colorectal cancer | ||
| Endometrium |  | AEH: Atypical endometrial hyperplasia |
| EEC: Endometrioid Cancer | ||
| Esophagus | 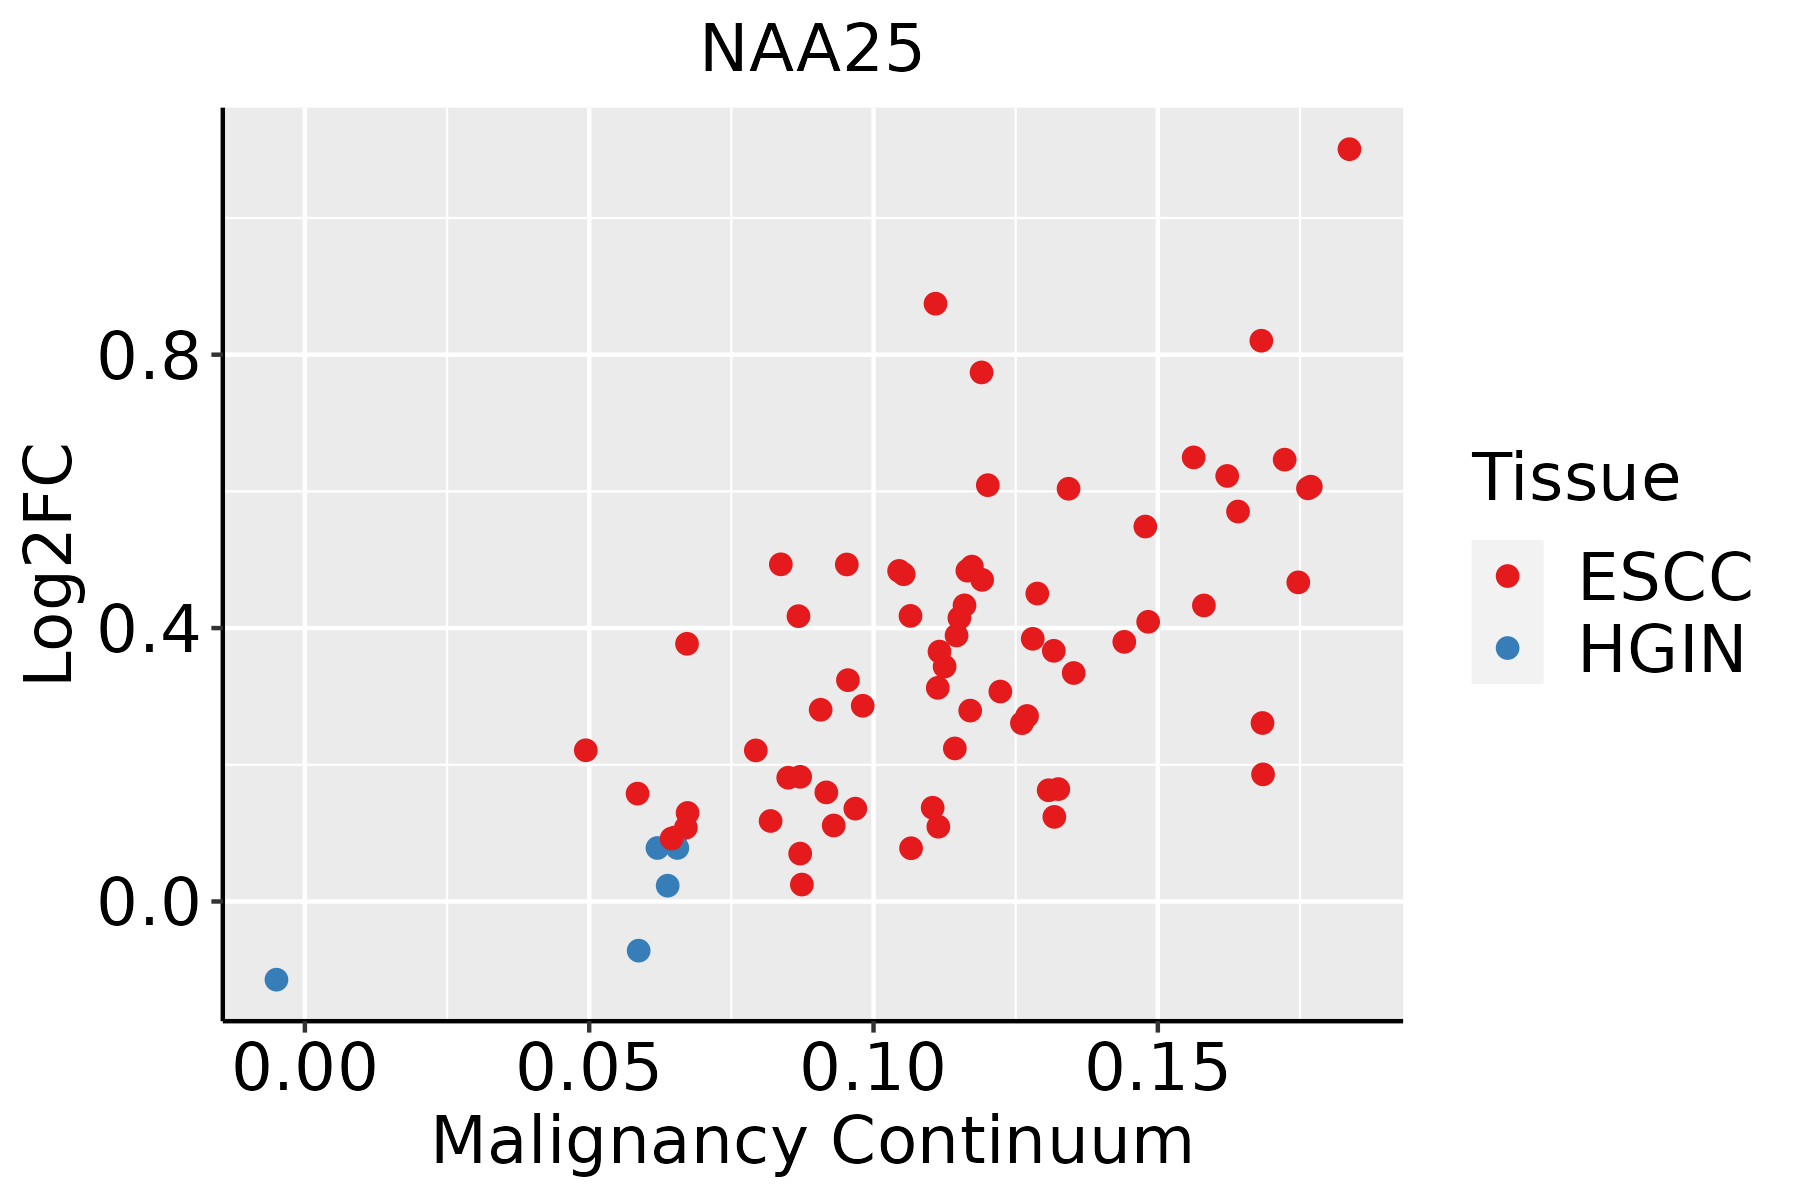 | ESCC: Esophageal squamous cell carcinoma |
| HGIN: High-grade intraepithelial neoplasias | ||
| LGIN: Low-grade intraepithelial neoplasias | ||
| Liver |  | HCC: Hepatocellular carcinoma |
| NAFLD: Non-alcoholic fatty liver disease | ||
| Oral Cavity |  | EOLP: Erosive Oral lichen planus |
| LP: leukoplakia | ||
| NEOLP: Non-erosive oral lichen planus | ||
| OSCC: Oral squamous cell carcinoma | ||
| Skin |  | AK: Actinic keratosis |
| cSCC: Cutaneous squamous cell carcinoma | ||
| SCCIS:squamous cell carcinoma in situ |
| ∗log2FC in expression of this searched gene in stem-like cells from each diseased tissue sample relative to stem-like cells in normal samples in each tissue plotted against the malignancy continuum. Samples are colored based on if they are from different disease stage. |
Top |
Malignant transformation related pathway analysis |
| Find out the enriched GO biological processes and KEGG pathways involved in transition from healthy to precancer to cancer |
| Tissue | Disease Stage | Enriched GO biological Processes |
| Colorectum | AD |  |
| Colorectum | SER |  |
| Colorectum | MSS |  |
| Colorectum | MSI-H |  |
| Colorectum | FAP |  |
| ∗Top 15 enriched GO BP terms are showed in the bar plot of each disease state in each tissue. Each row represents a significant GO biological process which is colored according to the -log10(p.adjust). |
| Page: 1 2 3 4 5 6 7 8 9 |
| GO ID | Tissue | Disease Stage | Description | Gene Ratio | Bg Ratio | pvalue | p.adjust | Count |
| GO:00516048 | Cervix | CC | protein maturation | 56/2311 | 294/18723 | 5.90e-04 | 5.59e-03 | 56 |
| GO:0051604 | Colorectum | AD | protein maturation | 85/3918 | 294/18723 | 6.73e-04 | 6.91e-03 | 85 |
| GO:00516041 | Colorectum | SER | protein maturation | 73/2897 | 294/18723 | 1.82e-05 | 5.38e-04 | 73 |
| GO:00516042 | Colorectum | MSS | protein maturation | 75/3467 | 294/18723 | 1.70e-03 | 1.53e-02 | 75 |
| GO:00516044 | Colorectum | CRC | protein maturation | 47/2078 | 294/18723 | 6.52e-03 | 4.70e-02 | 47 |
| GO:004354313 | Esophagus | ESCC | protein acylation | 165/8552 | 243/18723 | 1.69e-12 | 7.14e-11 | 165 |
| GO:000647313 | Esophagus | ESCC | protein acetylation | 140/8552 | 201/18723 | 4.37e-12 | 1.69e-10 | 140 |
| GO:005160418 | Esophagus | ESCC | protein maturation | 189/8552 | 294/18723 | 7.64e-11 | 2.39e-09 | 189 |
| GO:00182061 | Esophagus | ESCC | peptidyl-methionine modification | 12/8552 | 13/18723 | 6.18e-04 | 3.32e-03 | 12 |
| GO:0031365 | Esophagus | ESCC | N-terminal protein amino acid modification | 21/8552 | 30/18723 | 6.17e-03 | 2.27e-02 | 21 |
| GO:0006474 | Esophagus | ESCC | N-terminal protein amino acid acetylation | 13/8552 | 17/18723 | 1.00e-02 | 3.42e-02 | 13 |
| GO:0043543 | Liver | NAFLD | protein acylation | 43/1882 | 243/18723 | 1.70e-04 | 3.07e-03 | 43 |
| GO:0006473 | Liver | NAFLD | protein acetylation | 37/1882 | 201/18723 | 2.10e-04 | 3.61e-03 | 37 |
| GO:00064732 | Liver | HCC | protein acetylation | 135/7958 | 201/18723 | 1.20e-12 | 5.92e-11 | 135 |
| GO:00435432 | Liver | HCC | protein acylation | 157/7958 | 243/18723 | 2.40e-12 | 1.12e-10 | 157 |
| GO:005160412 | Liver | HCC | protein maturation | 171/7958 | 294/18723 | 3.80e-08 | 8.30e-07 | 171 |
| GO:0018206 | Liver | HCC | peptidyl-methionine modification | 10/7958 | 13/18723 | 1.28e-02 | 4.61e-02 | 10 |
| GO:00435434 | Oral cavity | OSCC | protein acylation | 149/7305 | 243/18723 | 1.33e-12 | 5.80e-11 | 149 |
| GO:005160410 | Oral cavity | OSCC | protein maturation | 170/7305 | 294/18723 | 3.97e-11 | 1.28e-09 | 170 |
| GO:00064734 | Oral cavity | OSCC | protein acetylation | 124/7305 | 201/18723 | 5.59e-11 | 1.74e-09 | 124 |
| Page: 1 2 |
| Pathway ID | Tissue | Disease Stage | Description | Gene Ratio | Bg Ratio | pvalue | p.adjust | qvalue | Count |
| Page: 1 |
Top |
Cell-cell communication analysis |
| Identification of potential cell-cell interactions between two cell types and their ligand-receptor pairs for different disease states |
| Ligand | Receptor | LRpair | Pathway | Tissue | Disease Stage |
| Page: 1 |
Top |
Single-cell gene regulatory network inference analysis |
| Find out the significant the regulons (TFs) and the target genes of each regulon across cell types for different disease states |
| TF | Cell Type | Tissue | Disease Stage | Target Gene | RSS | Regulon Activity |
| ∗The dot plots of a searched regulon are shown for all cell subpopulations in each disease state of each tissue based on the regulon specific score inferred using pySCENIC and by calculating the average expression. |
| Page: 1 |
Top |
Somatic mutation of malignant transformation related genes |
| Annotation of somatic variants for genes involved in malignant transformation |
| Hugo Symbol | Variant Class | Variant Classification | dbSNP RS | HGVSc | HGVSp | HGVSp Short | SWISSPROT | BIOTYPE | SIFT | PolyPhen | Tumor Sample Barcode | Tissue | Histology | Sex | Age | Stage | Therapy Types | Drugs | Outcome |
| NAA25 | SNV | Missense_Mutation | novel | c.284N>T | p.Pro95Leu | p.P95L | Q14CX7 | protein_coding | tolerated(0.1) | benign(0.122) | TCGA-A8-A06P-01 | Breast | breast invasive carcinoma | Female | <65 | III/IV | Unspecific | SD | |
| NAA25 | SNV | Missense_Mutation | novel | c.284N>T | p.Pro95Leu | p.P95L | Q14CX7 | protein_coding | tolerated(0.1) | benign(0.122) | TCGA-AN-A03X-01 | Breast | breast invasive carcinoma | Female | >=65 | I/II | Unknown | Unknown | SD |
| NAA25 | SNV | Missense_Mutation | c.2093G>A | p.Ser698Asn | p.S698N | Q14CX7 | protein_coding | deleterious(0.01) | benign(0.273) | TCGA-AN-A0AK-01 | Breast | breast invasive carcinoma | Female | >=65 | I/II | Unknown | Unknown | SD | |
| NAA25 | SNV | Missense_Mutation | c.1545C>G | p.Ile515Met | p.I515M | Q14CX7 | protein_coding | tolerated(0.11) | possibly_damaging(0.541) | TCGA-D8-A1JA-01 | Breast | breast invasive carcinoma | Female | <65 | III/IV | Chemotherapy | adriamycin | PD | |
| NAA25 | SNV | Missense_Mutation | c.532N>A | p.Glu178Lys | p.E178K | Q14CX7 | protein_coding | deleterious(0.02) | probably_damaging(0.994) | TCGA-E2-A2P6-01 | Breast | breast invasive carcinoma | Female | >=65 | I/II | Hormone Therapy | anastrozole | SD | |
| NAA25 | SNV | Missense_Mutation | novel | c.208N>A | p.Glu70Lys | p.E70K | Q14CX7 | protein_coding | deleterious(0.01) | probably_damaging(0.994) | TCGA-E9-A226-01 | Breast | breast invasive carcinoma | Female | <65 | III/IV | Hormone Therapy | tamoxiphen | PD |
| NAA25 | SNV | Missense_Mutation | c.1735G>C | p.Glu579Gln | p.E579Q | Q14CX7 | protein_coding | deleterious(0.01) | probably_damaging(0.999) | TCGA-JW-A5VL-01 | Cervix | cervical & endocervical cancer | Female | <65 | I/II | Unknown | Unknown | SD | |
| NAA25 | SNV | Missense_Mutation | c.1655N>T | p.Ser552Phe | p.S552F | Q14CX7 | protein_coding | tolerated(0.06) | possibly_damaging(0.678) | TCGA-MY-A5BD-01 | Cervix | cervical & endocervical cancer | Female | <65 | I/II | Chemotherapy | cisplatin | CR | |
| NAA25 | SNV | Missense_Mutation | c.755N>T | p.Ser252Phe | p.S252F | Q14CX7 | protein_coding | tolerated(0.75) | benign(0.08) | TCGA-Q1-A5R2-01 | Cervix | cervical & endocervical cancer | Female | <65 | I/II | Chemotherapy | cisplatin | PR | |
| NAA25 | SNV | Missense_Mutation | novel | c.2041G>C | p.Glu681Gln | p.E681Q | Q14CX7 | protein_coding | tolerated(0.33) | possibly_damaging(0.715) | TCGA-VS-A94X-01 | Cervix | cervical & endocervical cancer | Female | <65 | I/II | Chemotherapy | cisplatin | PD |
| Page: 1 2 3 4 5 6 7 8 9 10 11 |
Top |
Related drugs of malignant transformation related genes |
| Identification of chemicals and drugs interact with genes involved in malignant transfromation |
| (DGIdb 4.0) |
| Entrez ID | Symbol | Category | Interaction Types | Drug Claim Name | Drug Name | PMIDs |
| Page: 1 |

Copyright 2023-Present -The University of Texas Health Science Center at Houston |