
|
|||||
|
 | |
| |
| |
| |
| |
| |
|
Gene: NAA20 |
Gene summary for NAA20 |
| Gene information | Species | Human | Gene symbol | NAA20 | Gene ID | 51126 |
| Gene name | N-alpha-acetyltransferase 20, NatB catalytic subunit | |
| Gene Alias | NAT3 | |
| Cytomap | 20p11.23 | |
| Gene Type | protein-coding | GO ID | GO:0006464 | UniProtAcc | P61599 |
Top |
Malignant transformation analysis |
| Identification of the aberrant gene expression in precancerous and cancerous lesions by comparing the gene expression of stem-like cells in diseased tissues with normal stem cells |
| Entrez ID | Symbol | Replicates | Species | Organ | Tissue | Adj P-value | Log2FC | Malignancy |
| 51126 | NAA20 | CA_HPV_1 | Human | Cervix | CC | 3.56e-02 | -5.72e-02 | 0.0264 |
| 51126 | NAA20 | CA_HPV_3 | Human | Cervix | CC | 1.69e-03 | 2.14e-01 | 0.0414 |
| 51126 | NAA20 | CCII_1 | Human | Cervix | CC | 1.00e-03 | -2.86e-01 | 0.3249 |
| 51126 | NAA20 | Tumor | Human | Cervix | CC | 3.57e-13 | 5.31e-01 | 0.1241 |
| 51126 | NAA20 | sample3 | Human | Cervix | CC | 1.18e-13 | 4.09e-01 | 0.1387 |
| 51126 | NAA20 | L1 | Human | Cervix | CC | 2.71e-05 | 1.37e-01 | 0.0802 |
| 51126 | NAA20 | T3 | Human | Cervix | CC | 2.13e-08 | 4.27e-01 | 0.1389 |
| 51126 | NAA20 | LZE2D | Human | Esophagus | HGIN | 1.73e-02 | 1.04e-01 | 0.0642 |
| 51126 | NAA20 | LZE2T | Human | Esophagus | ESCC | 3.44e-05 | 1.11e+00 | 0.082 |
| 51126 | NAA20 | LZE4T | Human | Esophagus | ESCC | 4.34e-38 | 1.69e+00 | 0.0811 |
| 51126 | NAA20 | LZE7T | Human | Esophagus | ESCC | 2.05e-04 | 7.68e-01 | 0.0667 |
| 51126 | NAA20 | LZE8T | Human | Esophagus | ESCC | 3.13e-08 | 4.37e-01 | 0.067 |
| 51126 | NAA20 | LZE20T | Human | Esophagus | ESCC | 2.10e-09 | 6.98e-01 | 0.0662 |
| 51126 | NAA20 | LZE22D1 | Human | Esophagus | HGIN | 1.54e-03 | 1.08e-01 | 0.0595 |
| 51126 | NAA20 | LZE24T | Human | Esophagus | ESCC | 2.45e-11 | 4.70e-01 | 0.0596 |
| 51126 | NAA20 | LZE6T | Human | Esophagus | ESCC | 5.63e-04 | 4.65e-01 | 0.0845 |
| 51126 | NAA20 | P1T-E | Human | Esophagus | ESCC | 1.70e-05 | 7.04e-01 | 0.0875 |
| 51126 | NAA20 | P2T-E | Human | Esophagus | ESCC | 3.18e-30 | 7.32e-01 | 0.1177 |
| 51126 | NAA20 | P4T-E | Human | Esophagus | ESCC | 3.93e-38 | 1.17e+00 | 0.1323 |
| 51126 | NAA20 | P5T-E | Human | Esophagus | ESCC | 1.59e-62 | 1.41e+00 | 0.1327 |
| Page: 1 2 3 4 5 6 7 |
| Tissue | Expression Dynamics | Abbreviation |
| Cervix |  | CC: Cervix cancer |
| HSIL_HPV: HPV-infected high-grade squamous intraepithelial lesions | ||
| N_HPV: HPV-infected normal cervix | ||
| Esophagus | 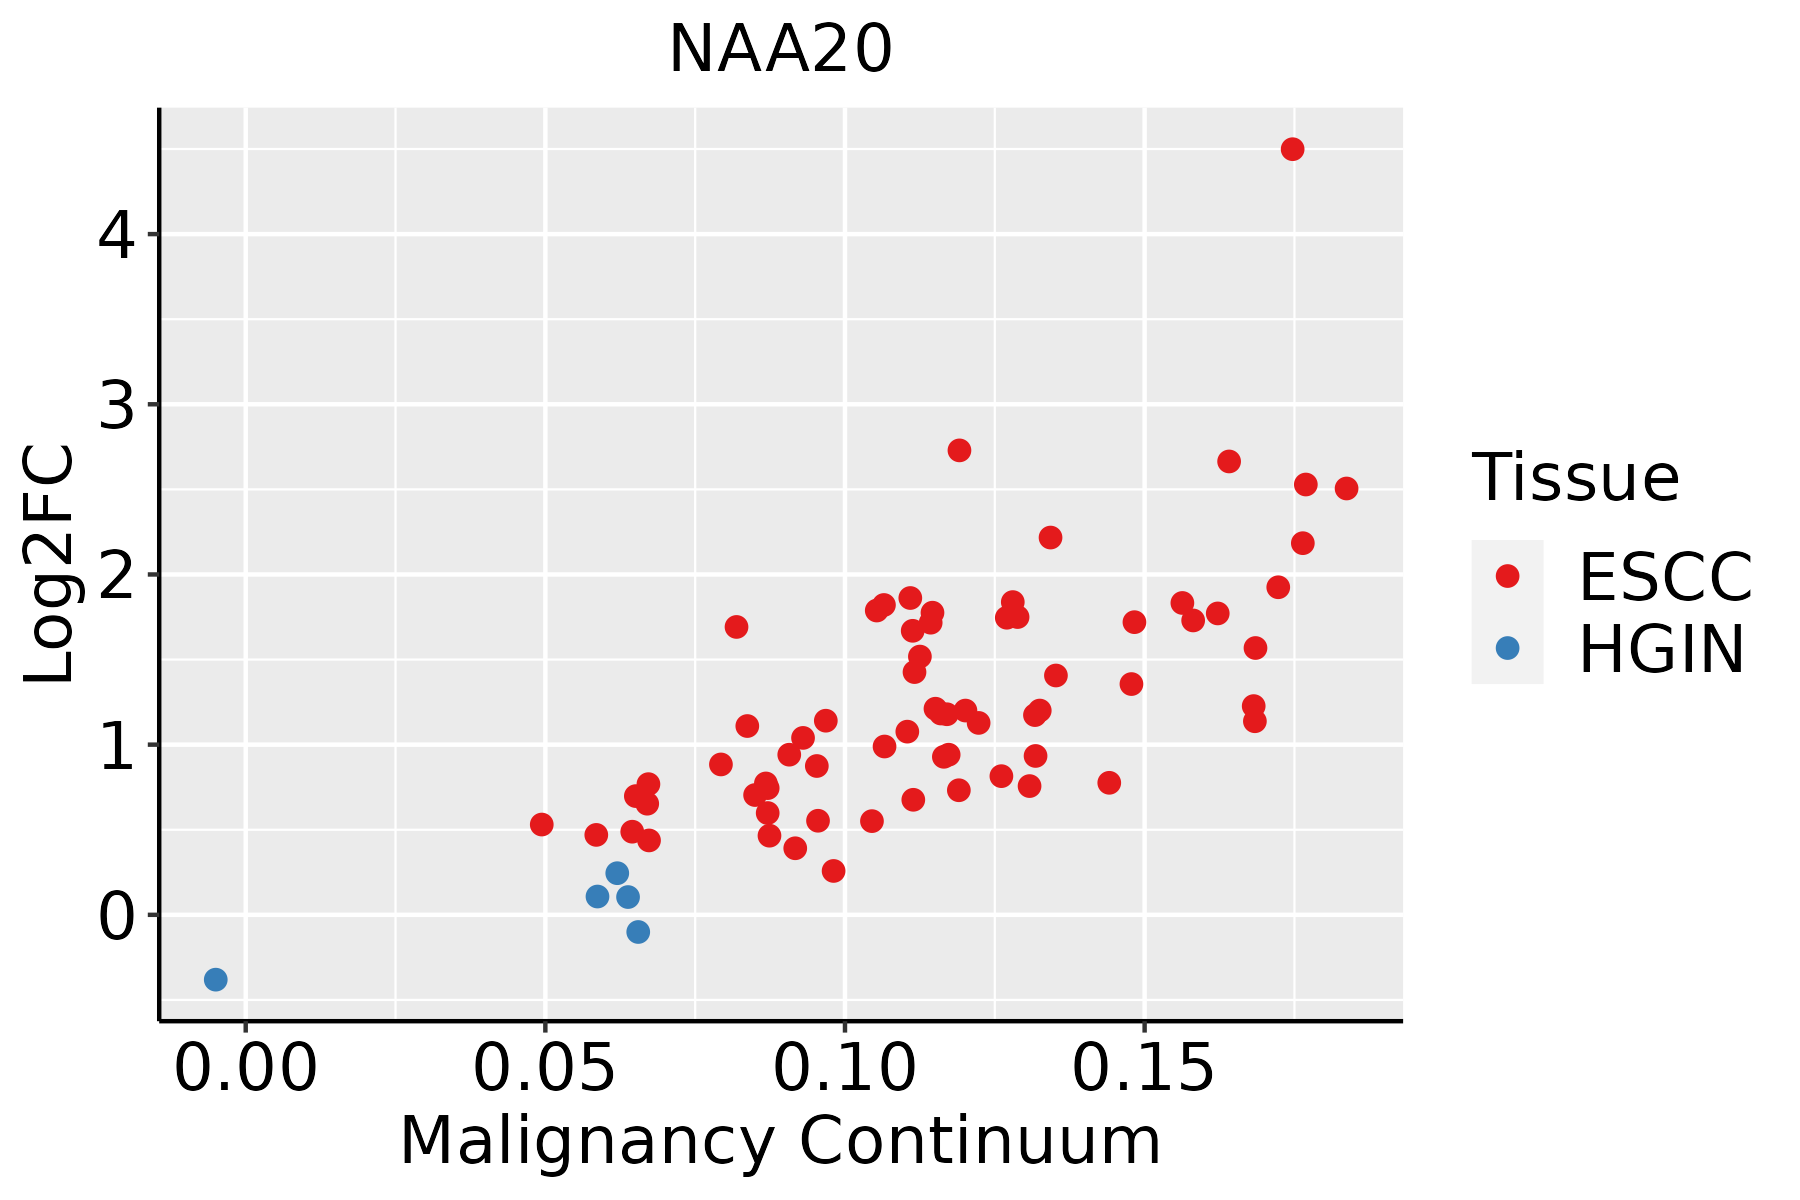 | ESCC: Esophageal squamous cell carcinoma |
| HGIN: High-grade intraepithelial neoplasias | ||
| LGIN: Low-grade intraepithelial neoplasias | ||
| Liver | 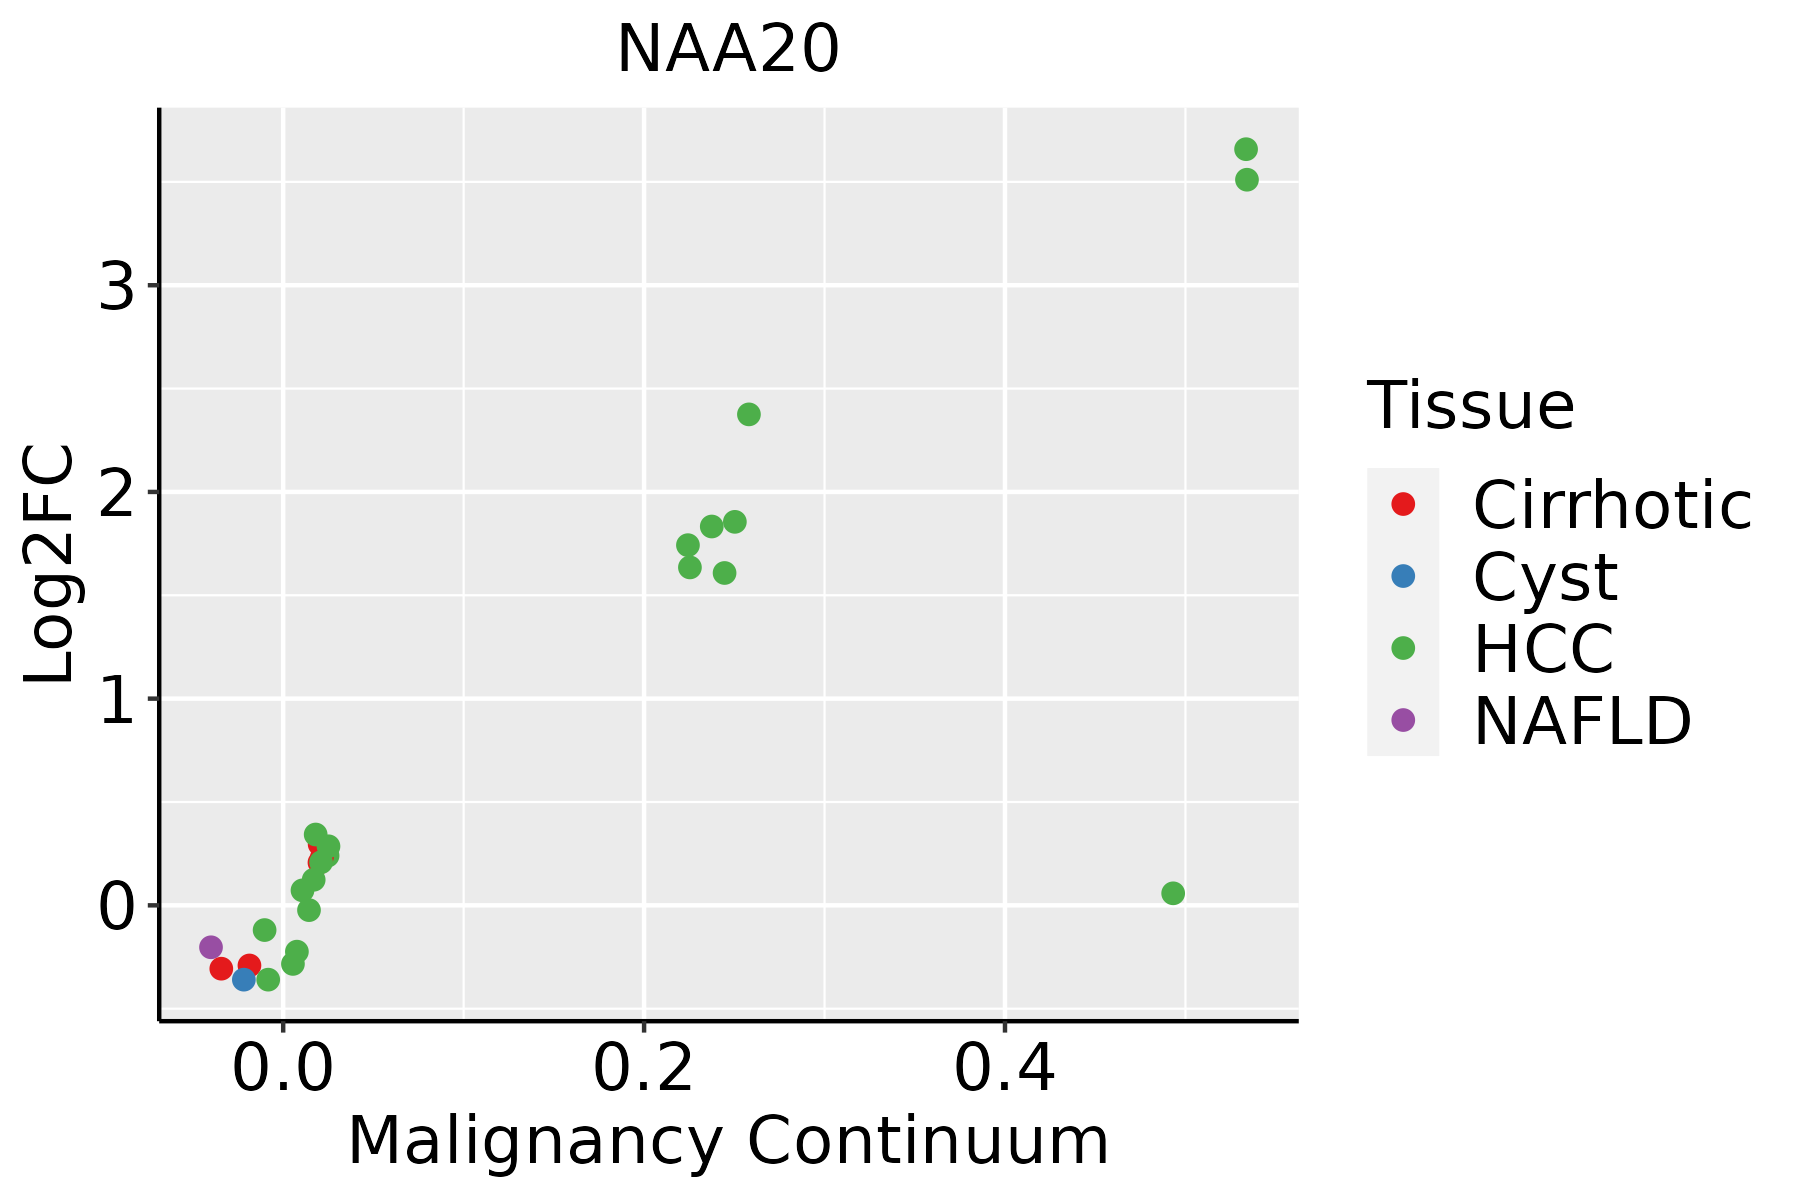 | HCC: Hepatocellular carcinoma |
| NAFLD: Non-alcoholic fatty liver disease | ||
| Oral Cavity | 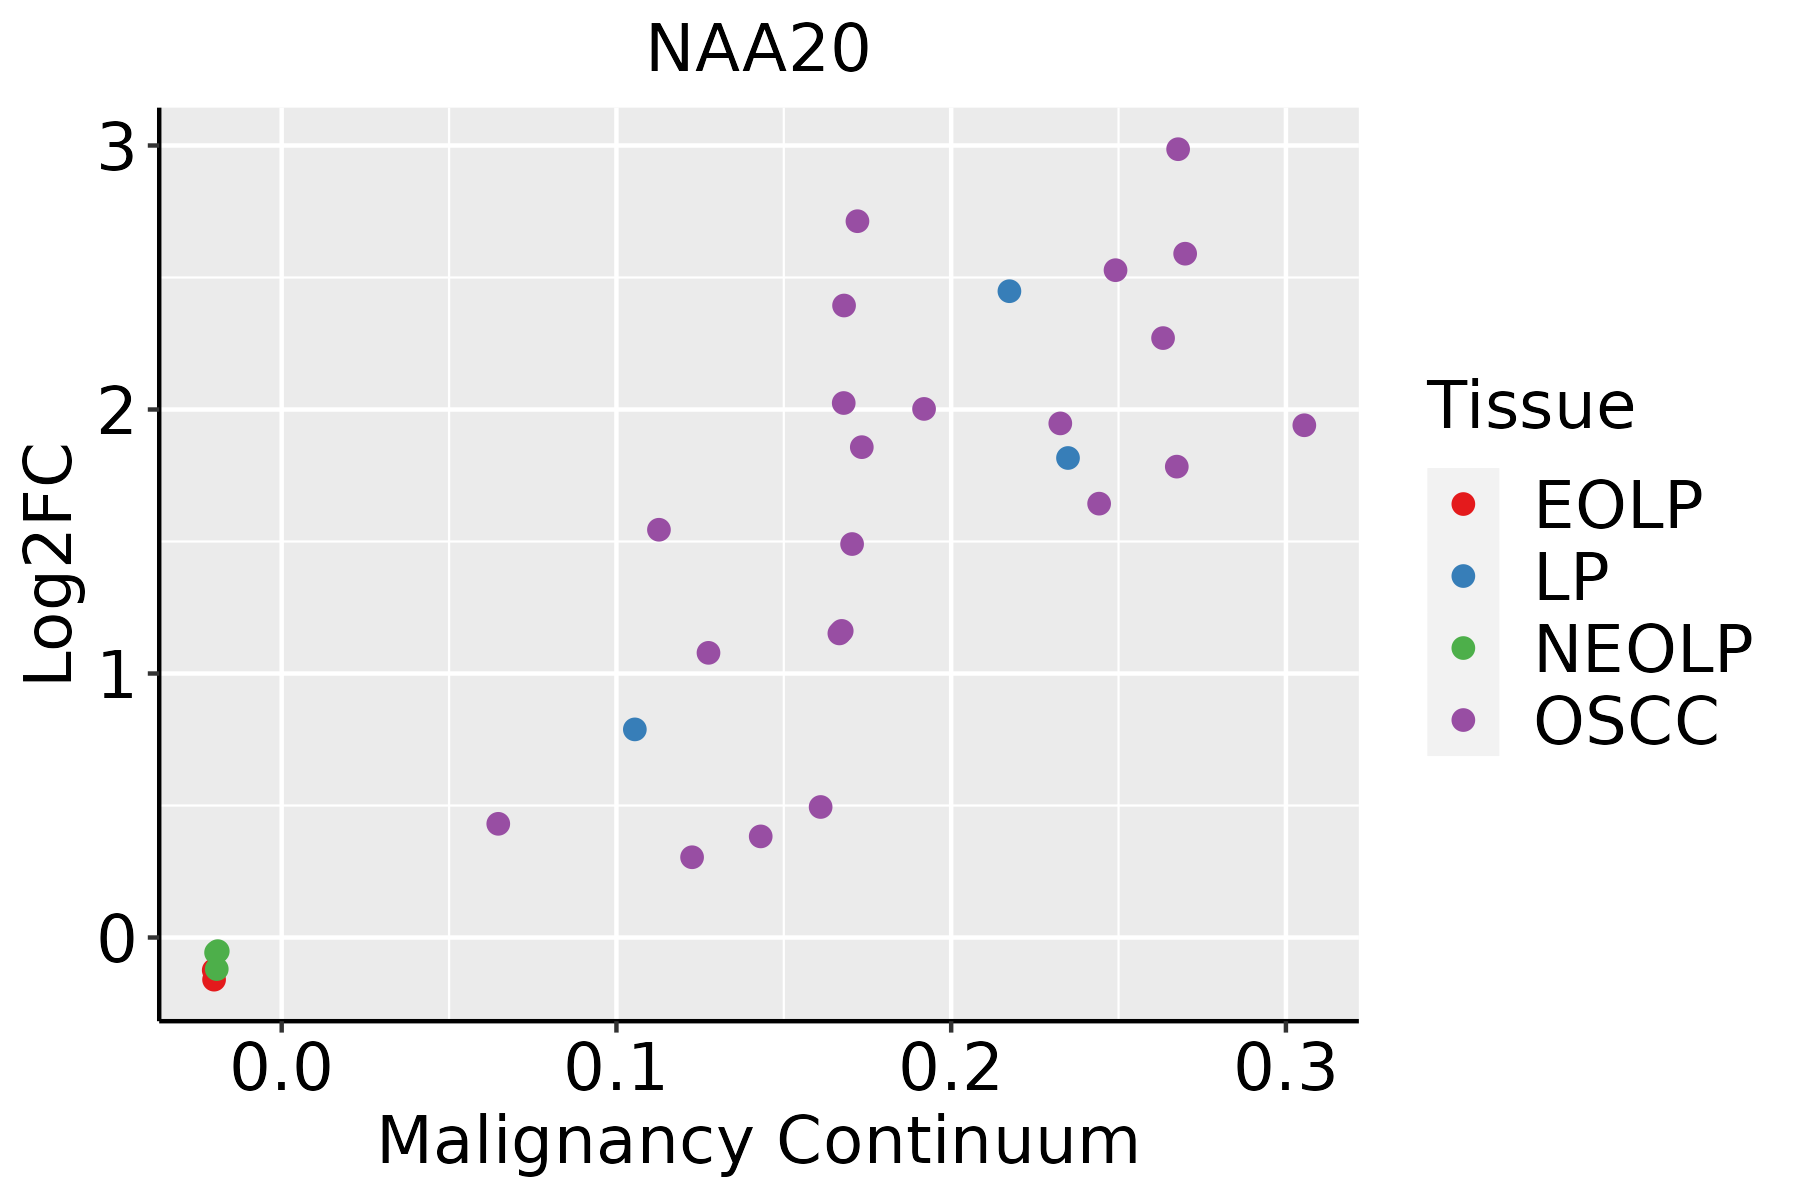 | EOLP: Erosive Oral lichen planus |
| LP: leukoplakia | ||
| NEOLP: Non-erosive oral lichen planus | ||
| OSCC: Oral squamous cell carcinoma | ||
| Skin | 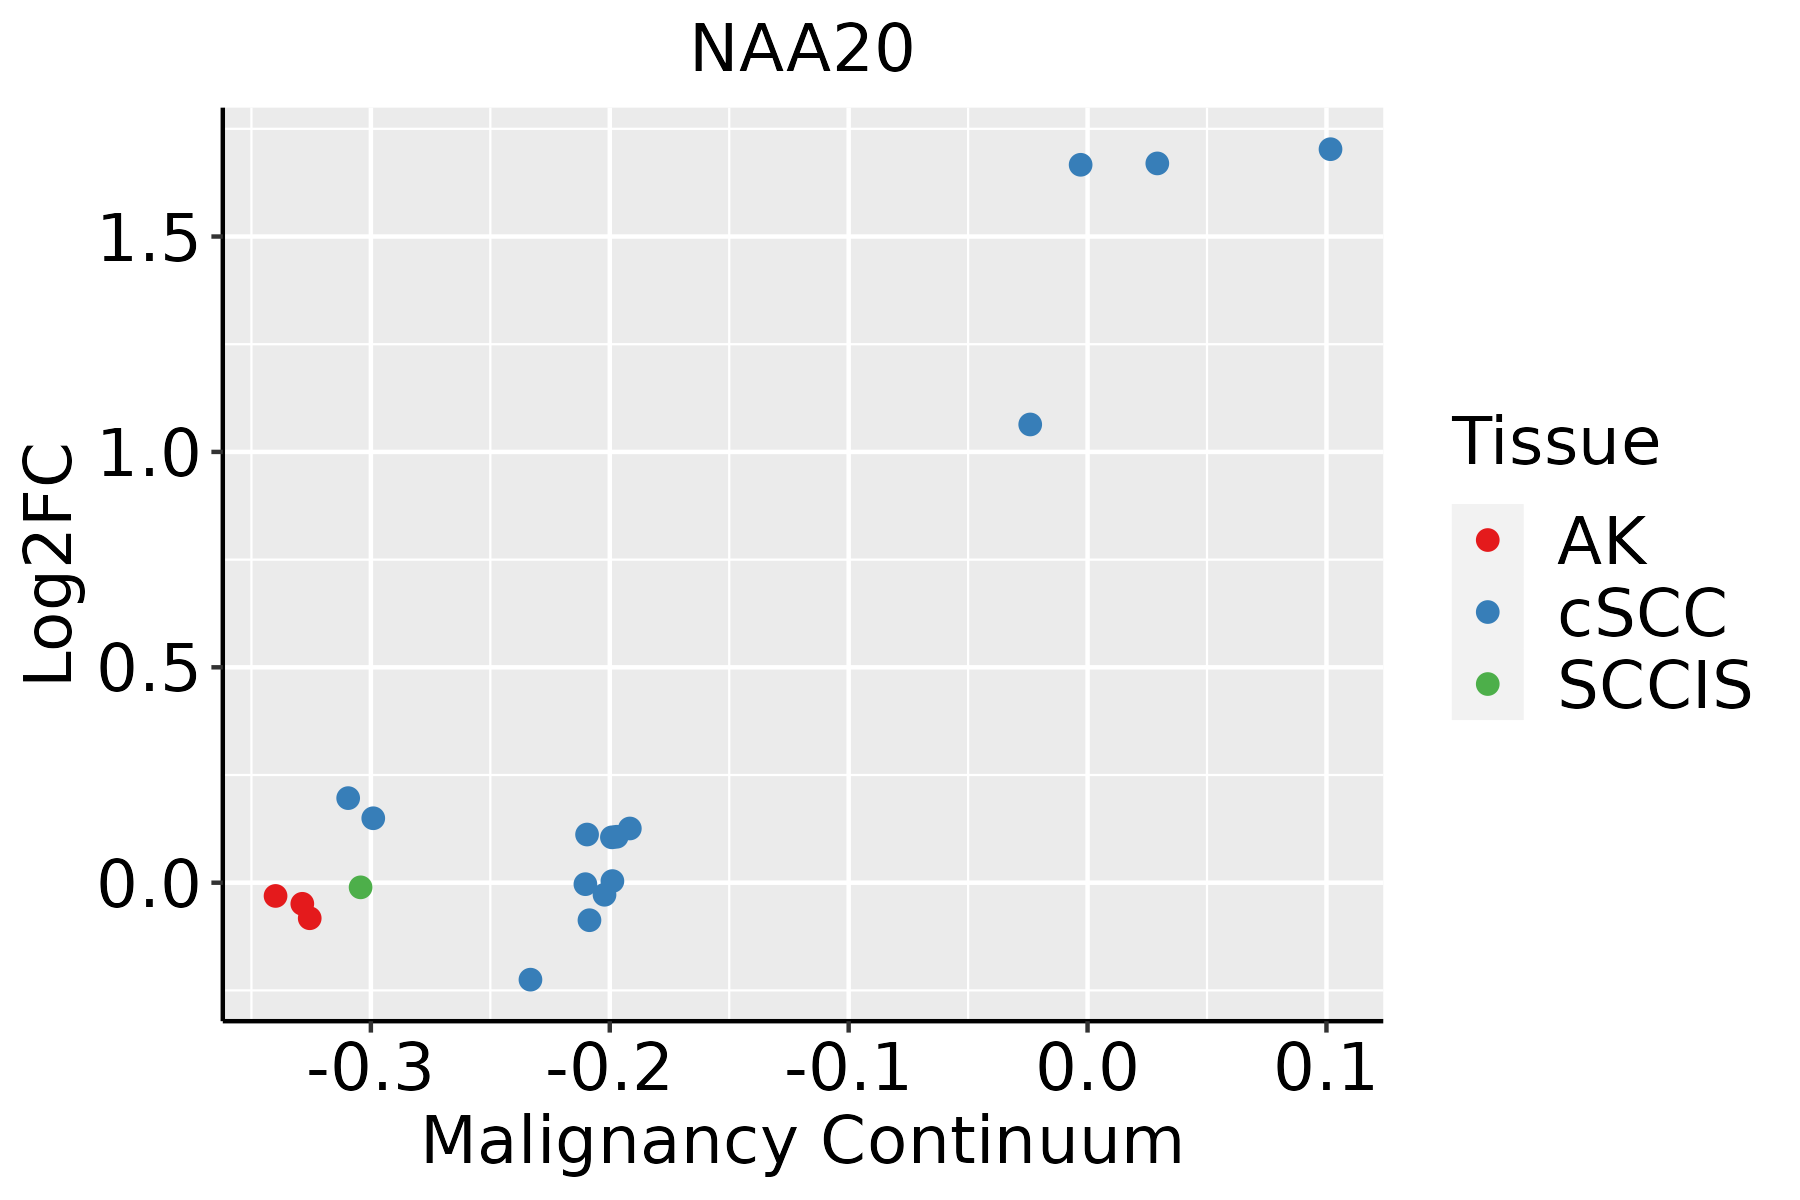 | AK: Actinic keratosis |
| cSCC: Cutaneous squamous cell carcinoma | ||
| SCCIS:squamous cell carcinoma in situ | ||
| Thyroid |  | ATC: Anaplastic thyroid cancer |
| HT: Hashimoto's thyroiditis | ||
| PTC: Papillary thyroid cancer |
| ∗log2FC in expression of this searched gene in stem-like cells from each diseased tissue sample relative to stem-like cells in normal samples in each tissue plotted against the malignancy continuum. Samples are colored based on if they are from different disease stage. |
Top |
Malignant transformation related pathway analysis |
| Find out the enriched GO biological processes and KEGG pathways involved in transition from healthy to precancer to cancer |
| Tissue | Disease Stage | Enriched GO biological Processes |
| Colorectum | AD |  |
| Colorectum | SER |  |
| Colorectum | MSS |  |
| Colorectum | MSI-H |  |
| Colorectum | FAP |  |
| ∗Top 15 enriched GO BP terms are showed in the bar plot of each disease state in each tissue. Each row represents a significant GO biological process which is colored according to the -log10(p.adjust). |
| Page: 1 2 3 4 5 6 7 8 9 |
| GO ID | Tissue | Disease Stage | Description | Gene Ratio | Bg Ratio | pvalue | p.adjust | Count |
| GO:00516048 | Cervix | CC | protein maturation | 56/2311 | 294/18723 | 5.90e-04 | 5.59e-03 | 56 |
| GO:005160417 | Esophagus | HGIN | protein maturation | 68/2587 | 294/18723 | 9.77e-06 | 2.86e-04 | 68 |
| GO:00064735 | Esophagus | HGIN | protein acetylation | 45/2587 | 201/18723 | 6.17e-04 | 8.58e-03 | 45 |
| GO:00435435 | Esophagus | HGIN | protein acylation | 51/2587 | 243/18723 | 1.33e-03 | 1.57e-02 | 51 |
| GO:004354313 | Esophagus | ESCC | protein acylation | 165/8552 | 243/18723 | 1.69e-12 | 7.14e-11 | 165 |
| GO:000647313 | Esophagus | ESCC | protein acetylation | 140/8552 | 201/18723 | 4.37e-12 | 1.69e-10 | 140 |
| GO:005160418 | Esophagus | ESCC | protein maturation | 189/8552 | 294/18723 | 7.64e-11 | 2.39e-09 | 189 |
| GO:00182061 | Esophagus | ESCC | peptidyl-methionine modification | 12/8552 | 13/18723 | 6.18e-04 | 3.32e-03 | 12 |
| GO:0031365 | Esophagus | ESCC | N-terminal protein amino acid modification | 21/8552 | 30/18723 | 6.17e-03 | 2.27e-02 | 21 |
| GO:0006474 | Esophagus | ESCC | N-terminal protein amino acid acetylation | 13/8552 | 17/18723 | 1.00e-02 | 3.42e-02 | 13 |
| GO:00516046 | Liver | Cirrhotic | protein maturation | 121/4634 | 294/18723 | 3.54e-10 | 1.68e-08 | 121 |
| GO:00064731 | Liver | Cirrhotic | protein acetylation | 84/4634 | 201/18723 | 7.50e-08 | 2.25e-06 | 84 |
| GO:00435431 | Liver | Cirrhotic | protein acylation | 95/4634 | 243/18723 | 4.73e-07 | 1.07e-05 | 95 |
| GO:00064732 | Liver | HCC | protein acetylation | 135/7958 | 201/18723 | 1.20e-12 | 5.92e-11 | 135 |
| GO:00435432 | Liver | HCC | protein acylation | 157/7958 | 243/18723 | 2.40e-12 | 1.12e-10 | 157 |
| GO:005160412 | Liver | HCC | protein maturation | 171/7958 | 294/18723 | 3.80e-08 | 8.30e-07 | 171 |
| GO:0018206 | Liver | HCC | peptidyl-methionine modification | 10/7958 | 13/18723 | 1.28e-02 | 4.61e-02 | 10 |
| GO:00435434 | Oral cavity | OSCC | protein acylation | 149/7305 | 243/18723 | 1.33e-12 | 5.80e-11 | 149 |
| GO:005160410 | Oral cavity | OSCC | protein maturation | 170/7305 | 294/18723 | 3.97e-11 | 1.28e-09 | 170 |
| GO:00064734 | Oral cavity | OSCC | protein acetylation | 124/7305 | 201/18723 | 5.59e-11 | 1.74e-09 | 124 |
| Page: 1 2 |
| Pathway ID | Tissue | Disease Stage | Description | Gene Ratio | Bg Ratio | pvalue | p.adjust | qvalue | Count |
| Page: 1 |
Top |
Cell-cell communication analysis |
| Identification of potential cell-cell interactions between two cell types and their ligand-receptor pairs for different disease states |
| Ligand | Receptor | LRpair | Pathway | Tissue | Disease Stage |
| Page: 1 |
Top |
Single-cell gene regulatory network inference analysis |
| Find out the significant the regulons (TFs) and the target genes of each regulon across cell types for different disease states |
| TF | Cell Type | Tissue | Disease Stage | Target Gene | RSS | Regulon Activity |
| ∗The dot plots of a searched regulon are shown for all cell subpopulations in each disease state of each tissue based on the regulon specific score inferred using pySCENIC and by calculating the average expression. |
| Page: 1 |
Top |
Somatic mutation of malignant transformation related genes |
| Annotation of somatic variants for genes involved in malignant transformation |
| Hugo Symbol | Variant Class | Variant Classification | dbSNP RS | HGVSc | HGVSp | HGVSp Short | SWISSPROT | BIOTYPE | SIFT | PolyPhen | Tumor Sample Barcode | Tissue | Histology | Sex | Age | Stage | Therapy Types | Drugs | Outcome |
| NAA20 | SNV | Missense_Mutation | c.523N>C | p.Glu175Gln | p.E175Q | P61599 | protein_coding | deleterious(0.04) | possibly_damaging(0.536) | TCGA-A8-A08L-01 | Breast | breast invasive carcinoma | Female | >=65 | III/IV | Unknown | Unknown | SD | |
| NAA20 | SNV | Missense_Mutation | novel | c.172A>C | p.Met58Leu | p.M58L | P61599 | protein_coding | tolerated(0.35) | benign(0.02) | TCGA-OL-A66P-01 | Breast | breast invasive carcinoma | Female | >=65 | I/II | Chemotherapy | cytoxan | CR |
| NAA20 | SNV | Missense_Mutation | novel | c.445N>A | p.Ala149Thr | p.A149T | P61599 | protein_coding | deleterious(0) | possibly_damaging(0.85) | TCGA-2W-A8YY-01 | Cervix | cervical & endocervical cancer | Female | <65 | I/II | Chemotherapy | cisplatin | CR |
| NAA20 | SNV | Missense_Mutation | novel | c.481N>A | p.Glu161Lys | p.E161K | P61599 | protein_coding | tolerated(0.29) | benign(0.003) | TCGA-VS-A9UC-01 | Cervix | cervical & endocervical cancer | Female | <65 | I/II | Chemotherapy | cisplatin | SD |
| NAA20 | SNV | Missense_Mutation | c.290N>C | p.Glu97Ala | p.E97A | P61599 | protein_coding | deleterious(0.02) | possibly_damaging(0.77) | TCGA-DM-A1D8-01 | Colorectum | colon adenocarcinoma | Female | <65 | III/IV | Unknown | Unknown | SD | |
| NAA20 | SNV | Missense_Mutation | rs748791514 | c.109G>A | p.Ala37Thr | p.A37T | P61599 | protein_coding | tolerated(0.2) | benign(0.005) | TCGA-F5-6814-01 | Colorectum | rectum adenocarcinoma | Male | <65 | I/II | Unknown | Unknown | SD |
| NAA20 | SNV | Missense_Mutation | novel | c.526N>T | p.Asp176Tyr | p.D176Y | P61599 | protein_coding | deleterious(0) | possibly_damaging(0.578) | TCGA-AP-A051-01 | Endometrium | uterine corpus endometrioid carcinoma | Female | >=65 | I/II | Unknown | Unknown | SD |
| NAA20 | SNV | Missense_Mutation | rs748791514 | c.109N>A | p.Ala37Thr | p.A37T | P61599 | protein_coding | tolerated(0.2) | benign(0.005) | TCGA-AP-A056-01 | Endometrium | uterine corpus endometrioid carcinoma | Female | <65 | I/II | Unknown | Unknown | SD |
| NAA20 | SNV | Missense_Mutation | c.395G>A | p.Arg132Lys | p.R132K | P61599 | protein_coding | deleterious(0.02) | benign(0.12) | TCGA-AP-A059-01 | Endometrium | uterine corpus endometrioid carcinoma | Female | >=65 | I/II | Unknown | Unknown | SD | |
| NAA20 | SNV | Missense_Mutation | novel | c.176N>A | p.Gly59Asp | p.G59D | P61599 | protein_coding | deleterious(0) | probably_damaging(0.997) | TCGA-AX-A0J1-01 | Endometrium | uterine corpus endometrioid carcinoma | Female | >=65 | I/II | Unknown | Unknown | SD |
| Page: 1 2 3 |
Top |
Related drugs of malignant transformation related genes |
| Identification of chemicals and drugs interact with genes involved in malignant transfromation |
| (DGIdb 4.0) |
| Entrez ID | Symbol | Category | Interaction Types | Drug Claim Name | Drug Name | PMIDs |
| Page: 1 |

Copyright 2023-Present -The University of Texas Health Science Center at Houston |