
|
|||||
|
 | |
| |
| |
| |
| |
| |
|
Gene: NAA16 |
Gene summary for NAA16 |
| Gene information | Species | Human | Gene symbol | NAA16 | Gene ID | 79612 |
| Gene name | N-alpha-acetyltransferase 16, NatA auxiliary subunit | |
| Gene Alias | NARG1L | |
| Cytomap | 13q14.11 | |
| Gene Type | protein-coding | GO ID | GO:0006139 | UniProtAcc | Q6N069 |
Top |
Malignant transformation analysis |
| Identification of the aberrant gene expression in precancerous and cancerous lesions by comparing the gene expression of stem-like cells in diseased tissues with normal stem cells |
| Entrez ID | Symbol | Replicates | Species | Organ | Tissue | Adj P-value | Log2FC | Malignancy |
| 79612 | NAA16 | LZE2T | Human | Esophagus | ESCC | 3.18e-03 | 5.76e-01 | 0.082 |
| 79612 | NAA16 | LZE4T | Human | Esophagus | ESCC | 6.97e-11 | 2.69e-01 | 0.0811 |
| 79612 | NAA16 | LZE7T | Human | Esophagus | ESCC | 6.00e-05 | 2.25e-01 | 0.0667 |
| 79612 | NAA16 | LZE22T | Human | Esophagus | ESCC | 2.53e-03 | 1.76e-01 | 0.068 |
| 79612 | NAA16 | LZE24T | Human | Esophagus | ESCC | 1.05e-05 | 6.68e-02 | 0.0596 |
| 79612 | NAA16 | LZE21T | Human | Esophagus | ESCC | 7.08e-03 | 1.78e-01 | 0.0655 |
| 79612 | NAA16 | P1T-E | Human | Esophagus | ESCC | 5.18e-07 | 2.55e-01 | 0.0875 |
| 79612 | NAA16 | P2T-E | Human | Esophagus | ESCC | 2.40e-17 | 3.49e-01 | 0.1177 |
| 79612 | NAA16 | P4T-E | Human | Esophagus | ESCC | 3.31e-25 | 4.99e-01 | 0.1323 |
| 79612 | NAA16 | P5T-E | Human | Esophagus | ESCC | 1.18e-10 | 1.28e-01 | 0.1327 |
| 79612 | NAA16 | P8T-E | Human | Esophagus | ESCC | 6.45e-13 | 3.07e-01 | 0.0889 |
| 79612 | NAA16 | P9T-E | Human | Esophagus | ESCC | 1.13e-11 | 1.77e-01 | 0.1131 |
| 79612 | NAA16 | P10T-E | Human | Esophagus | ESCC | 1.76e-24 | 4.33e-01 | 0.116 |
| 79612 | NAA16 | P12T-E | Human | Esophagus | ESCC | 1.31e-14 | 2.35e-01 | 0.1122 |
| 79612 | NAA16 | P15T-E | Human | Esophagus | ESCC | 9.30e-19 | 3.63e-01 | 0.1149 |
| 79612 | NAA16 | P16T-E | Human | Esophagus | ESCC | 2.70e-17 | 2.72e-01 | 0.1153 |
| 79612 | NAA16 | P17T-E | Human | Esophagus | ESCC | 1.29e-02 | 1.15e-01 | 0.1278 |
| 79612 | NAA16 | P20T-E | Human | Esophagus | ESCC | 2.38e-10 | 1.80e-01 | 0.1124 |
| 79612 | NAA16 | P21T-E | Human | Esophagus | ESCC | 8.31e-08 | 8.28e-02 | 0.1617 |
| 79612 | NAA16 | P22T-E | Human | Esophagus | ESCC | 2.25e-09 | 1.06e-01 | 0.1236 |
| Page: 1 2 3 4 |
| Tissue | Expression Dynamics | Abbreviation |
| Esophagus | 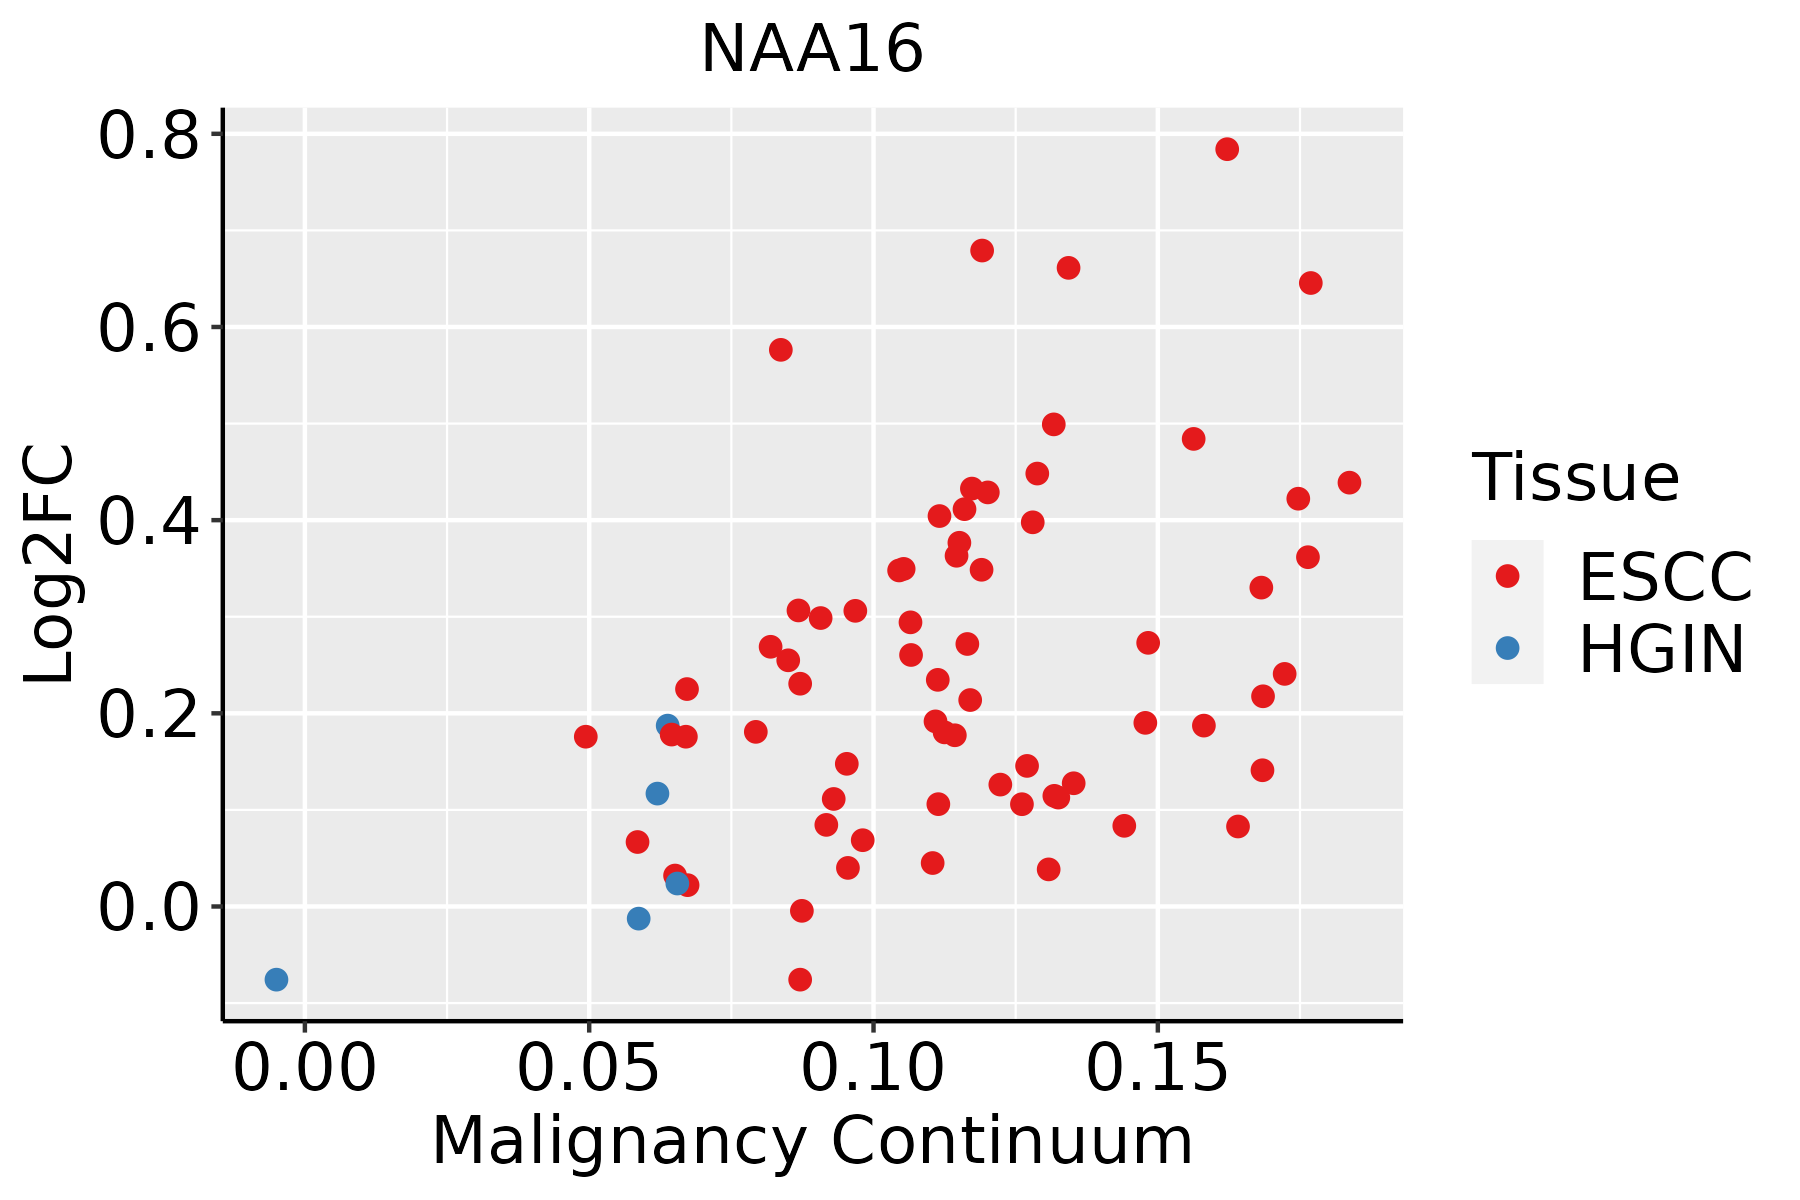 | ESCC: Esophageal squamous cell carcinoma |
| HGIN: High-grade intraepithelial neoplasias | ||
| LGIN: Low-grade intraepithelial neoplasias | ||
| Liver |  | HCC: Hepatocellular carcinoma |
| NAFLD: Non-alcoholic fatty liver disease |
| ∗log2FC in expression of this searched gene in stem-like cells from each diseased tissue sample relative to stem-like cells in normal samples in each tissue plotted against the malignancy continuum. Samples are colored based on if they are from different disease stage. |
Top |
Malignant transformation related pathway analysis |
| Find out the enriched GO biological processes and KEGG pathways involved in transition from healthy to precancer to cancer |
| Tissue | Disease Stage | Enriched GO biological Processes |
| Colorectum | AD |  |
| Colorectum | SER |  |
| Colorectum | MSS |  |
| Colorectum | MSI-H |  |
| Colorectum | FAP |  |
| ∗Top 15 enriched GO BP terms are showed in the bar plot of each disease state in each tissue. Each row represents a significant GO biological process which is colored according to the -log10(p.adjust). |
| Page: 1 2 3 4 5 6 7 8 9 |
| GO ID | Tissue | Disease Stage | Description | Gene Ratio | Bg Ratio | pvalue | p.adjust | Count |
| GO:0031647111 | Esophagus | ESCC | regulation of protein stability | 223/8552 | 298/18723 | 5.76e-25 | 1.52e-22 | 223 |
| GO:0050821111 | Esophagus | ESCC | protein stabilization | 140/8552 | 191/18723 | 6.50e-15 | 3.61e-13 | 140 |
| GO:004354313 | Esophagus | ESCC | protein acylation | 165/8552 | 243/18723 | 1.69e-12 | 7.14e-11 | 165 |
| GO:000647313 | Esophagus | ESCC | protein acetylation | 140/8552 | 201/18723 | 4.37e-12 | 1.69e-10 | 140 |
| GO:005160418 | Esophagus | ESCC | protein maturation | 189/8552 | 294/18723 | 7.64e-11 | 2.39e-09 | 189 |
| GO:00182061 | Esophagus | ESCC | peptidyl-methionine modification | 12/8552 | 13/18723 | 6.18e-04 | 3.32e-03 | 12 |
| GO:0031365 | Esophagus | ESCC | N-terminal protein amino acid modification | 21/8552 | 30/18723 | 6.17e-03 | 2.27e-02 | 21 |
| GO:0006474 | Esophagus | ESCC | N-terminal protein amino acid acetylation | 13/8552 | 17/18723 | 1.00e-02 | 3.42e-02 | 13 |
| GO:003164722 | Liver | HCC | regulation of protein stability | 211/7958 | 298/18723 | 2.29e-23 | 5.01e-21 | 211 |
| GO:005082122 | Liver | HCC | protein stabilization | 139/7958 | 191/18723 | 1.61e-17 | 1.71e-15 | 139 |
| GO:00064732 | Liver | HCC | protein acetylation | 135/7958 | 201/18723 | 1.20e-12 | 5.92e-11 | 135 |
| GO:00435432 | Liver | HCC | protein acylation | 157/7958 | 243/18723 | 2.40e-12 | 1.12e-10 | 157 |
| GO:005160412 | Liver | HCC | protein maturation | 171/7958 | 294/18723 | 3.80e-08 | 8.30e-07 | 171 |
| GO:0018206 | Liver | HCC | peptidyl-methionine modification | 10/7958 | 13/18723 | 1.28e-02 | 4.61e-02 | 10 |
| Page: 1 |
| Pathway ID | Tissue | Disease Stage | Description | Gene Ratio | Bg Ratio | pvalue | p.adjust | qvalue | Count |
| Page: 1 |
Top |
Cell-cell communication analysis |
| Identification of potential cell-cell interactions between two cell types and their ligand-receptor pairs for different disease states |
| Ligand | Receptor | LRpair | Pathway | Tissue | Disease Stage |
| Page: 1 |
Top |
Single-cell gene regulatory network inference analysis |
| Find out the significant the regulons (TFs) and the target genes of each regulon across cell types for different disease states |
| TF | Cell Type | Tissue | Disease Stage | Target Gene | RSS | Regulon Activity |
| ∗The dot plots of a searched regulon are shown for all cell subpopulations in each disease state of each tissue based on the regulon specific score inferred using pySCENIC and by calculating the average expression. |
| Page: 1 |
Top |
Somatic mutation of malignant transformation related genes |
| Annotation of somatic variants for genes involved in malignant transformation |
| Hugo Symbol | Variant Class | Variant Classification | dbSNP RS | HGVSc | HGVSp | HGVSp Short | SWISSPROT | BIOTYPE | SIFT | PolyPhen | Tumor Sample Barcode | Tissue | Histology | Sex | Age | Stage | Therapy Types | Drugs | Outcome |
| NAA16 | SNV | Missense_Mutation | novel | c.1125N>T | p.Trp375Cys | p.W375C | Q6N069 | protein_coding | deleterious(0) | probably_damaging(1) | TCGA-A2-A25A-01 | Breast | breast invasive carcinoma | Female | <65 | I/II | Unspecific | Cytoxan | SD |
| NAA16 | SNV | Missense_Mutation | c.1163N>A | p.Gly388Glu | p.G388E | Q6N069 | protein_coding | tolerated(0.07) | possibly_damaging(0.752) | TCGA-A8-A08G-01 | Breast | breast invasive carcinoma | Female | <65 | I/II | Chemotherapy | 5-fluorouracil | CR | |
| NAA16 | SNV | Missense_Mutation | c.1325N>C | p.Arg442Thr | p.R442T | Q6N069 | protein_coding | deleterious(0) | probably_damaging(0.998) | TCGA-AC-A23H-01 | Breast | breast invasive carcinoma | Female | >=65 | I/II | Unknown | Unknown | PD | |
| NAA16 | SNV | Missense_Mutation | novel | c.421N>A | p.Leu141Ile | p.L141I | Q6N069 | protein_coding | deleterious(0.01) | probably_damaging(0.981) | TCGA-AN-A046-01 | Breast | breast invasive carcinoma | Female | >=65 | I/II | Unknown | Unknown | SD |
| NAA16 | SNV | Missense_Mutation | novel | c.2051G>C | p.Arg684Thr | p.R684T | Q6N069 | protein_coding | deleterious(0) | probably_damaging(0.99) | TCGA-BH-A0B6-01 | Breast | breast invasive carcinoma | Female | <65 | I/II | Unknown | Unknown | SD |
| NAA16 | SNV | Missense_Mutation | rs769875149 | c.1890A>T | p.Glu630Asp | p.E630D | Q6N069 | protein_coding | tolerated(1) | benign(0) | TCGA-BH-A0HA-01 | Breast | breast invasive carcinoma | Female | <65 | I/II | Unknown | Unknown | SD |
| NAA16 | insertion | Nonsense_Mutation | novel | c.2533_2534insCTGGTAGGAGCCAGCTCCAGCTTACCACTGATTAAACACTT | p.Asp845AlafsTer12 | p.D845Afs*12 | Q6N069 | protein_coding | TCGA-AN-A04C-01 | Breast | breast invasive carcinoma | Female | <65 | I/II | Unknown | Unknown | SD | ||
| NAA16 | deletion | Frame_Shift_Del | c.1321delN | p.Asp441IlefsTer17 | p.D441Ifs*17 | Q6N069 | protein_coding | TCGA-EW-A2FV-01 | Breast | breast invasive carcinoma | Female | <65 | III/IV | Chemotherapy | docetaxel | SD | |||
| NAA16 | SNV | Missense_Mutation | rs748037334 | c.1187A>G | p.Tyr396Cys | p.Y396C | Q6N069 | protein_coding | deleterious(0) | probably_damaging(0.987) | TCGA-2W-A8YY-01 | Cervix | cervical & endocervical cancer | Female | <65 | I/II | Chemotherapy | cisplatin | CR |
| NAA16 | SNV | Missense_Mutation | c.1488G>T | p.Gln496His | p.Q496H | Q6N069 | protein_coding | deleterious(0.05) | probably_damaging(0.928) | TCGA-C5-A1BL-01 | Cervix | cervical & endocervical cancer | Female | <65 | I/II | Unknown | Unknown | SD |
| Page: 1 2 3 4 5 6 7 8 9 |
Top |
Related drugs of malignant transformation related genes |
| Identification of chemicals and drugs interact with genes involved in malignant transfromation |
| (DGIdb 4.0) |
| Entrez ID | Symbol | Category | Interaction Types | Drug Claim Name | Drug Name | PMIDs |
| Page: 1 |

Copyright 2023-Present -The University of Texas Health Science Center at Houston |