
|
|||||
|
 | |
| |
| |
| |
| |
| |
|
Gene: NAA15 |
Gene summary for NAA15 |
| Gene information | Species | Human | Gene symbol | NAA15 | Gene ID | 80155 |
| Gene name | N-alpha-acetyltransferase 15, NatA auxiliary subunit | |
| Gene Alias | Ga19 | |
| Cytomap | 4q31.1 | |
| Gene Type | protein-coding | GO ID | GO:0001525 | UniProtAcc | B2RBE5 |
Top |
Malignant transformation analysis |
| Identification of the aberrant gene expression in precancerous and cancerous lesions by comparing the gene expression of stem-like cells in diseased tissues with normal stem cells |
| Entrez ID | Symbol | Replicates | Species | Organ | Tissue | Adj P-value | Log2FC | Malignancy |
| 80155 | NAA15 | CCI_2 | Human | Cervix | CC | 1.42e-05 | 8.42e-01 | 0.5249 |
| 80155 | NAA15 | CCI_3 | Human | Cervix | CC | 1.92e-04 | 6.43e-01 | 0.516 |
| 80155 | NAA15 | HTA11_3410_2000001011 | Human | Colorectum | AD | 3.92e-12 | -5.43e-01 | 0.0155 |
| 80155 | NAA15 | HTA11_2487_2000001011 | Human | Colorectum | SER | 2.58e-02 | -4.58e-01 | -0.1808 |
| 80155 | NAA15 | HTA11_3361_2000001011 | Human | Colorectum | AD | 1.19e-04 | -5.62e-01 | -0.1207 |
| 80155 | NAA15 | HTA11_696_2000001011 | Human | Colorectum | AD | 1.58e-07 | -4.04e-01 | -0.1464 |
| 80155 | NAA15 | HTA11_866_2000001011 | Human | Colorectum | AD | 1.89e-10 | -3.97e-01 | -0.1001 |
| 80155 | NAA15 | HTA11_866_3004761011 | Human | Colorectum | AD | 1.06e-05 | -4.91e-01 | 0.096 |
| 80155 | NAA15 | HTA11_8622_2000001021 | Human | Colorectum | SER | 4.53e-02 | -6.24e-01 | 0.0528 |
| 80155 | NAA15 | HTA11_7696_3000711011 | Human | Colorectum | AD | 3.30e-05 | -3.65e-01 | 0.0674 |
| 80155 | NAA15 | HTA11_99999970781_79442 | Human | Colorectum | MSS | 9.65e-06 | -3.74e-01 | 0.294 |
| 80155 | NAA15 | HTA11_99999971662_82457 | Human | Colorectum | MSS | 2.34e-02 | -2.76e-01 | 0.3859 |
| 80155 | NAA15 | HTA11_99999974143_84620 | Human | Colorectum | MSS | 4.26e-15 | -5.13e-01 | 0.3005 |
| 80155 | NAA15 | F007 | Human | Colorectum | FAP | 2.95e-06 | -4.55e-01 | 0.1176 |
| 80155 | NAA15 | A001-C-207 | Human | Colorectum | FAP | 3.61e-05 | -3.95e-01 | 0.1278 |
| 80155 | NAA15 | A015-C-203 | Human | Colorectum | FAP | 1.09e-28 | -4.55e-01 | -0.1294 |
| 80155 | NAA15 | A015-C-204 | Human | Colorectum | FAP | 1.49e-07 | -3.87e-01 | -0.0228 |
| 80155 | NAA15 | A014-C-040 | Human | Colorectum | FAP | 3.34e-02 | -3.16e-01 | -0.1184 |
| 80155 | NAA15 | A002-C-201 | Human | Colorectum | FAP | 6.09e-16 | -4.85e-01 | 0.0324 |
| 80155 | NAA15 | A002-C-203 | Human | Colorectum | FAP | 1.04e-02 | -1.58e-01 | 0.2786 |
| Page: 1 2 3 4 5 6 7 8 9 |
| Tissue | Expression Dynamics | Abbreviation |
| Cervix | 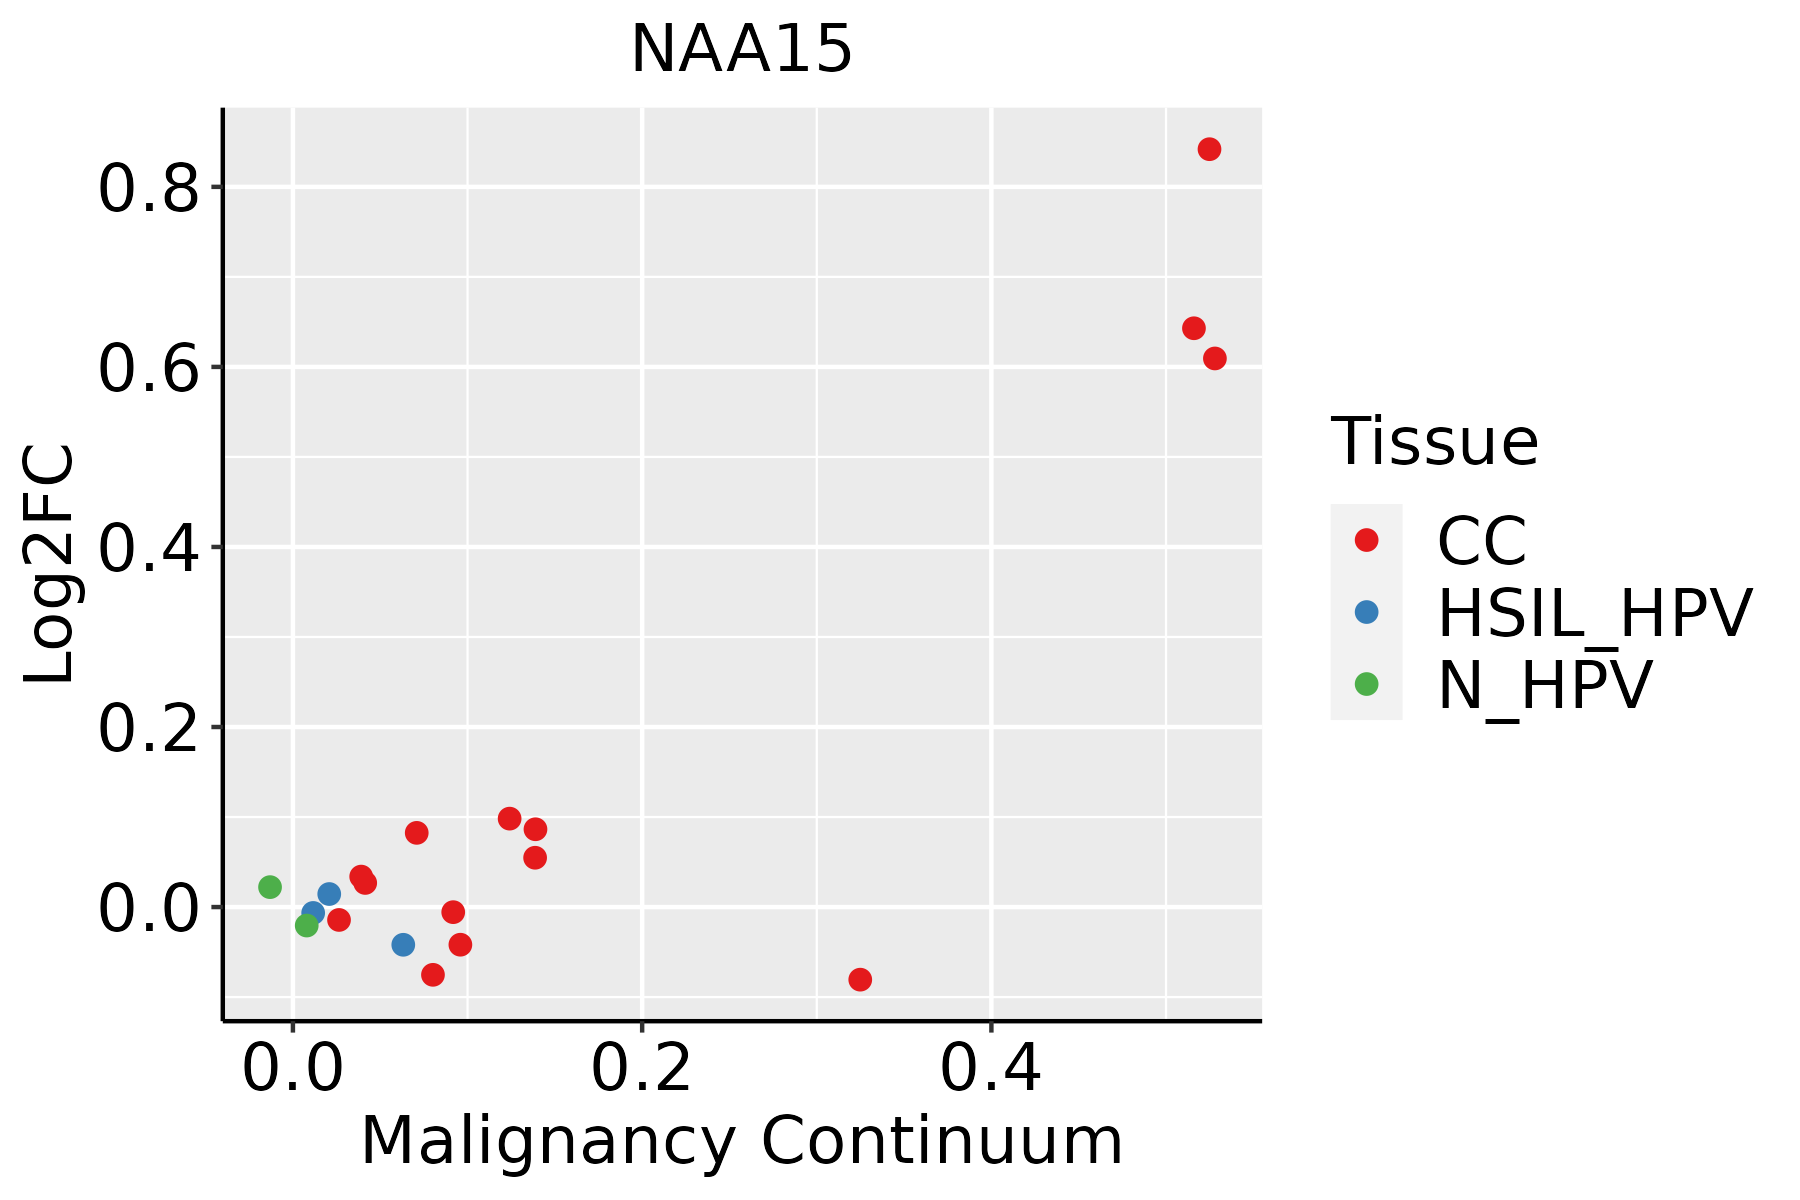 | CC: Cervix cancer |
| HSIL_HPV: HPV-infected high-grade squamous intraepithelial lesions | ||
| N_HPV: HPV-infected normal cervix | ||
| Colorectum (GSE201348) |  | FAP: Familial adenomatous polyposis |
| CRC: Colorectal cancer | ||
| Colorectum (HTA11) |  | AD: Adenomas |
| SER: Sessile serrated lesions | ||
| MSI-H: Microsatellite-high colorectal cancer | ||
| MSS: Microsatellite stable colorectal cancer | ||
| Esophagus | 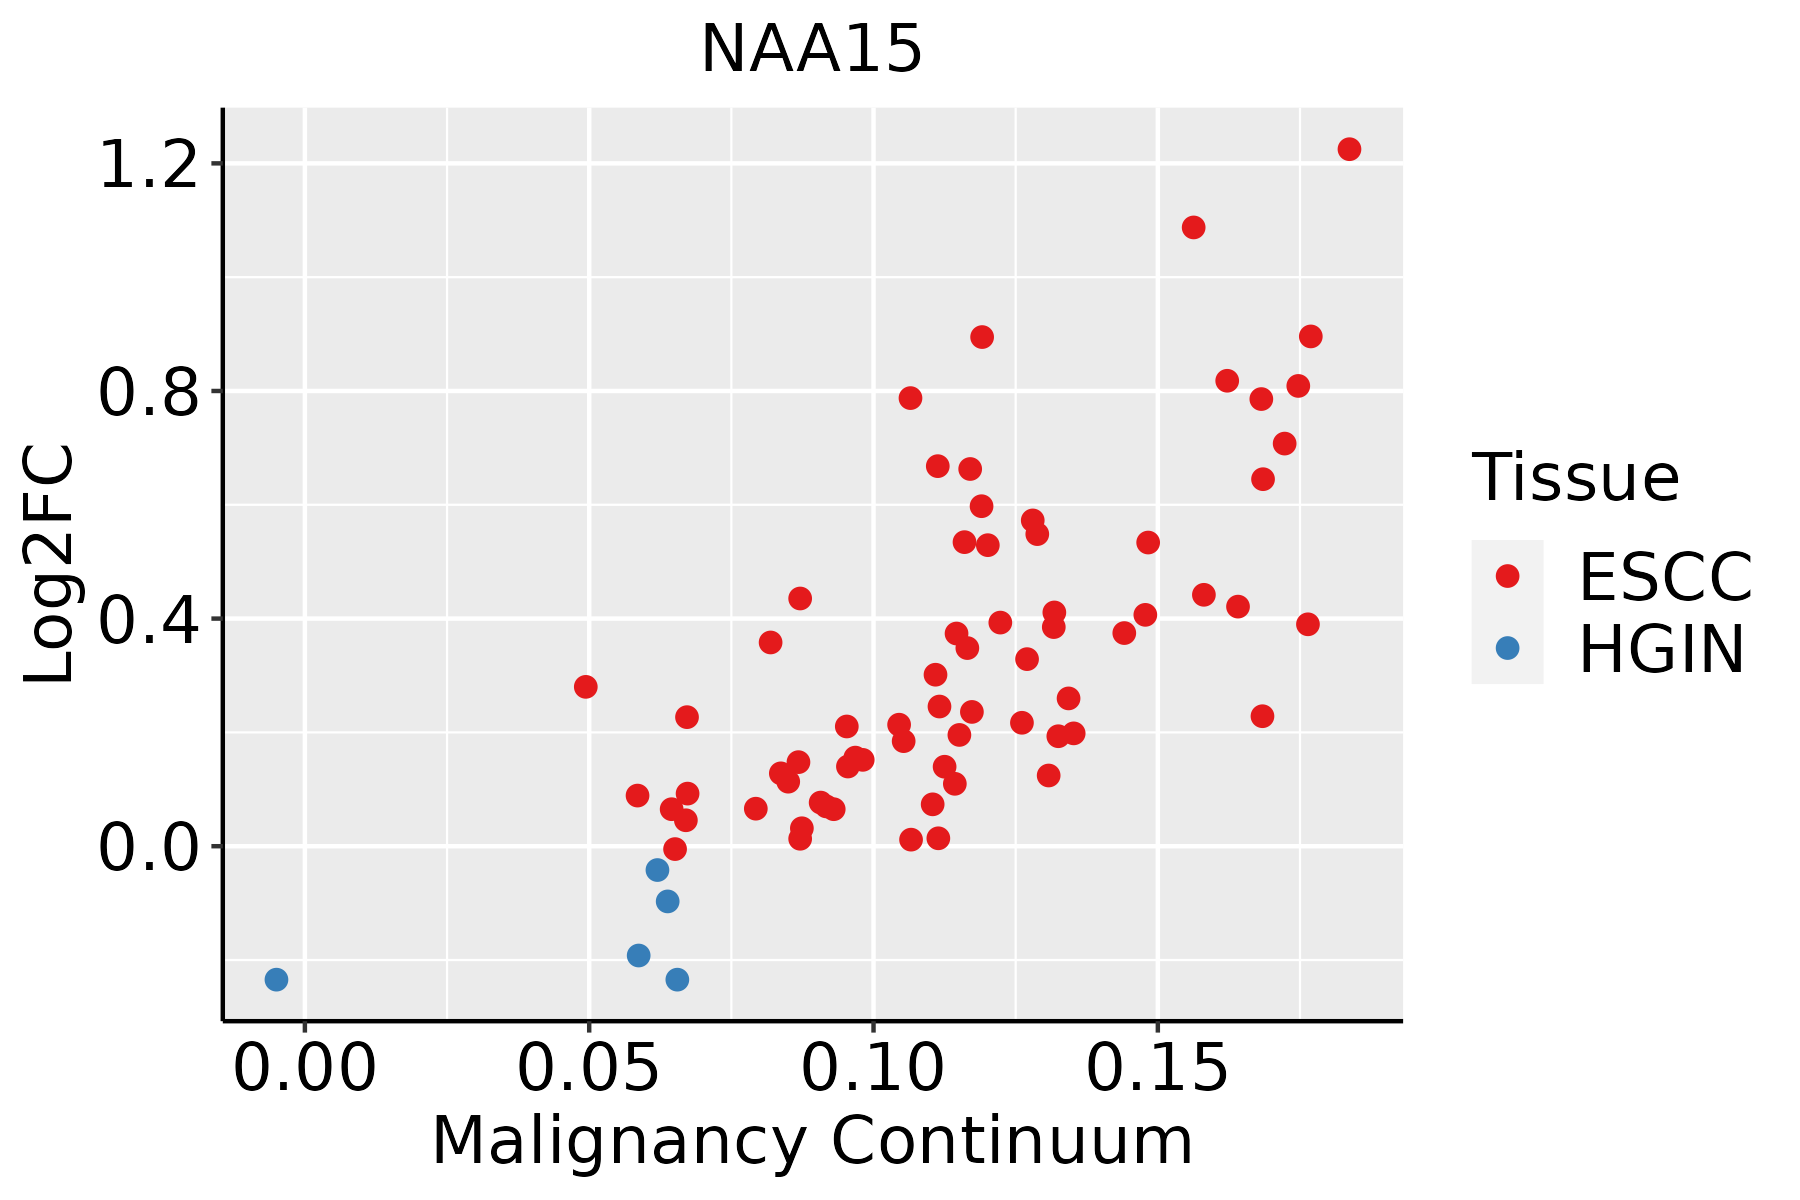 | ESCC: Esophageal squamous cell carcinoma |
| HGIN: High-grade intraepithelial neoplasias | ||
| LGIN: Low-grade intraepithelial neoplasias | ||
| Liver |  | HCC: Hepatocellular carcinoma |
| NAFLD: Non-alcoholic fatty liver disease | ||
| Lung | 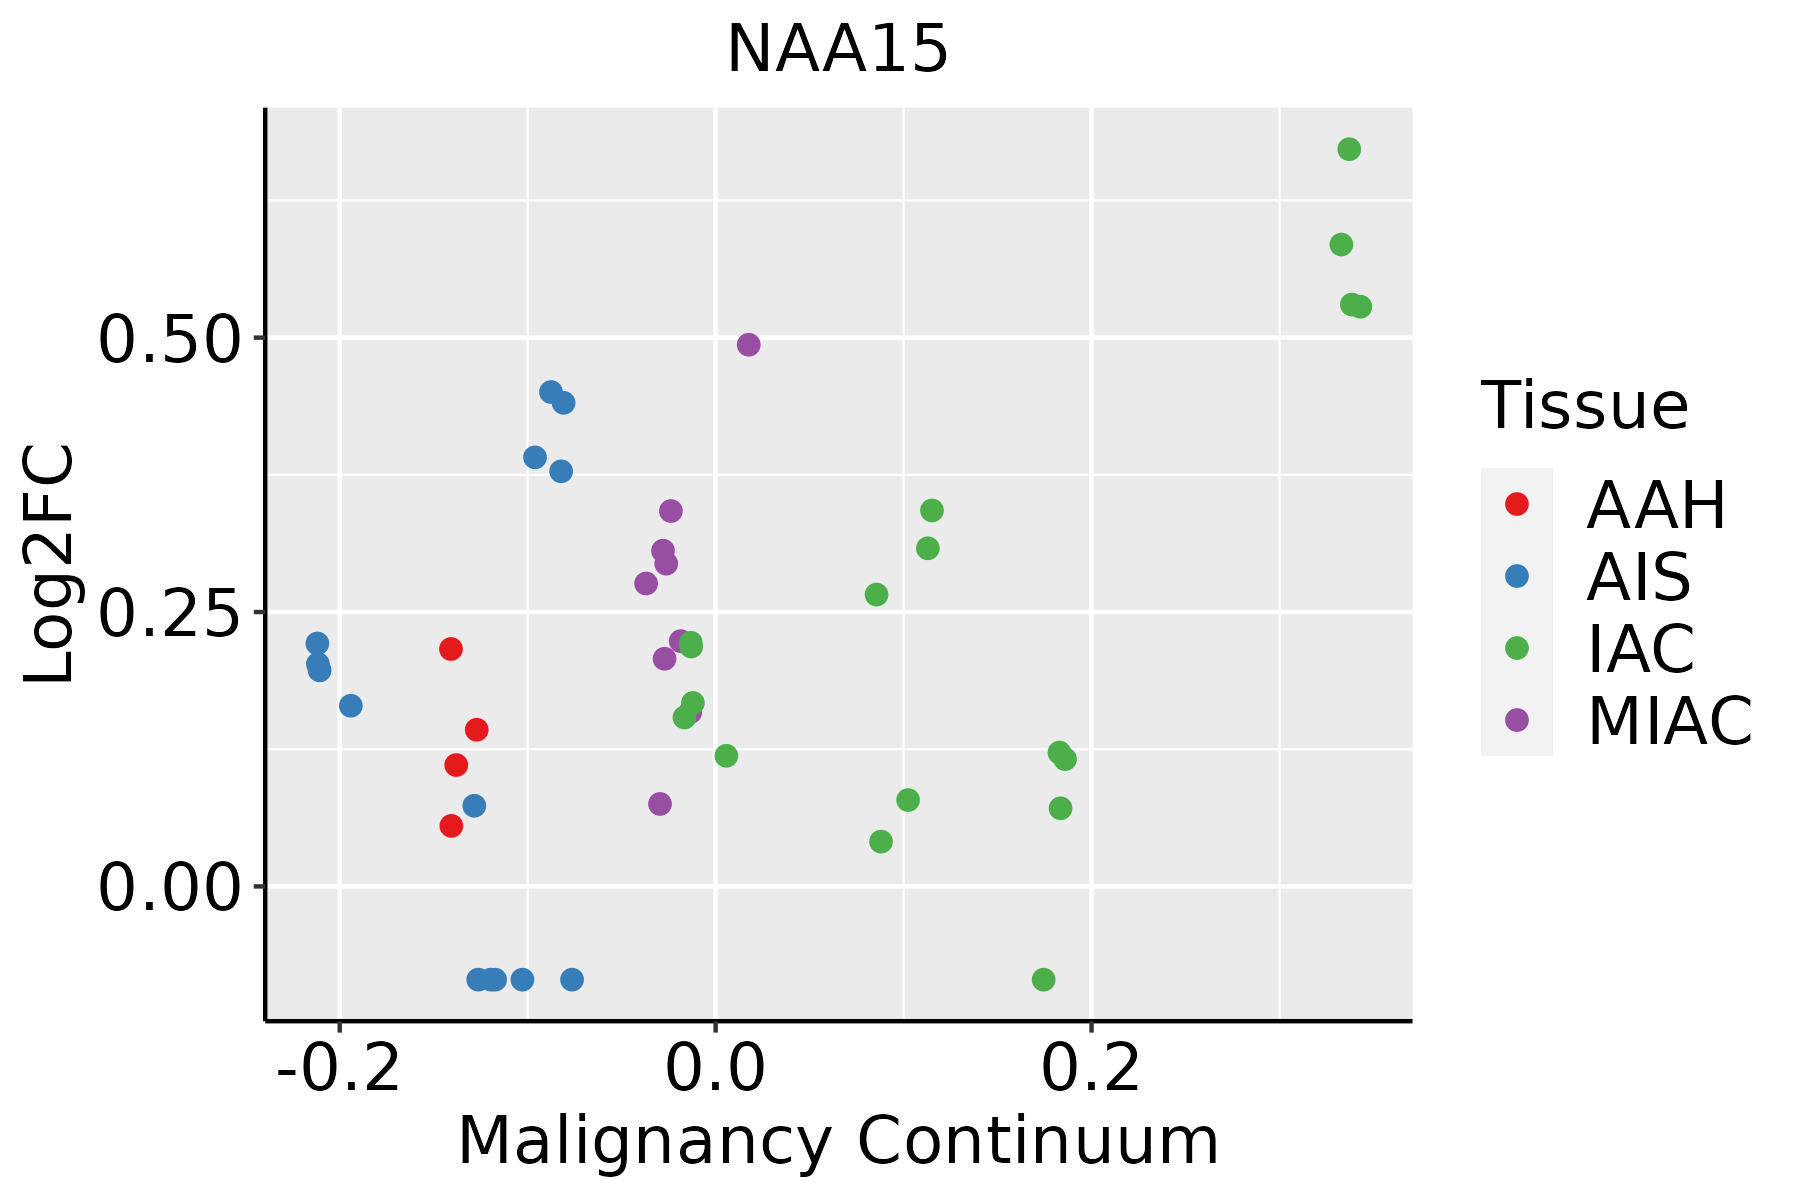 | AAH: Atypical adenomatous hyperplasia |
| AIS: Adenocarcinoma in situ | ||
| IAC: Invasive lung adenocarcinoma | ||
| MIA: Minimally invasive adenocarcinoma | ||
| Oral Cavity | 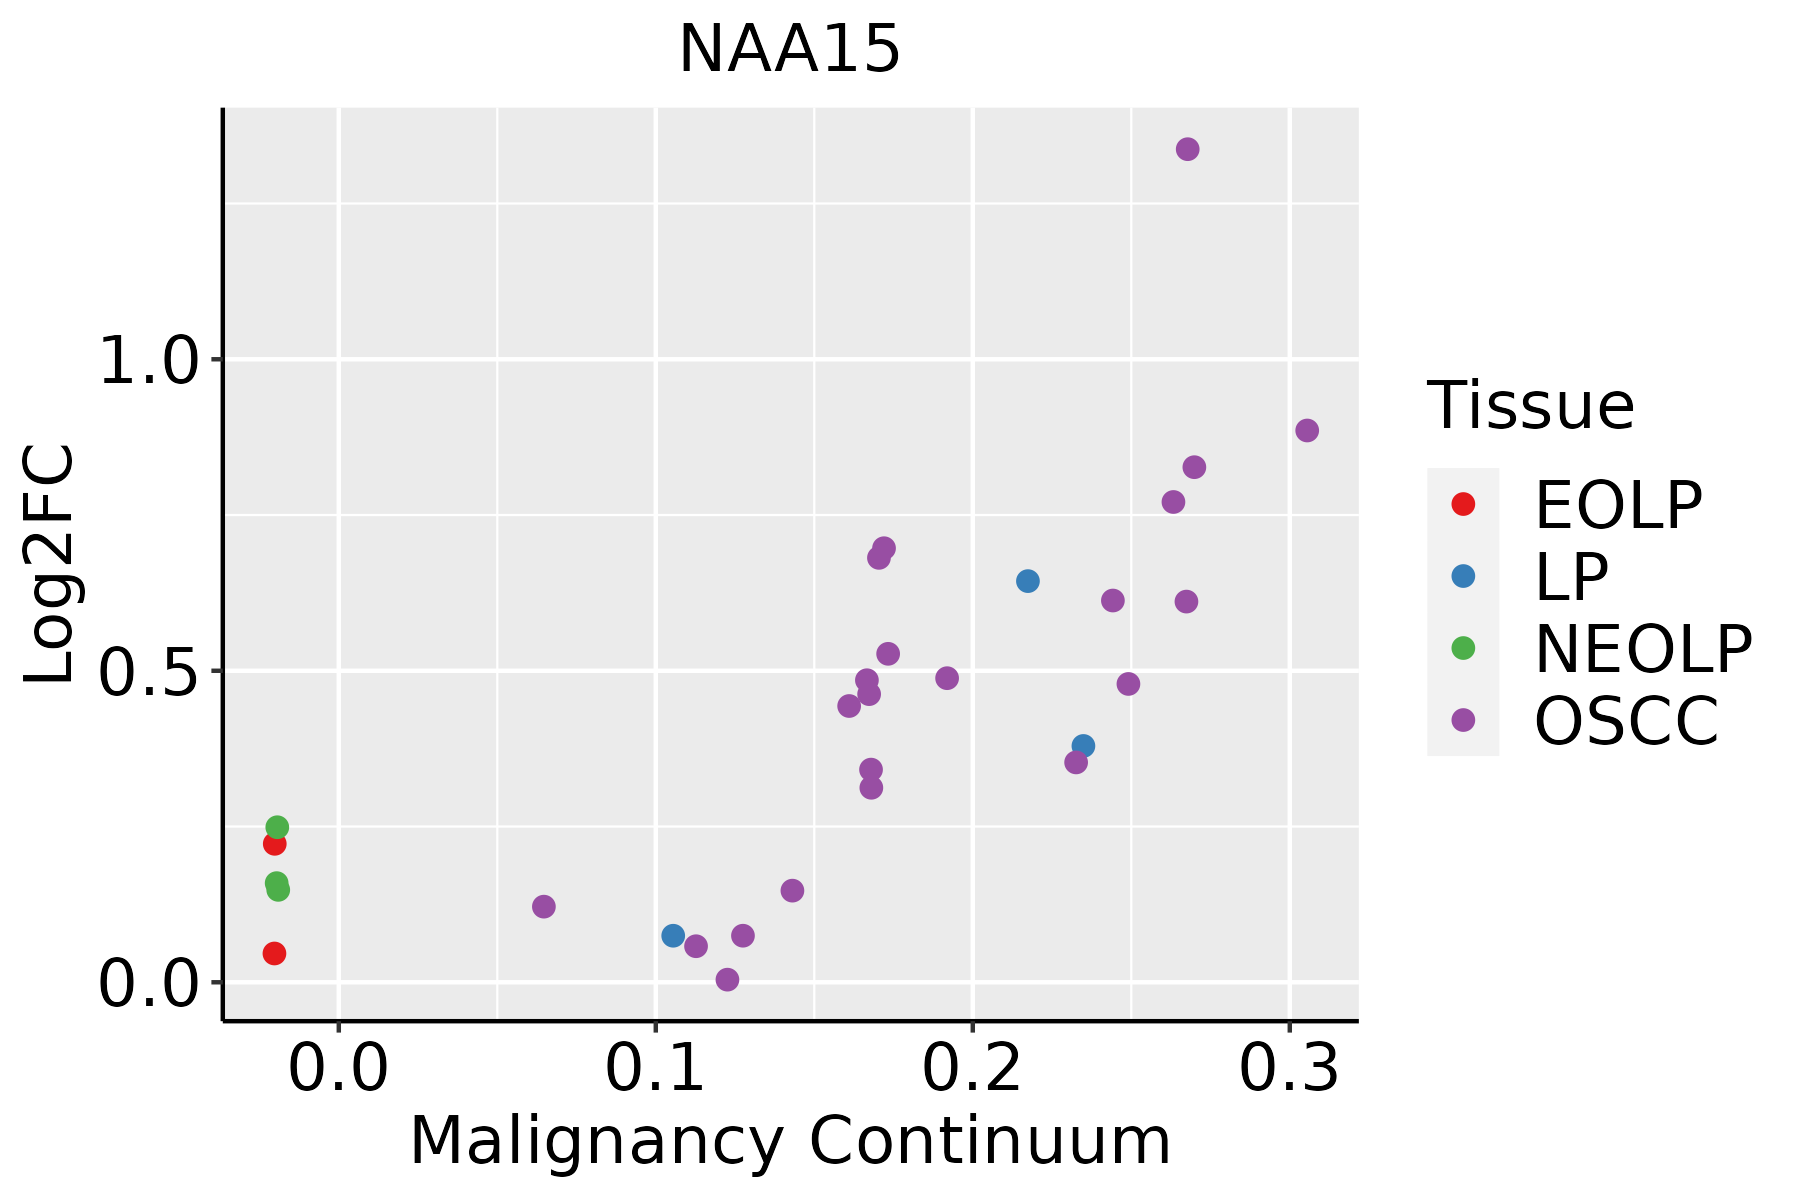 | EOLP: Erosive Oral lichen planus |
| LP: leukoplakia | ||
| NEOLP: Non-erosive oral lichen planus | ||
| OSCC: Oral squamous cell carcinoma | ||
| Skin |  | AK: Actinic keratosis |
| cSCC: Cutaneous squamous cell carcinoma | ||
| SCCIS:squamous cell carcinoma in situ | ||
| Thyroid |  | ATC: Anaplastic thyroid cancer |
| HT: Hashimoto's thyroiditis | ||
| PTC: Papillary thyroid cancer |
| ∗log2FC in expression of this searched gene in stem-like cells from each diseased tissue sample relative to stem-like cells in normal samples in each tissue plotted against the malignancy continuum. Samples are colored based on if they are from different disease stage. |
Top |
Malignant transformation related pathway analysis |
| Find out the enriched GO biological processes and KEGG pathways involved in transition from healthy to precancer to cancer |
| Tissue | Disease Stage | Enriched GO biological Processes |
| Colorectum | AD |  |
| Colorectum | SER |  |
| Colorectum | MSS |  |
| Colorectum | MSI-H |  |
| Colorectum | FAP |  |
| ∗Top 15 enriched GO BP terms are showed in the bar plot of each disease state in each tissue. Each row represents a significant GO biological process which is colored according to the -log10(p.adjust). |
| Page: 1 2 3 4 5 6 7 8 9 |
| GO ID | Tissue | Disease Stage | Description | Gene Ratio | Bg Ratio | pvalue | p.adjust | Count |
| GO:003164710 | Cervix | CC | regulation of protein stability | 63/2311 | 298/18723 | 1.14e-05 | 2.45e-04 | 63 |
| GO:005082110 | Cervix | CC | protein stabilization | 43/2311 | 191/18723 | 5.90e-05 | 8.54e-04 | 43 |
| GO:00516048 | Cervix | CC | protein maturation | 56/2311 | 294/18723 | 5.90e-04 | 5.59e-03 | 56 |
| GO:0031647 | Colorectum | AD | regulation of protein stability | 108/3918 | 298/18723 | 6.33e-10 | 5.08e-08 | 108 |
| GO:0050821 | Colorectum | AD | protein stabilization | 73/3918 | 191/18723 | 3.02e-08 | 1.64e-06 | 73 |
| GO:0051604 | Colorectum | AD | protein maturation | 85/3918 | 294/18723 | 6.73e-04 | 6.91e-03 | 85 |
| GO:00316471 | Colorectum | SER | regulation of protein stability | 86/2897 | 298/18723 | 2.56e-09 | 2.42e-07 | 86 |
| GO:00508211 | Colorectum | SER | protein stabilization | 58/2897 | 191/18723 | 1.46e-07 | 8.59e-06 | 58 |
| GO:00516041 | Colorectum | SER | protein maturation | 73/2897 | 294/18723 | 1.82e-05 | 5.38e-04 | 73 |
| GO:00316472 | Colorectum | MSS | regulation of protein stability | 103/3467 | 298/18723 | 2.52e-11 | 3.49e-09 | 103 |
| GO:00508212 | Colorectum | MSS | protein stabilization | 68/3467 | 191/18723 | 1.53e-08 | 8.81e-07 | 68 |
| GO:00516042 | Colorectum | MSS | protein maturation | 75/3467 | 294/18723 | 1.70e-03 | 1.53e-02 | 75 |
| GO:00508214 | Colorectum | FAP | protein stabilization | 51/2622 | 191/18723 | 2.63e-06 | 9.96e-05 | 51 |
| GO:00316474 | Colorectum | FAP | regulation of protein stability | 70/2622 | 298/18723 | 6.60e-06 | 2.04e-04 | 70 |
| GO:00508215 | Colorectum | CRC | protein stabilization | 44/2078 | 191/18723 | 1.77e-06 | 8.92e-05 | 44 |
| GO:00316475 | Colorectum | CRC | regulation of protein stability | 58/2078 | 298/18723 | 1.38e-05 | 4.37e-04 | 58 |
| GO:00516044 | Colorectum | CRC | protein maturation | 47/2078 | 294/18723 | 6.52e-03 | 4.70e-02 | 47 |
| GO:0031647111 | Esophagus | ESCC | regulation of protein stability | 223/8552 | 298/18723 | 5.76e-25 | 1.52e-22 | 223 |
| GO:0050821111 | Esophagus | ESCC | protein stabilization | 140/8552 | 191/18723 | 6.50e-15 | 3.61e-13 | 140 |
| GO:004354313 | Esophagus | ESCC | protein acylation | 165/8552 | 243/18723 | 1.69e-12 | 7.14e-11 | 165 |
| Page: 1 2 3 4 |
| Pathway ID | Tissue | Disease Stage | Description | Gene Ratio | Bg Ratio | pvalue | p.adjust | qvalue | Count |
| Page: 1 |
Top |
Cell-cell communication analysis |
| Identification of potential cell-cell interactions between two cell types and their ligand-receptor pairs for different disease states |
| Ligand | Receptor | LRpair | Pathway | Tissue | Disease Stage |
| Page: 1 |
Top |
Single-cell gene regulatory network inference analysis |
| Find out the significant the regulons (TFs) and the target genes of each regulon across cell types for different disease states |
| TF | Cell Type | Tissue | Disease Stage | Target Gene | RSS | Regulon Activity |
| ∗The dot plots of a searched regulon are shown for all cell subpopulations in each disease state of each tissue based on the regulon specific score inferred using pySCENIC and by calculating the average expression. |
| Page: 1 |
Top |
Somatic mutation of malignant transformation related genes |
| Annotation of somatic variants for genes involved in malignant transformation |
| Hugo Symbol | Variant Class | Variant Classification | dbSNP RS | HGVSc | HGVSp | HGVSp Short | SWISSPROT | BIOTYPE | SIFT | PolyPhen | Tumor Sample Barcode | Tissue | Histology | Sex | Age | Stage | Therapy Types | Drugs | Outcome |
| NAA15 | SNV | Missense_Mutation | novel | c.208C>T | p.Arg70Cys | p.R70C | Q9BXJ9 | protein_coding | deleterious(0) | probably_damaging(0.973) | TCGA-AN-A046-01 | Breast | breast invasive carcinoma | Female | >=65 | I/II | Unknown | Unknown | SD |
| NAA15 | SNV | Missense_Mutation | c.659N>A | p.Ile220Asn | p.I220N | Q9BXJ9 | protein_coding | deleterious(0) | probably_damaging(0.982) | TCGA-D8-A1XK-01 | Breast | breast invasive carcinoma | Female | <65 | I/II | Chemotherapy | doxorubicine+cyclophosphamide | SD | |
| NAA15 | SNV | Missense_Mutation | c.601N>T | p.Arg201Trp | p.R201W | Q9BXJ9 | protein_coding | deleterious(0.01) | probably_damaging(0.954) | TCGA-D8-A73U-01 | Breast | breast invasive carcinoma | Female | >=65 | I/II | Hormone Therapy | tamoxiphen | SD | |
| NAA15 | SNV | Missense_Mutation | c.1505G>C | p.Gly502Ala | p.G502A | Q9BXJ9 | protein_coding | deleterious(0) | probably_damaging(1) | TCGA-GM-A2D9-01 | Breast | breast invasive carcinoma | Female | >=65 | I/II | Hormone Therapy | arimidex | SD | |
| NAA15 | SNV | Missense_Mutation | novel | c.1863N>T | p.Gln621His | p.Q621H | Q9BXJ9 | protein_coding | deleterious(0.03) | possibly_damaging(0.827) | TCGA-DS-A7WH-01 | Cervix | cervical & endocervical cancer | Female | <65 | I/II | Chemotherapy | cisplatin | CR |
| NAA15 | SNV | Missense_Mutation | c.2464N>A | p.Glu822Lys | p.E822K | Q9BXJ9 | protein_coding | tolerated(0.13) | benign(0.11) | TCGA-EK-A3GJ-01 | Cervix | cervical & endocervical cancer | Female | <65 | I/II | Unknown | Unknown | SD | |
| NAA15 | SNV | Missense_Mutation | c.1014N>C | p.Lys338Asn | p.K338N | Q9BXJ9 | protein_coding | deleterious(0.04) | probably_damaging(0.951) | TCGA-IR-A3LH-01 | Cervix | cervical & endocervical cancer | Female | <65 | I/II | Chemotherapy | cisplatin | CR | |
| NAA15 | SNV | Missense_Mutation | rs367731445 | c.1378N>A | p.Glu460Lys | p.E460K | Q9BXJ9 | protein_coding | tolerated(0.1) | benign(0.052) | TCGA-Q1-A73P-01 | Cervix | cervical & endocervical cancer | Female | <65 | I/II | Unknown | Unknown | SD |
| NAA15 | SNV | Missense_Mutation | c.209G>A | p.Arg70His | p.R70H | Q9BXJ9 | protein_coding | deleterious(0) | probably_damaging(0.973) | TCGA-Q1-A73R-01 | Cervix | cervical & endocervical cancer | Female | <65 | I/II | Unknown | Unknown | SD | |
| NAA15 | SNV | Missense_Mutation | novel | c.503N>T | p.Ala168Val | p.A168V | Q9BXJ9 | protein_coding | tolerated(0.16) | benign(0.019) | TCGA-AA-3845-01 | Colorectum | colon adenocarcinoma | Female | >=65 | I/II | Unknown | Unknown | PD |
| Page: 1 2 3 4 5 6 7 8 9 10 |
Top |
Related drugs of malignant transformation related genes |
| Identification of chemicals and drugs interact with genes involved in malignant transfromation |
| (DGIdb 4.0) |
| Entrez ID | Symbol | Category | Interaction Types | Drug Claim Name | Drug Name | PMIDs |
| Page: 1 |

Copyright 2023-Present -The University of Texas Health Science Center at Houston |