
|
|||||
|
 | |
| |
| |
| |
| |
| |
|
Gene: N4BP3 |
Gene summary for N4BP3 |
| Gene information | Species | Human | Gene symbol | N4BP3 | Gene ID | 23138 |
| Gene name | NEDD4 binding protein 3 | |
| Gene Alias | LZTS4 | |
| Cytomap | 5q35.3 | |
| Gene Type | protein-coding | GO ID | GO:0007275 | UniProtAcc | O15049 |
Top |
Malignant transformation analysis |
| Identification of the aberrant gene expression in precancerous and cancerous lesions by comparing the gene expression of stem-like cells in diseased tissues with normal stem cells |
| Entrez ID | Symbol | Replicates | Species | Organ | Tissue | Adj P-value | Log2FC | Malignancy |
| 23138 | N4BP3 | HTA11_3410_2000001011 | Human | Colorectum | AD | 5.97e-32 | 5.53e-01 | 0.0155 |
| 23138 | N4BP3 | HTA11_2487_2000001011 | Human | Colorectum | SER | 9.55e-18 | 4.12e-01 | -0.1808 |
| 23138 | N4BP3 | HTA11_2951_2000001011 | Human | Colorectum | AD | 1.84e-10 | 4.85e-01 | 0.0216 |
| 23138 | N4BP3 | HTA11_1938_2000001011 | Human | Colorectum | AD | 4.48e-27 | 7.34e-01 | -0.0811 |
| 23138 | N4BP3 | HTA11_347_2000001011 | Human | Colorectum | AD | 3.08e-28 | 4.88e-01 | -0.1954 |
| 23138 | N4BP3 | HTA11_411_2000001011 | Human | Colorectum | SER | 6.42e-18 | 1.04e+00 | -0.2602 |
| 23138 | N4BP3 | HTA11_2112_2000001011 | Human | Colorectum | SER | 1.50e-04 | 3.61e-01 | -0.2196 |
| 23138 | N4BP3 | HTA11_3361_2000001011 | Human | Colorectum | AD | 5.46e-22 | 6.00e-01 | -0.1207 |
| 23138 | N4BP3 | HTA11_83_2000001011 | Human | Colorectum | SER | 8.54e-17 | 5.58e-01 | -0.1526 |
| 23138 | N4BP3 | HTA11_696_2000001011 | Human | Colorectum | AD | 4.51e-40 | 7.88e-01 | -0.1464 |
| 23138 | N4BP3 | HTA11_866_2000001011 | Human | Colorectum | AD | 4.02e-18 | 3.61e-01 | -0.1001 |
| 23138 | N4BP3 | HTA11_1391_2000001011 | Human | Colorectum | AD | 1.70e-18 | 4.15e-01 | -0.059 |
| 23138 | N4BP3 | HTA11_2992_2000001011 | Human | Colorectum | SER | 4.22e-23 | 8.58e-01 | -0.1706 |
| 23138 | N4BP3 | HTA11_5212_2000001011 | Human | Colorectum | AD | 1.08e-24 | 9.15e-01 | -0.2061 |
| 23138 | N4BP3 | HTA11_5216_2000001011 | Human | Colorectum | SER | 5.22e-30 | 1.37e+00 | -0.1462 |
| 23138 | N4BP3 | HTA11_546_2000001011 | Human | Colorectum | AD | 2.07e-24 | 7.63e-01 | -0.0842 |
| 23138 | N4BP3 | HTA11_10711_2000001011 | Human | Colorectum | AD | 4.64e-04 | 1.49e-01 | 0.0338 |
| 23138 | N4BP3 | HTA11_7696_3000711011 | Human | Colorectum | AD | 4.25e-05 | 1.24e-01 | 0.0674 |
| 23138 | N4BP3 | HTA11_6818_2000001011 | Human | Colorectum | AD | 4.13e-05 | 2.68e-01 | 0.0112 |
| 23138 | N4BP3 | HTA11_6818_2000001021 | Human | Colorectum | AD | 6.03e-04 | 1.89e-01 | 0.0588 |
| Page: 1 2 3 |
| Tissue | Expression Dynamics | Abbreviation |
| Colorectum (GSE201348) |  | FAP: Familial adenomatous polyposis |
| CRC: Colorectal cancer | ||
| Colorectum (HTA11) |  | AD: Adenomas |
| SER: Sessile serrated lesions | ||
| MSI-H: Microsatellite-high colorectal cancer | ||
| MSS: Microsatellite stable colorectal cancer | ||
| Esophagus | 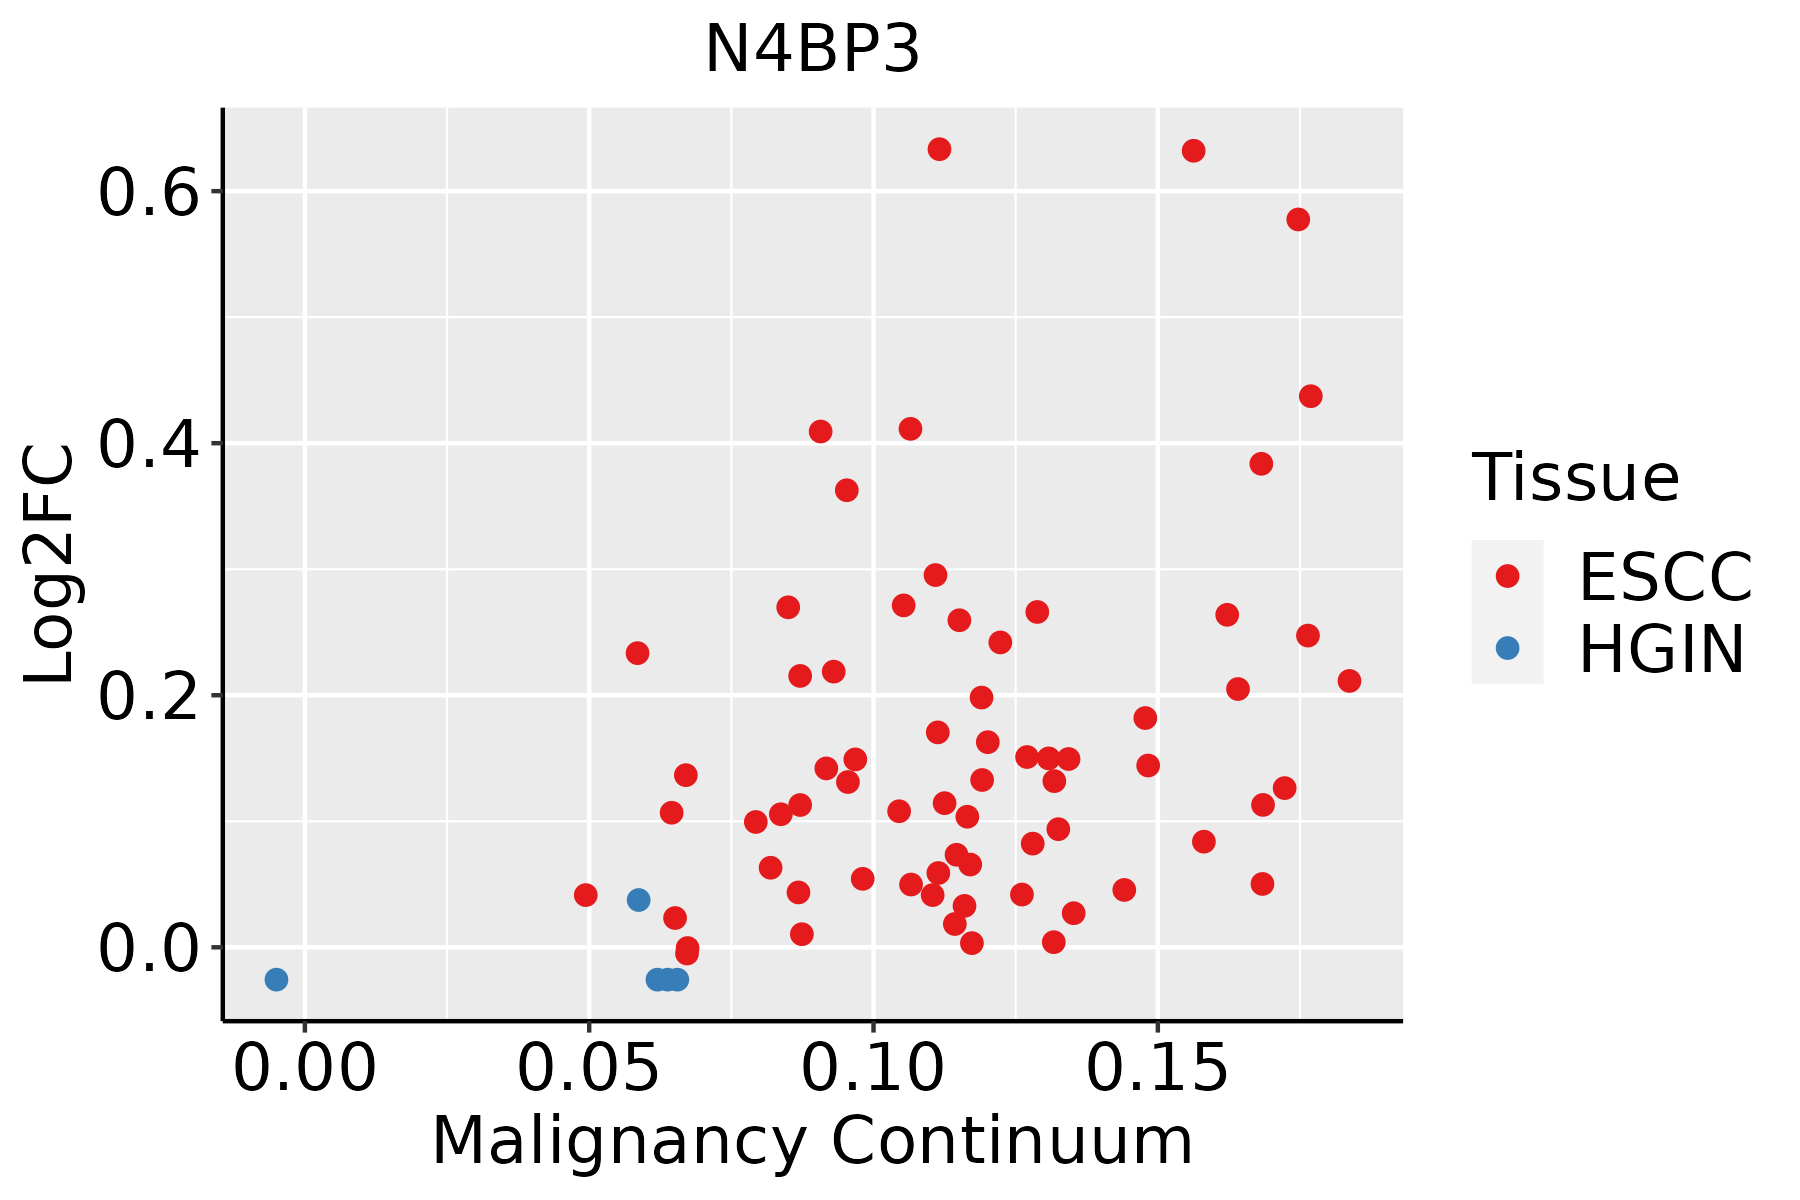 | ESCC: Esophageal squamous cell carcinoma |
| HGIN: High-grade intraepithelial neoplasias | ||
| LGIN: Low-grade intraepithelial neoplasias |
| ∗log2FC in expression of this searched gene in stem-like cells from each diseased tissue sample relative to stem-like cells in normal samples in each tissue plotted against the malignancy continuum. Samples are colored based on if they are from different disease stage. |
Top |
Malignant transformation related pathway analysis |
| Find out the enriched GO biological processes and KEGG pathways involved in transition from healthy to precancer to cancer |
| Tissue | Disease Stage | Enriched GO biological Processes |
| Colorectum | AD |  |
| Colorectum | SER |  |
| Colorectum | MSS |  |
| Colorectum | MSI-H |  |
| Colorectum | FAP |  |
| ∗Top 15 enriched GO BP terms are showed in the bar plot of each disease state in each tissue. Each row represents a significant GO biological process which is colored according to the -log10(p.adjust). |
| Page: 1 2 3 4 5 6 7 8 9 |
| GO ID | Tissue | Disease Stage | Description | Gene Ratio | Bg Ratio | pvalue | p.adjust | Count |
| Page: 1 |
| Pathway ID | Tissue | Disease Stage | Description | Gene Ratio | Bg Ratio | pvalue | p.adjust | qvalue | Count |
| Page: 1 |
Top |
Cell-cell communication analysis |
| Identification of potential cell-cell interactions between two cell types and their ligand-receptor pairs for different disease states |
| Ligand | Receptor | LRpair | Pathway | Tissue | Disease Stage |
| Page: 1 |
Top |
Single-cell gene regulatory network inference analysis |
| Find out the significant the regulons (TFs) and the target genes of each regulon across cell types for different disease states |
| TF | Cell Type | Tissue | Disease Stage | Target Gene | RSS | Regulon Activity |
| ∗The dot plots of a searched regulon are shown for all cell subpopulations in each disease state of each tissue based on the regulon specific score inferred using pySCENIC and by calculating the average expression. |
| Page: 1 |
Top |
Somatic mutation of malignant transformation related genes |
| Annotation of somatic variants for genes involved in malignant transformation |
| Hugo Symbol | Variant Class | Variant Classification | dbSNP RS | HGVSc | HGVSp | HGVSp Short | SWISSPROT | BIOTYPE | SIFT | PolyPhen | Tumor Sample Barcode | Tissue | Histology | Sex | Age | Stage | Therapy Types | Drugs | Outcome |
| N4BP3 | SNV | Missense_Mutation | rs772816113 | c.496N>G | p.Gln166Glu | p.Q166E | O15049 | protein_coding | tolerated(1) | benign(0) | TCGA-5L-AAT1-01 | Breast | breast invasive carcinoma | Female | <65 | III/IV | Hormone Therapy | letrozol | SD |
| N4BP3 | SNV | Missense_Mutation | rs769334283 | c.1225C>T | p.Arg409Trp | p.R409W | O15049 | protein_coding | deleterious(0) | probably_damaging(0.999) | TCGA-B6-A0WT-01 | Breast | breast invasive carcinoma | Female | <65 | I/II | Unknown | Unknown | PD |
| N4BP3 | insertion | Nonsense_Mutation | novel | c.260_261insGT | p.Tyr87Ter | p.Y87* | O15049 | protein_coding | TCGA-A8-A07G-01 | Breast | breast invasive carcinoma | Female | >=65 | I/II | Chemotherapy | 5-fluorouracil | CR | ||
| N4BP3 | SNV | Missense_Mutation | rs201012815 | c.335G>A | p.Arg112His | p.R112H | O15049 | protein_coding | deleterious(0.05) | probably_damaging(0.988) | TCGA-2W-A8YY-01 | Cervix | cervical & endocervical cancer | Female | <65 | I/II | Chemotherapy | cisplatin | CR |
| N4BP3 | SNV | Missense_Mutation | rs772816113 | c.496N>G | p.Gln166Glu | p.Q166E | O15049 | protein_coding | tolerated(1) | benign(0) | TCGA-C5-A1BJ-01 | Cervix | cervical & endocervical cancer | Female | <65 | I/II | Unknown | Unknown | SD |
| N4BP3 | deletion | In_Frame_Del | novel | c.1406_1414delGGGCTGAGC | p.Arg469_Glu471del | p.R469_E471del | O15049 | protein_coding | TCGA-DS-A1OD-01 | Cervix | cervical & endocervical cancer | Female | <65 | I/II | Chemotherapy | cisplatin | SD | ||
| N4BP3 | SNV | Missense_Mutation | c.4N>A | p.Ala2Thr | p.A2T | O15049 | protein_coding | tolerated_low_confidence(0.1) | benign(0.214) | TCGA-D5-6928-01 | Colorectum | colon adenocarcinoma | Male | >=65 | I/II | Unknown | Unknown | SD | |
| N4BP3 | SNV | Missense_Mutation | rs187860405 | c.1187C>T | p.Ala396Val | p.A396V | O15049 | protein_coding | deleterious(0.03) | probably_damaging(0.936) | TCGA-AG-A002-01 | Colorectum | rectum adenocarcinoma | Male | <65 | I/II | Unknown | Unknown | SD |
| N4BP3 | SNV | Missense_Mutation | novel | c.916C>T | p.His306Tyr | p.H306Y | O15049 | protein_coding | deleterious(0.01) | benign(0.265) | TCGA-AJ-A3EK-01 | Endometrium | uterine corpus endometrioid carcinoma | Female | <65 | I/II | Chemotherapy | carboplatin | CR |
| N4BP3 | SNV | Missense_Mutation | rs374053735 | c.404N>T | p.Ala135Val | p.A135V | O15049 | protein_coding | tolerated(0.2) | benign(0.444) | TCGA-AJ-A3EL-01 | Endometrium | uterine corpus endometrioid carcinoma | Female | <65 | I/II | Unknown | Unknown | SD |
| Page: 1 2 3 4 5 |
Top |
Related drugs of malignant transformation related genes |
| Identification of chemicals and drugs interact with genes involved in malignant transfromation |
| (DGIdb 4.0) |
| Entrez ID | Symbol | Category | Interaction Types | Drug Claim Name | Drug Name | PMIDs |
| Page: 1 |

Copyright 2023-Present -The University of Texas Health Science Center at Houston |