
|
|||||
|
 | |
| |
| |
| |
| |
| |
|
Gene: MZT2A |
Gene summary for MZT2A |
| Gene information | Species | Human | Gene symbol | MZT2A | Gene ID | 653784 |
| Gene name | mitotic spindle organizing protein 2A | |
| Gene Alias | FAM128A | |
| Cytomap | 2q21.1 | |
| Gene Type | protein-coding | GO ID | GO:0000930 | UniProtAcc | Q6P582 |
Top |
Malignant transformation analysis |
| Identification of the aberrant gene expression in precancerous and cancerous lesions by comparing the gene expression of stem-like cells in diseased tissues with normal stem cells |
| Entrez ID | Symbol | Replicates | Species | Organ | Tissue | Adj P-value | Log2FC | Malignancy |
| 653784 | MZT2A | GSM4909281 | Human | Breast | IDC | 2.02e-19 | 5.14e-01 | 0.21 |
| 653784 | MZT2A | GSM4909286 | Human | Breast | IDC | 1.79e-03 | 2.25e-01 | 0.1081 |
| 653784 | MZT2A | GSM4909291 | Human | Breast | IDC | 7.08e-03 | 3.23e-01 | 0.1753 |
| 653784 | MZT2A | GSM4909294 | Human | Breast | IDC | 8.26e-10 | -2.11e-03 | 0.2022 |
| 653784 | MZT2A | GSM4909296 | Human | Breast | IDC | 3.62e-15 | -3.91e-02 | 0.1524 |
| 653784 | MZT2A | GSM4909297 | Human | Breast | IDC | 1.33e-23 | -1.05e-01 | 0.1517 |
| 653784 | MZT2A | GSM4909301 | Human | Breast | IDC | 2.04e-30 | 5.12e-01 | 0.1577 |
| 653784 | MZT2A | GSM4909304 | Human | Breast | IDC | 1.92e-47 | 7.10e-01 | 0.1636 |
| 653784 | MZT2A | GSM4909306 | Human | Breast | IDC | 1.85e-24 | 5.93e-01 | 0.1564 |
| 653784 | MZT2A | GSM4909307 | Human | Breast | IDC | 3.51e-02 | 1.98e-01 | 0.1569 |
| 653784 | MZT2A | GSM4909308 | Human | Breast | IDC | 1.59e-08 | 4.27e-01 | 0.158 |
| 653784 | MZT2A | GSM4909311 | Human | Breast | IDC | 2.23e-46 | -1.44e-01 | 0.1534 |
| 653784 | MZT2A | GSM4909312 | Human | Breast | IDC | 9.15e-19 | -3.09e-02 | 0.1552 |
| 653784 | MZT2A | GSM4909313 | Human | Breast | IDC | 4.21e-05 | 1.73e-01 | 0.0391 |
| 653784 | MZT2A | GSM4909315 | Human | Breast | IDC | 3.41e-07 | 3.47e-01 | 0.21 |
| 653784 | MZT2A | GSM4909316 | Human | Breast | IDC | 2.11e-09 | 3.17e-01 | 0.21 |
| 653784 | MZT2A | GSM4909317 | Human | Breast | IDC | 1.18e-02 | 3.35e-01 | 0.1355 |
| 653784 | MZT2A | GSM4909318 | Human | Breast | IDC | 1.64e-06 | 4.69e-01 | 0.2031 |
| 653784 | MZT2A | GSM4909319 | Human | Breast | IDC | 4.19e-47 | -4.56e-01 | 0.1563 |
| 653784 | MZT2A | GSM4909320 | Human | Breast | IDC | 4.85e-12 | 3.47e-01 | 0.1575 |
| Page: 1 2 3 4 5 6 7 8 9 10 11 12 13 |
| Tissue | Expression Dynamics | Abbreviation |
| Breast | 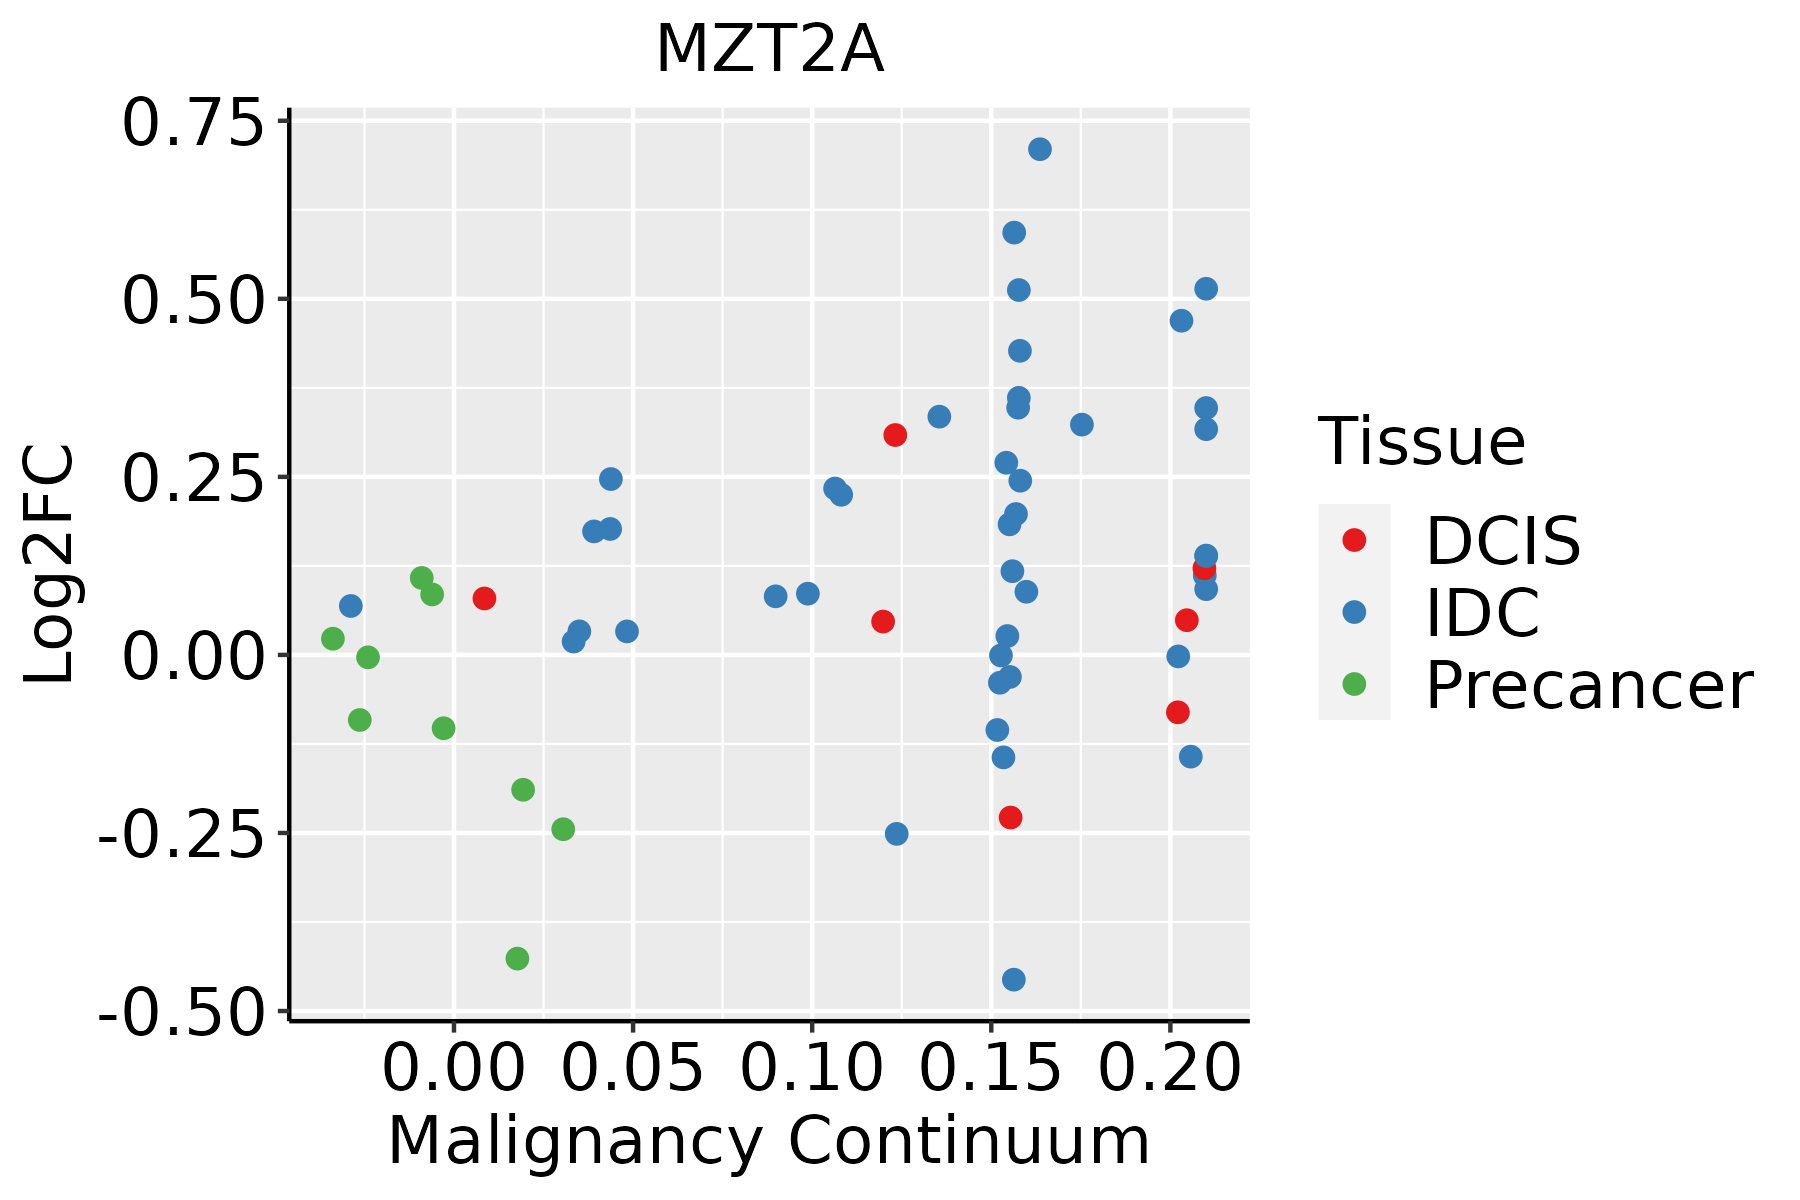 | IDC: Invasive ductal carcinoma |
| DCIS: Ductal carcinoma in situ | ||
| Precancer(BRCA1-mut): Precancerous lesion from BRCA1 mutation carriers | ||
| Colorectum (GSE201348) |  | FAP: Familial adenomatous polyposis |
| CRC: Colorectal cancer | ||
| Colorectum (HTA11) | 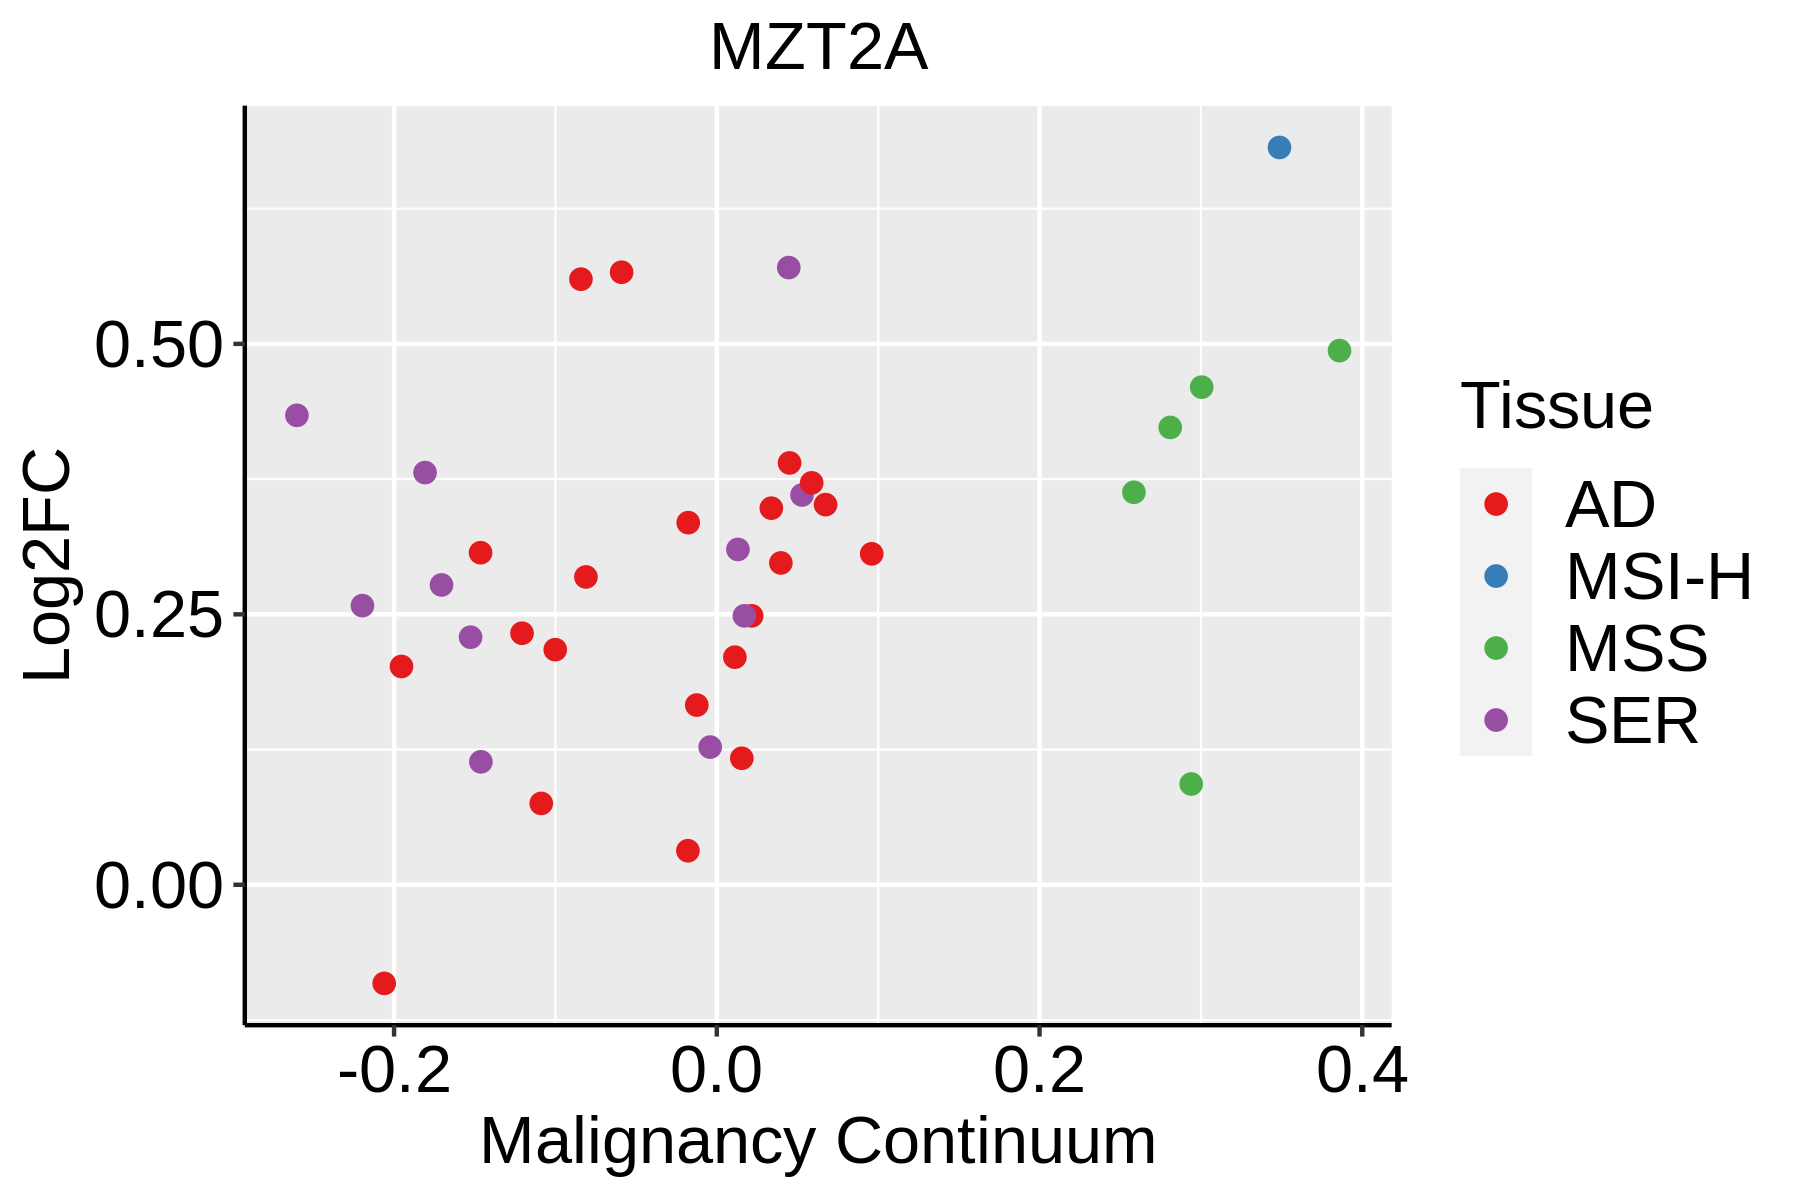 | AD: Adenomas |
| SER: Sessile serrated lesions | ||
| MSI-H: Microsatellite-high colorectal cancer | ||
| MSS: Microsatellite stable colorectal cancer | ||
| Endometrium | 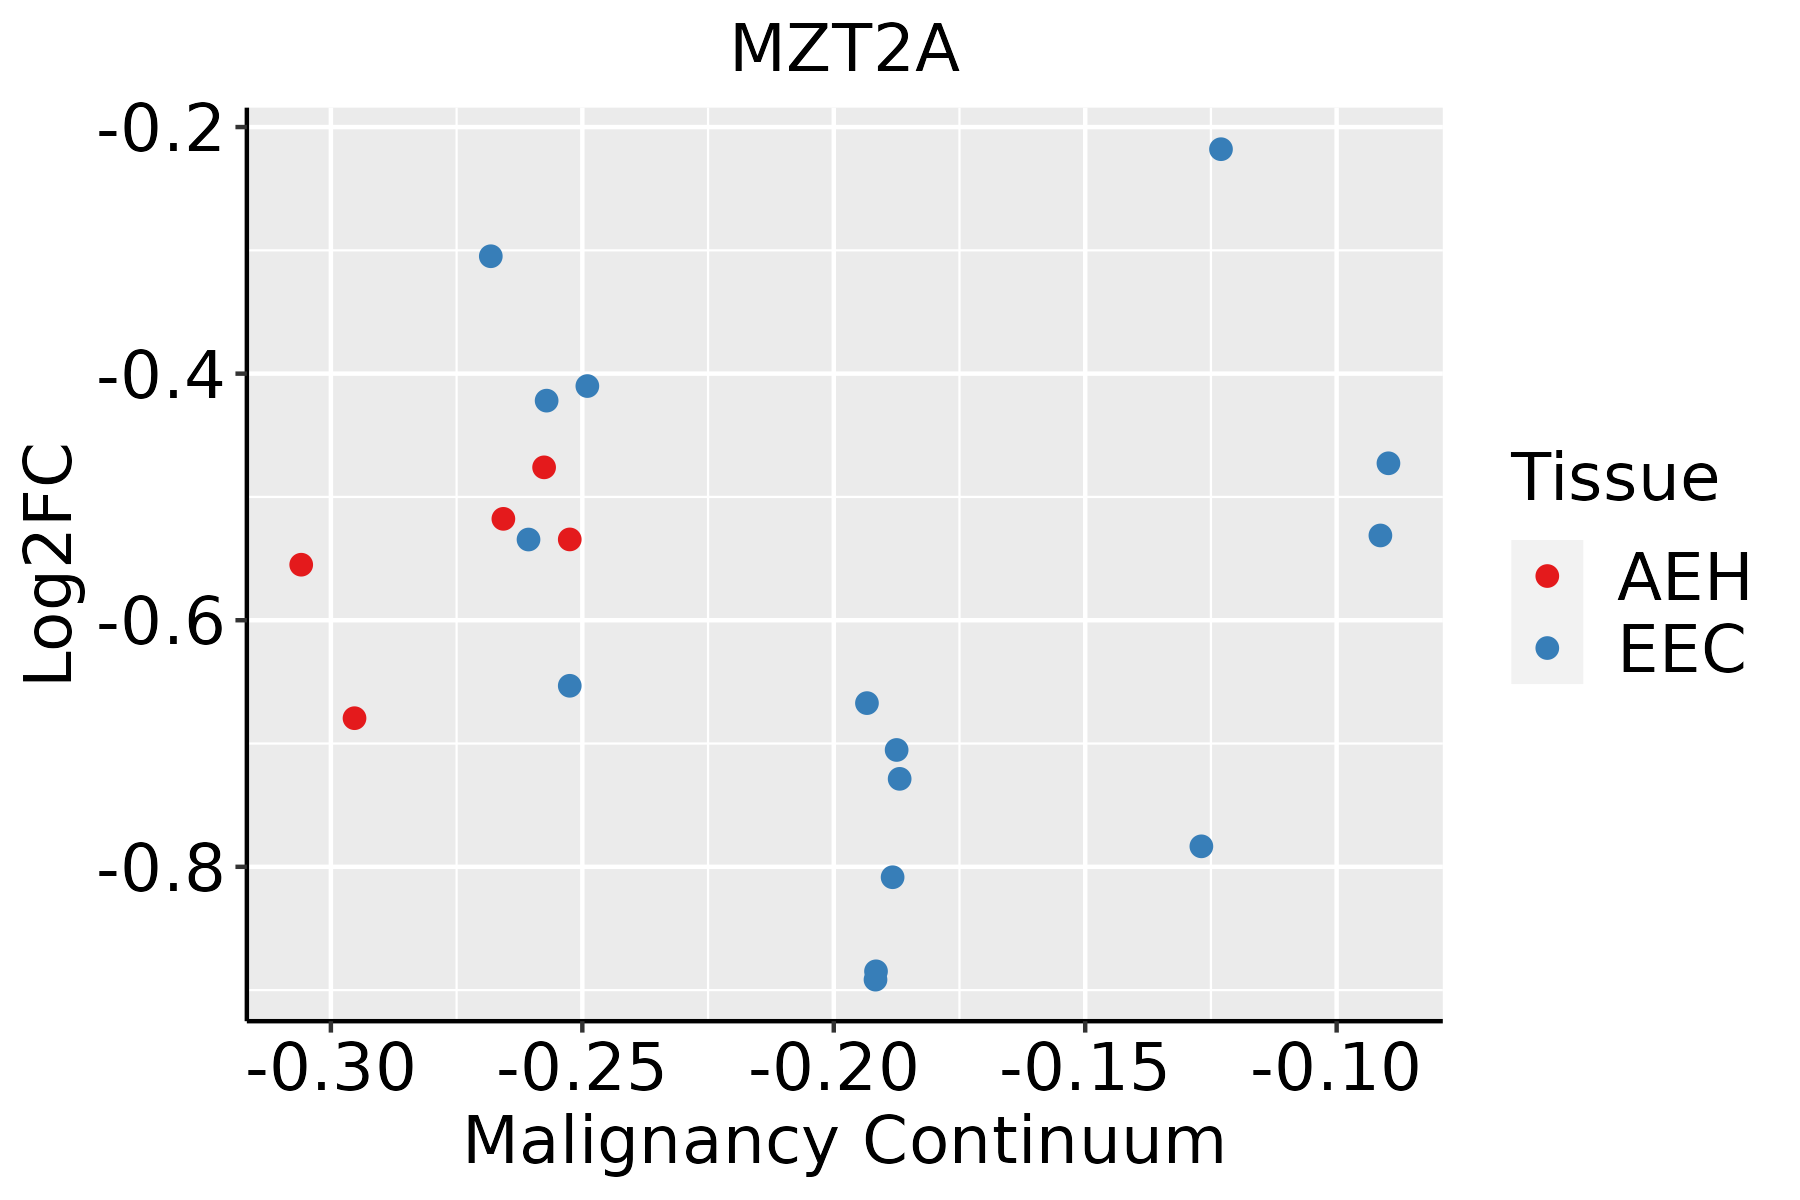 | AEH: Atypical endometrial hyperplasia |
| EEC: Endometrioid Cancer | ||
| Esophagus | 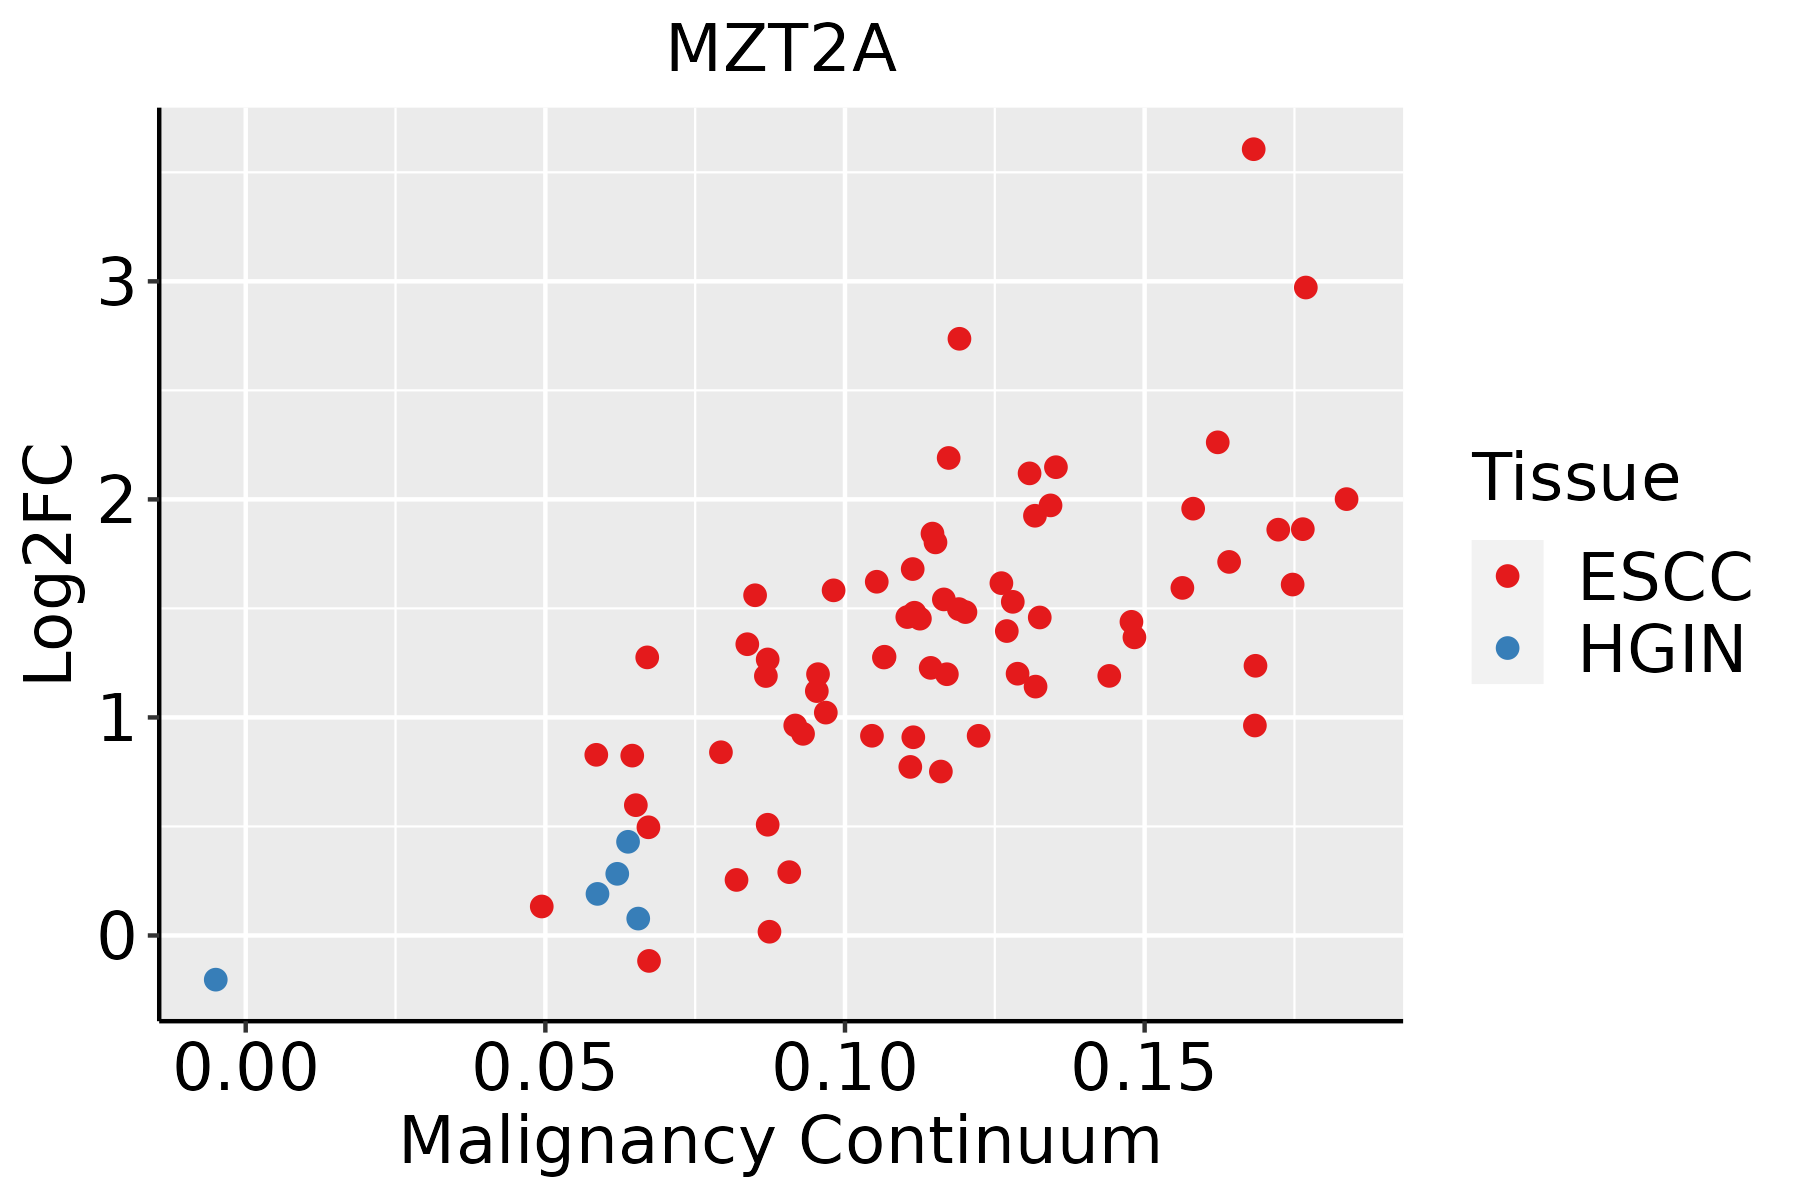 | ESCC: Esophageal squamous cell carcinoma |
| HGIN: High-grade intraepithelial neoplasias | ||
| LGIN: Low-grade intraepithelial neoplasias | ||
| GC | 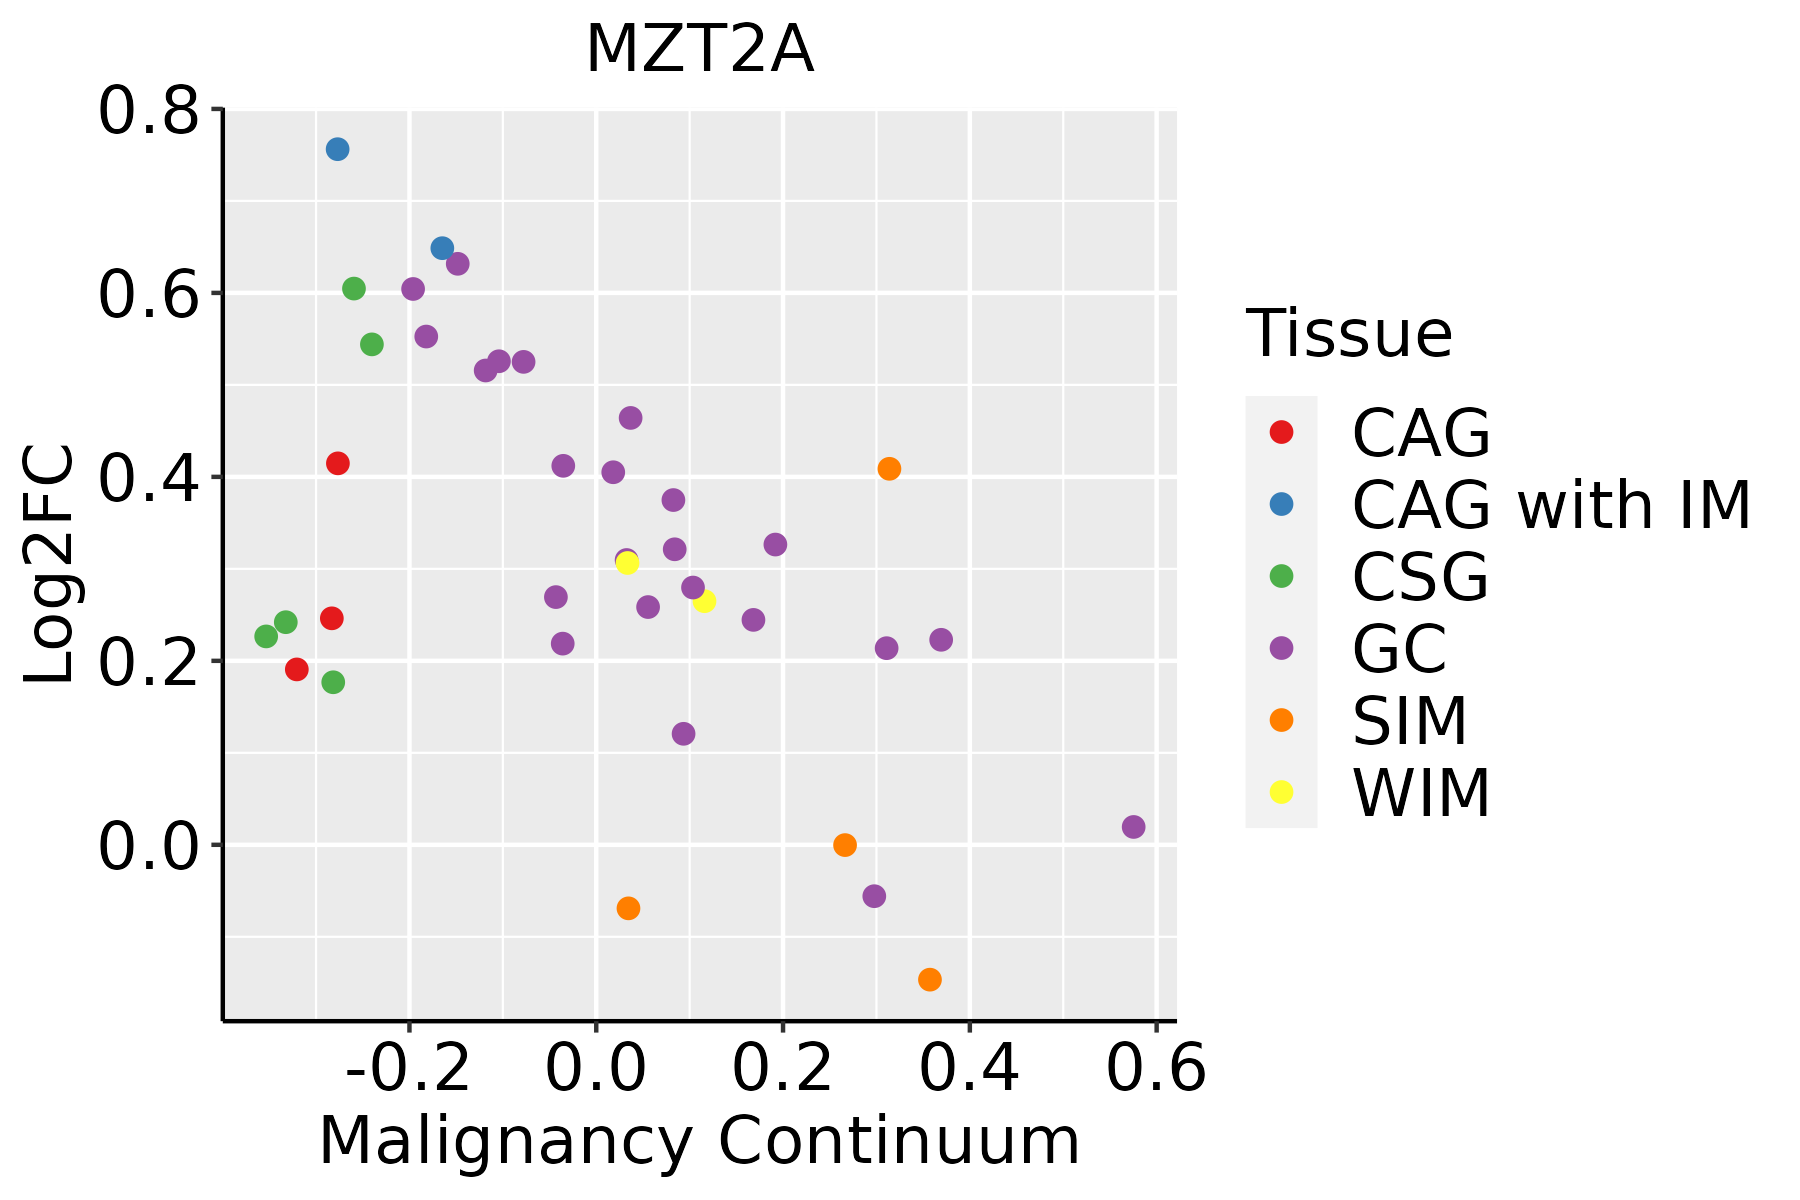 | CAG: Chronic atrophic gastritis |
| CAG with IM: Chronic atrophic gastritis with intestinal metaplasia | ||
| CSG: Chronic superficial gastritis | ||
| GC: Gastric cancer | ||
| SIM: Severe intestinal metaplasia | ||
| WIM: Wild intestinal metaplasia | ||
| Liver | 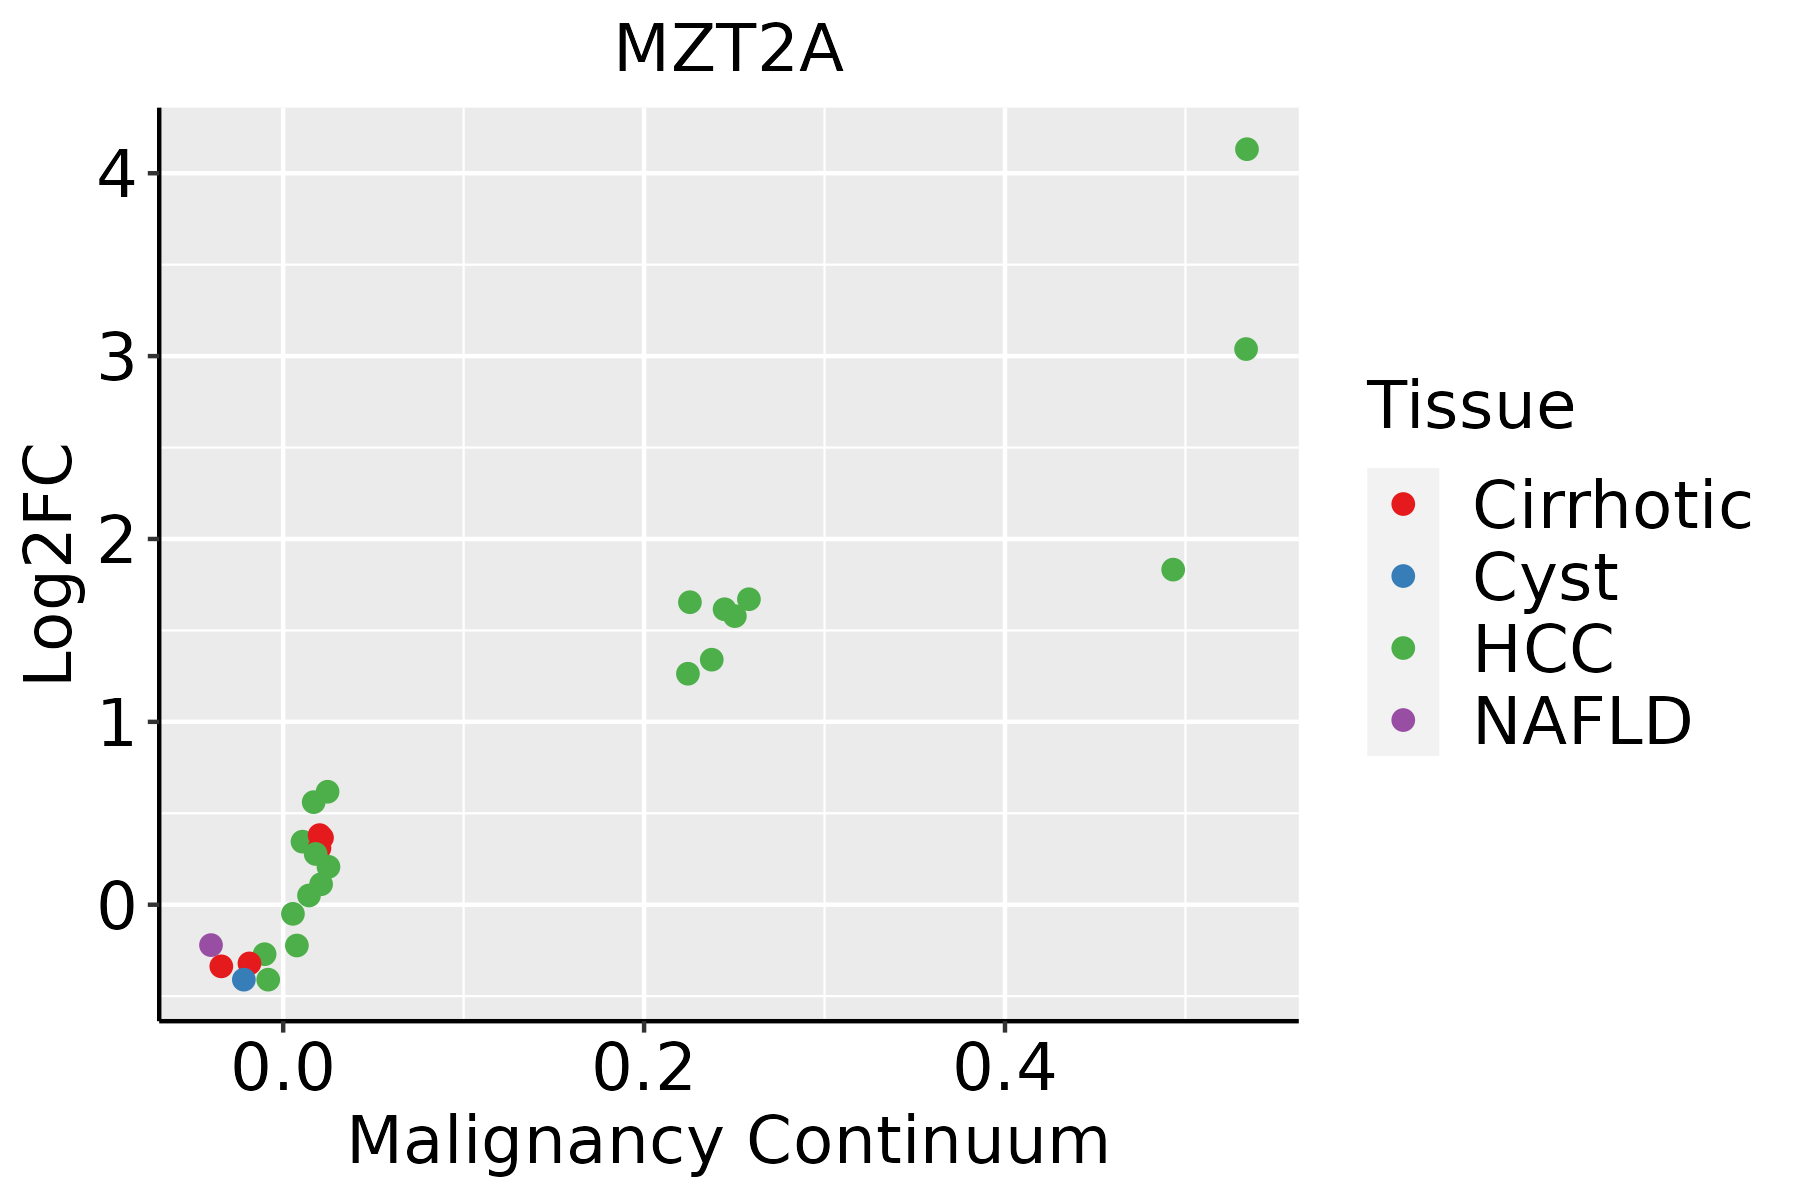 | HCC: Hepatocellular carcinoma |
| NAFLD: Non-alcoholic fatty liver disease | ||
| Oral Cavity | 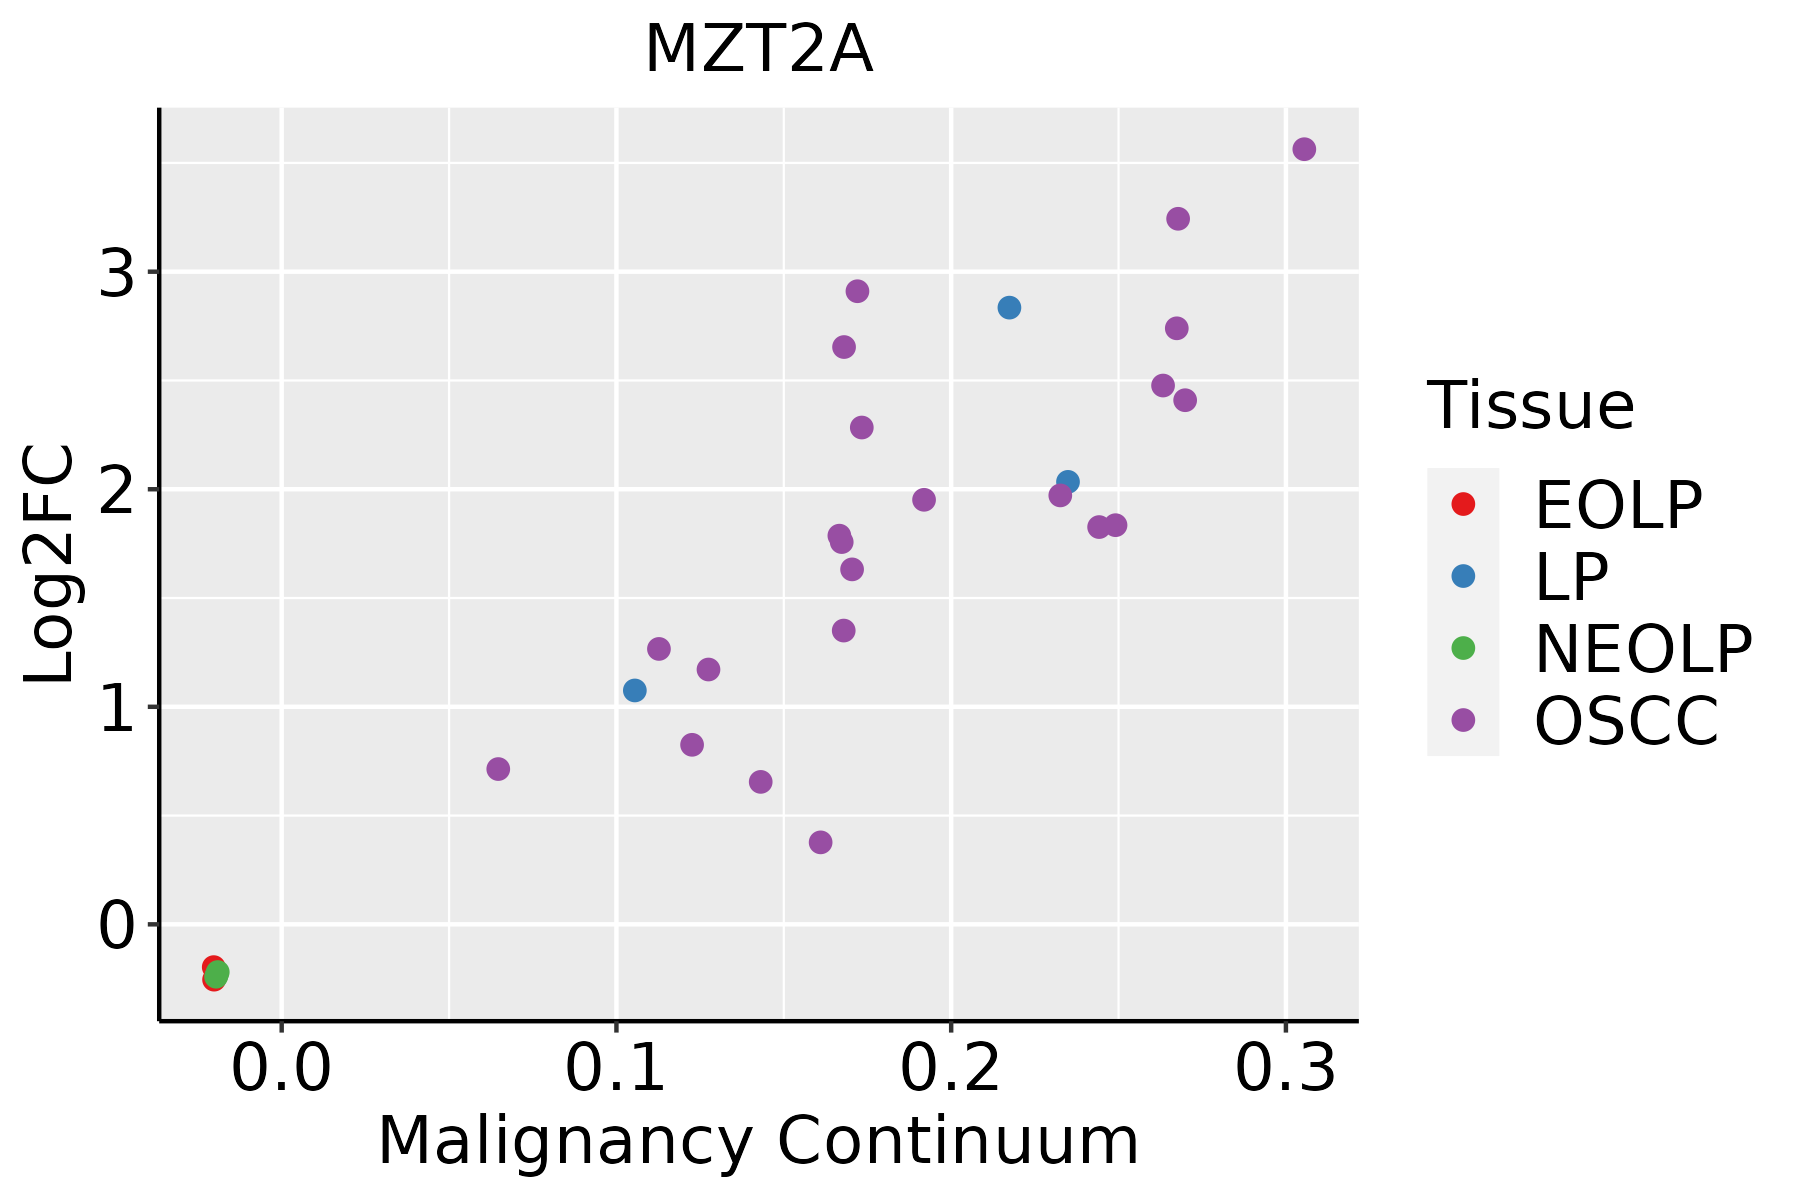 | EOLP: Erosive Oral lichen planus |
| LP: leukoplakia | ||
| NEOLP: Non-erosive oral lichen planus | ||
| OSCC: Oral squamous cell carcinoma | ||
| Prostate |  | BPH: Benign Prostatic Hyperplasia |
| Skin | 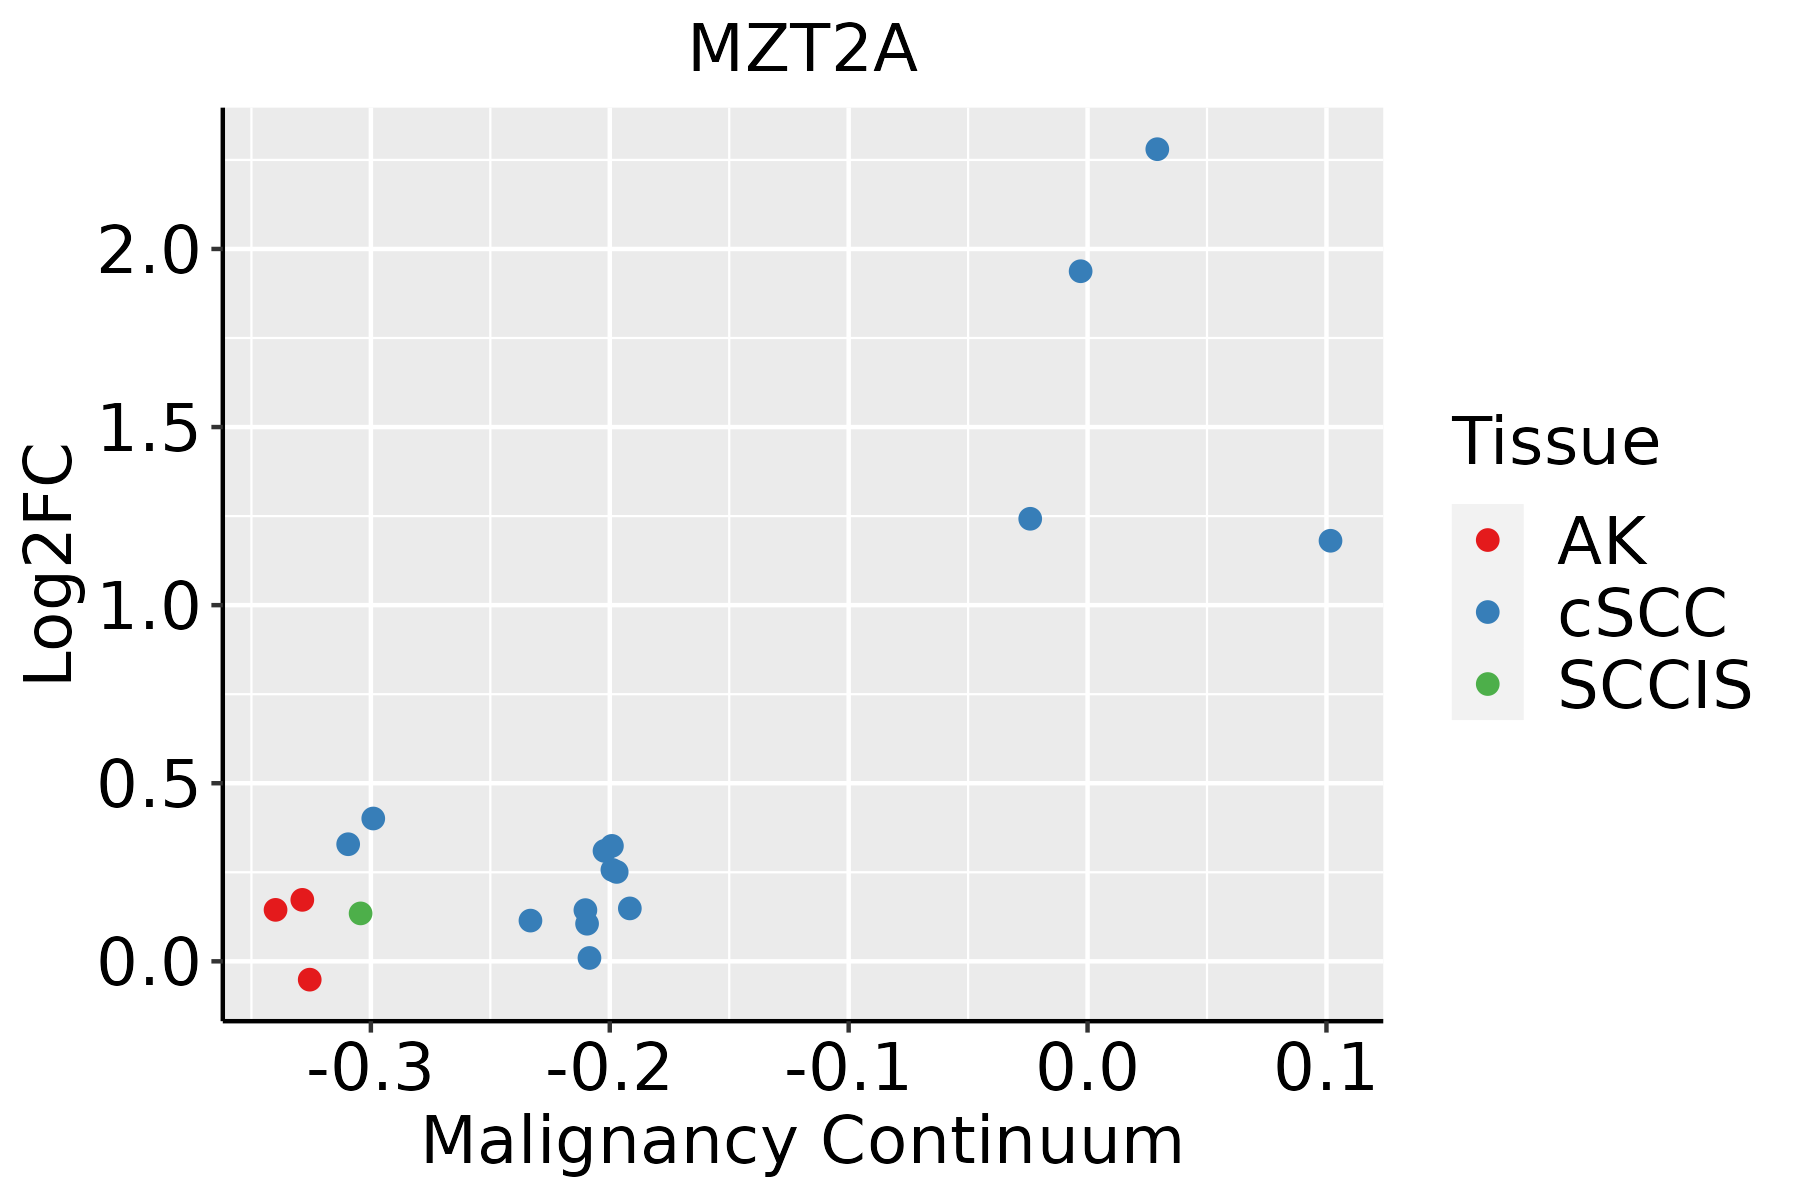 | AK: Actinic keratosis |
| cSCC: Cutaneous squamous cell carcinoma | ||
| SCCIS:squamous cell carcinoma in situ | ||
| Thyroid |  | ATC: Anaplastic thyroid cancer |
| HT: Hashimoto's thyroiditis | ||
| PTC: Papillary thyroid cancer |
| ∗log2FC in expression of this searched gene in stem-like cells from each diseased tissue sample relative to stem-like cells in normal samples in each tissue plotted against the malignancy continuum. Samples are colored based on if they are from different disease stage. |
Top |
Malignant transformation related pathway analysis |
| Find out the enriched GO biological processes and KEGG pathways involved in transition from healthy to precancer to cancer |
| Tissue | Disease Stage | Enriched GO biological Processes |
| Colorectum | AD |  |
| Colorectum | SER |  |
| Colorectum | MSS |  |
| Colorectum | MSI-H |  |
| Colorectum | FAP |  |
| ∗Top 15 enriched GO BP terms are showed in the bar plot of each disease state in each tissue. Each row represents a significant GO biological process which is colored according to the -log10(p.adjust). |
| Page: 1 2 3 4 5 6 7 8 9 |
| GO ID | Tissue | Disease Stage | Description | Gene Ratio | Bg Ratio | pvalue | p.adjust | Count |
| Page: 1 |
| Pathway ID | Tissue | Disease Stage | Description | Gene Ratio | Bg Ratio | pvalue | p.adjust | qvalue | Count |
| Page: 1 |
Top |
Cell-cell communication analysis |
| Identification of potential cell-cell interactions between two cell types and their ligand-receptor pairs for different disease states |
| Ligand | Receptor | LRpair | Pathway | Tissue | Disease Stage |
| Page: 1 |
Top |
Single-cell gene regulatory network inference analysis |
| Find out the significant the regulons (TFs) and the target genes of each regulon across cell types for different disease states |
| TF | Cell Type | Tissue | Disease Stage | Target Gene | RSS | Regulon Activity |
| ∗The dot plots of a searched regulon are shown for all cell subpopulations in each disease state of each tissue based on the regulon specific score inferred using pySCENIC and by calculating the average expression. |
| Page: 1 |
Top |
Somatic mutation of malignant transformation related genes |
| Annotation of somatic variants for genes involved in malignant transformation |
| Hugo Symbol | Variant Class | Variant Classification | dbSNP RS | HGVSc | HGVSp | HGVSp Short | SWISSPROT | BIOTYPE | SIFT | PolyPhen | Tumor Sample Barcode | Tissue | Histology | Sex | Age | Stage | Therapy Types | Drugs | Outcome |
| MZT2A | SNV | Missense_Mutation | c.455G>A | p.Ser152Asn | p.S152N | Q6P582 | protein_coding | tolerated_low_confidence(0.21) | probably_damaging(0.954) | TCGA-AA-3815-01 | Colorectum | colon adenocarcinoma | Female | >=65 | I/II | Unknown | Unknown | SD | |
| MZT2A | SNV | Missense_Mutation | rs377259626 | c.370C>T | p.Arg124Cys | p.R124C | Q6P582 | protein_coding | tolerated(0.08) | benign(0.022) | TCGA-AA-3947-01 | Colorectum | colon adenocarcinoma | Female | <65 | I/II | Unknown | Unknown | SD |
| MZT2A | SNV | Missense_Mutation | c.319N>T | p.Gly107Trp | p.G107W | Q6P582 | protein_coding | deleterious(0) | probably_damaging(0.998) | TCGA-DD-AACF-01 | Liver | liver hepatocellular carcinoma | Male | >=65 | I/II | Unknown | Unknown | PD | |
| MZT2A | SNV | Missense_Mutation | novel | c.466G>T | p.Gly156Cys | p.G156C | Q6P582 | protein_coding | deleterious_low_confidence(0) | possibly_damaging(0.671) | TCGA-53-7626-01 | Lung | lung adenocarcinoma | Female | >=65 | I/II | Unspecific | Cisplatin | PD |
| MZT2A | SNV | Missense_Mutation | c.364N>T | p.Ala122Ser | p.A122S | Q6P582 | protein_coding | tolerated(0.29) | benign(0.202) | TCGA-22-4613-01 | Lung | lung squamous cell carcinoma | Female | >=65 | I/II | Unknown | Unknown | SD | |
| MZT2A | SNV | Missense_Mutation | novel | c.442N>T | p.Gly148Trp | p.G148W | Q6P582 | protein_coding | deleterious_low_confidence(0) | probably_damaging(0.99) | TCGA-37-3792-01 | Lung | lung squamous cell carcinoma | Male | >=65 | I/II | Unknown | Unknown | SD |
| MZT2A | SNV | Missense_Mutation | novel | c.464A>T | p.Gln155Leu | p.Q155L | Q6P582 | protein_coding | deleterious_low_confidence(0.01) | benign(0.007) | TCGA-68-7755-01 | Lung | lung squamous cell carcinoma | Female | <65 | I/II | Unspecific | SD | |
| MZT2A | SNV | Missense_Mutation | c.402G>A | p.Met134Ile | p.M134I | Q6P582 | protein_coding | tolerated(0.14) | benign(0.026) | TCGA-CD-A4MG-01 | Stomach | stomach adenocarcinoma | Male | >=65 | I/II | Unknown | Unknown | PD | |
| MZT2A | SNV | Missense_Mutation | rs867572181 | c.403C>T | p.Pro135Ser | p.P135S | Q6P582 | protein_coding | tolerated(0.08) | probably_damaging(0.994) | TCGA-CG-5723-01 | Stomach | stomach adenocarcinoma | Male | >=65 | I/II | Unknown | Unknown | SD |
| Page: 1 |
Top |
Related drugs of malignant transformation related genes |
| Identification of chemicals and drugs interact with genes involved in malignant transfromation |
| (DGIdb 4.0) |
| Entrez ID | Symbol | Category | Interaction Types | Drug Claim Name | Drug Name | PMIDs |
| Page: 1 |

Copyright 2023-Present -The University of Texas Health Science Center at Houston |