
|
|||||
|
 | |
| |
| |
| |
| |
| |
|
Gene: MZT1 |
Gene summary for MZT1 |
| Gene information | Species | Human | Gene symbol | MZT1 | Gene ID | 440145 |
| Gene name | mitotic spindle organizing protein 1 | |
| Gene Alias | C13orf37 | |
| Cytomap | 13q21.33 | |
| Gene Type | protein-coding | GO ID | GO:0000226 | UniProtAcc | Q08AG7 |
Top |
Malignant transformation analysis |
| Identification of the aberrant gene expression in precancerous and cancerous lesions by comparing the gene expression of stem-like cells in diseased tissues with normal stem cells |
| Entrez ID | Symbol | Replicates | Species | Organ | Tissue | Adj P-value | Log2FC | Malignancy |
| 440145 | MZT1 | LZE4T | Human | Esophagus | ESCC | 2.62e-06 | 2.65e-01 | 0.0811 |
| 440145 | MZT1 | LZE7T | Human | Esophagus | ESCC | 2.26e-06 | 5.88e-01 | 0.0667 |
| 440145 | MZT1 | LZE8T | Human | Esophagus | ESCC | 3.35e-05 | 2.69e-01 | 0.067 |
| 440145 | MZT1 | LZE22T | Human | Esophagus | ESCC | 4.73e-06 | 5.97e-01 | 0.068 |
| 440145 | MZT1 | LZE24T | Human | Esophagus | ESCC | 1.67e-10 | 4.42e-01 | 0.0596 |
| 440145 | MZT1 | LZE6T | Human | Esophagus | ESCC | 1.65e-09 | 3.67e-01 | 0.0845 |
| 440145 | MZT1 | P1T-E | Human | Esophagus | ESCC | 8.47e-06 | 3.81e-01 | 0.0875 |
| 440145 | MZT1 | P2T-E | Human | Esophagus | ESCC | 1.75e-23 | 6.24e-01 | 0.1177 |
| 440145 | MZT1 | P4T-E | Human | Esophagus | ESCC | 4.29e-37 | 1.11e+00 | 0.1323 |
| 440145 | MZT1 | P5T-E | Human | Esophagus | ESCC | 4.91e-42 | 7.87e-01 | 0.1327 |
| 440145 | MZT1 | P8T-E | Human | Esophagus | ESCC | 2.58e-24 | 5.37e-01 | 0.0889 |
| 440145 | MZT1 | P9T-E | Human | Esophagus | ESCC | 8.70e-18 | 6.72e-01 | 0.1131 |
| 440145 | MZT1 | P10T-E | Human | Esophagus | ESCC | 2.44e-46 | 1.13e+00 | 0.116 |
| 440145 | MZT1 | P11T-E | Human | Esophagus | ESCC | 6.82e-12 | 4.76e-01 | 0.1426 |
| 440145 | MZT1 | P12T-E | Human | Esophagus | ESCC | 4.22e-21 | 4.39e-01 | 0.1122 |
| 440145 | MZT1 | P15T-E | Human | Esophagus | ESCC | 6.22e-22 | 6.58e-01 | 0.1149 |
| 440145 | MZT1 | P16T-E | Human | Esophagus | ESCC | 1.30e-44 | 8.11e-01 | 0.1153 |
| 440145 | MZT1 | P17T-E | Human | Esophagus | ESCC | 1.13e-06 | 5.83e-01 | 0.1278 |
| 440145 | MZT1 | P19T-E | Human | Esophagus | ESCC | 8.52e-04 | 6.70e-01 | 0.1662 |
| 440145 | MZT1 | P20T-E | Human | Esophagus | ESCC | 6.06e-27 | 7.35e-01 | 0.1124 |
| Page: 1 2 3 4 5 |
| Tissue | Expression Dynamics | Abbreviation |
| Esophagus | 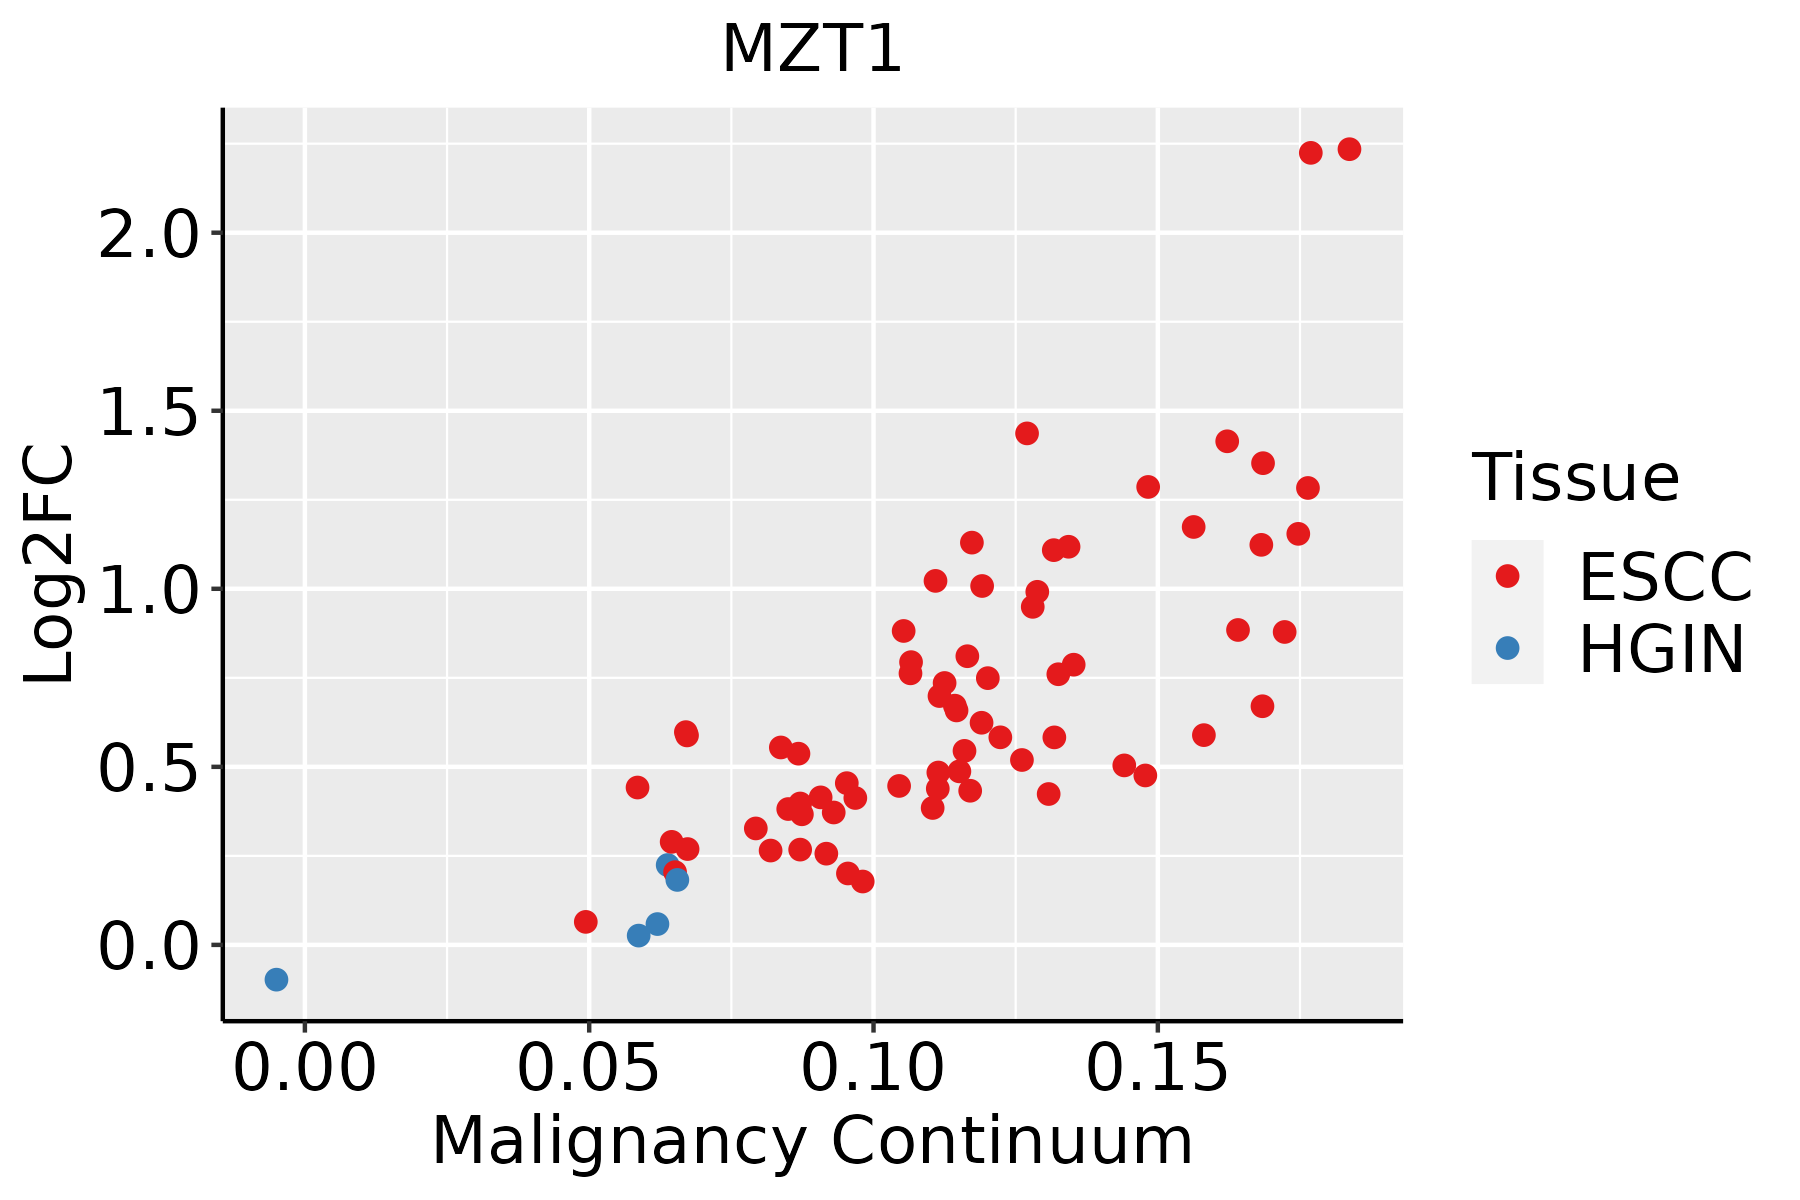 | ESCC: Esophageal squamous cell carcinoma |
| HGIN: High-grade intraepithelial neoplasias | ||
| LGIN: Low-grade intraepithelial neoplasias | ||
| Liver | 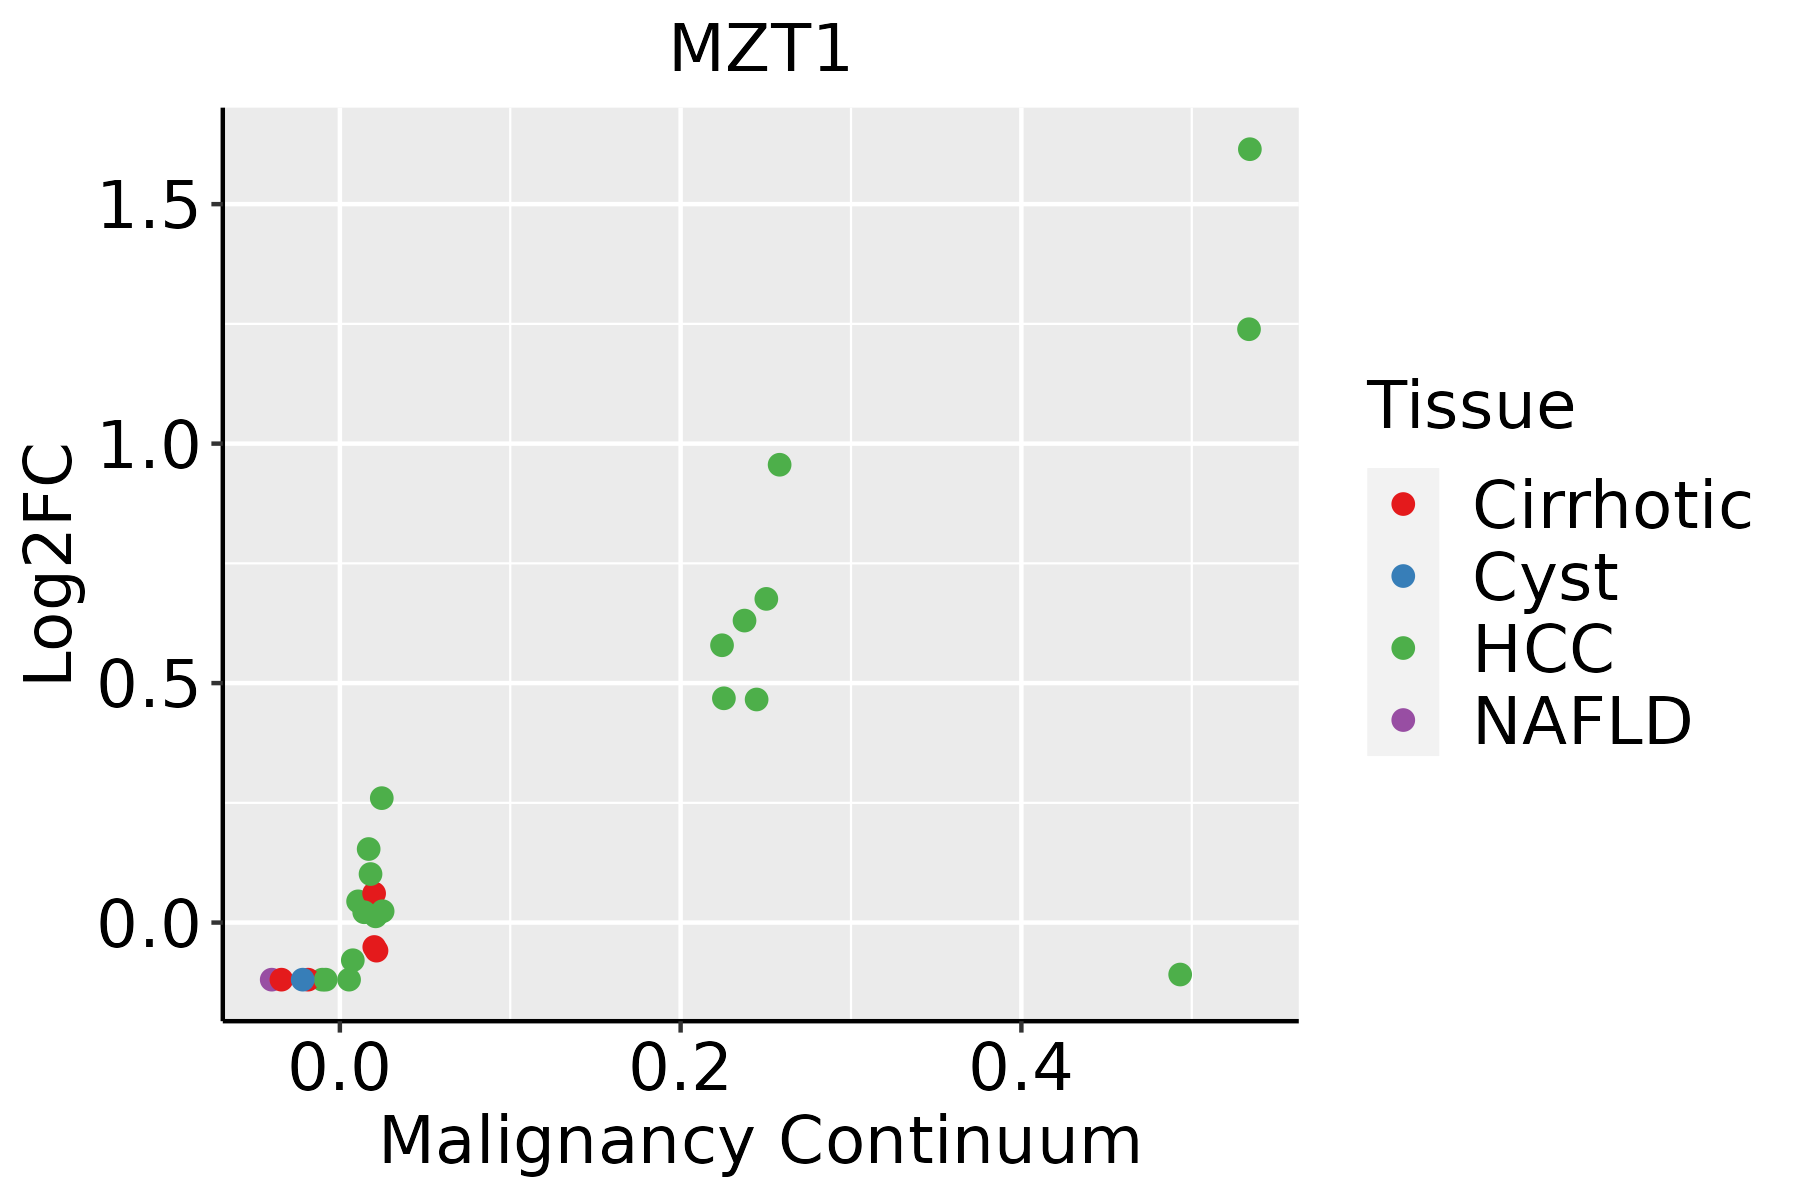 | HCC: Hepatocellular carcinoma |
| NAFLD: Non-alcoholic fatty liver disease | ||
| Oral Cavity |  | EOLP: Erosive Oral lichen planus |
| LP: leukoplakia | ||
| NEOLP: Non-erosive oral lichen planus | ||
| OSCC: Oral squamous cell carcinoma | ||
| Skin | 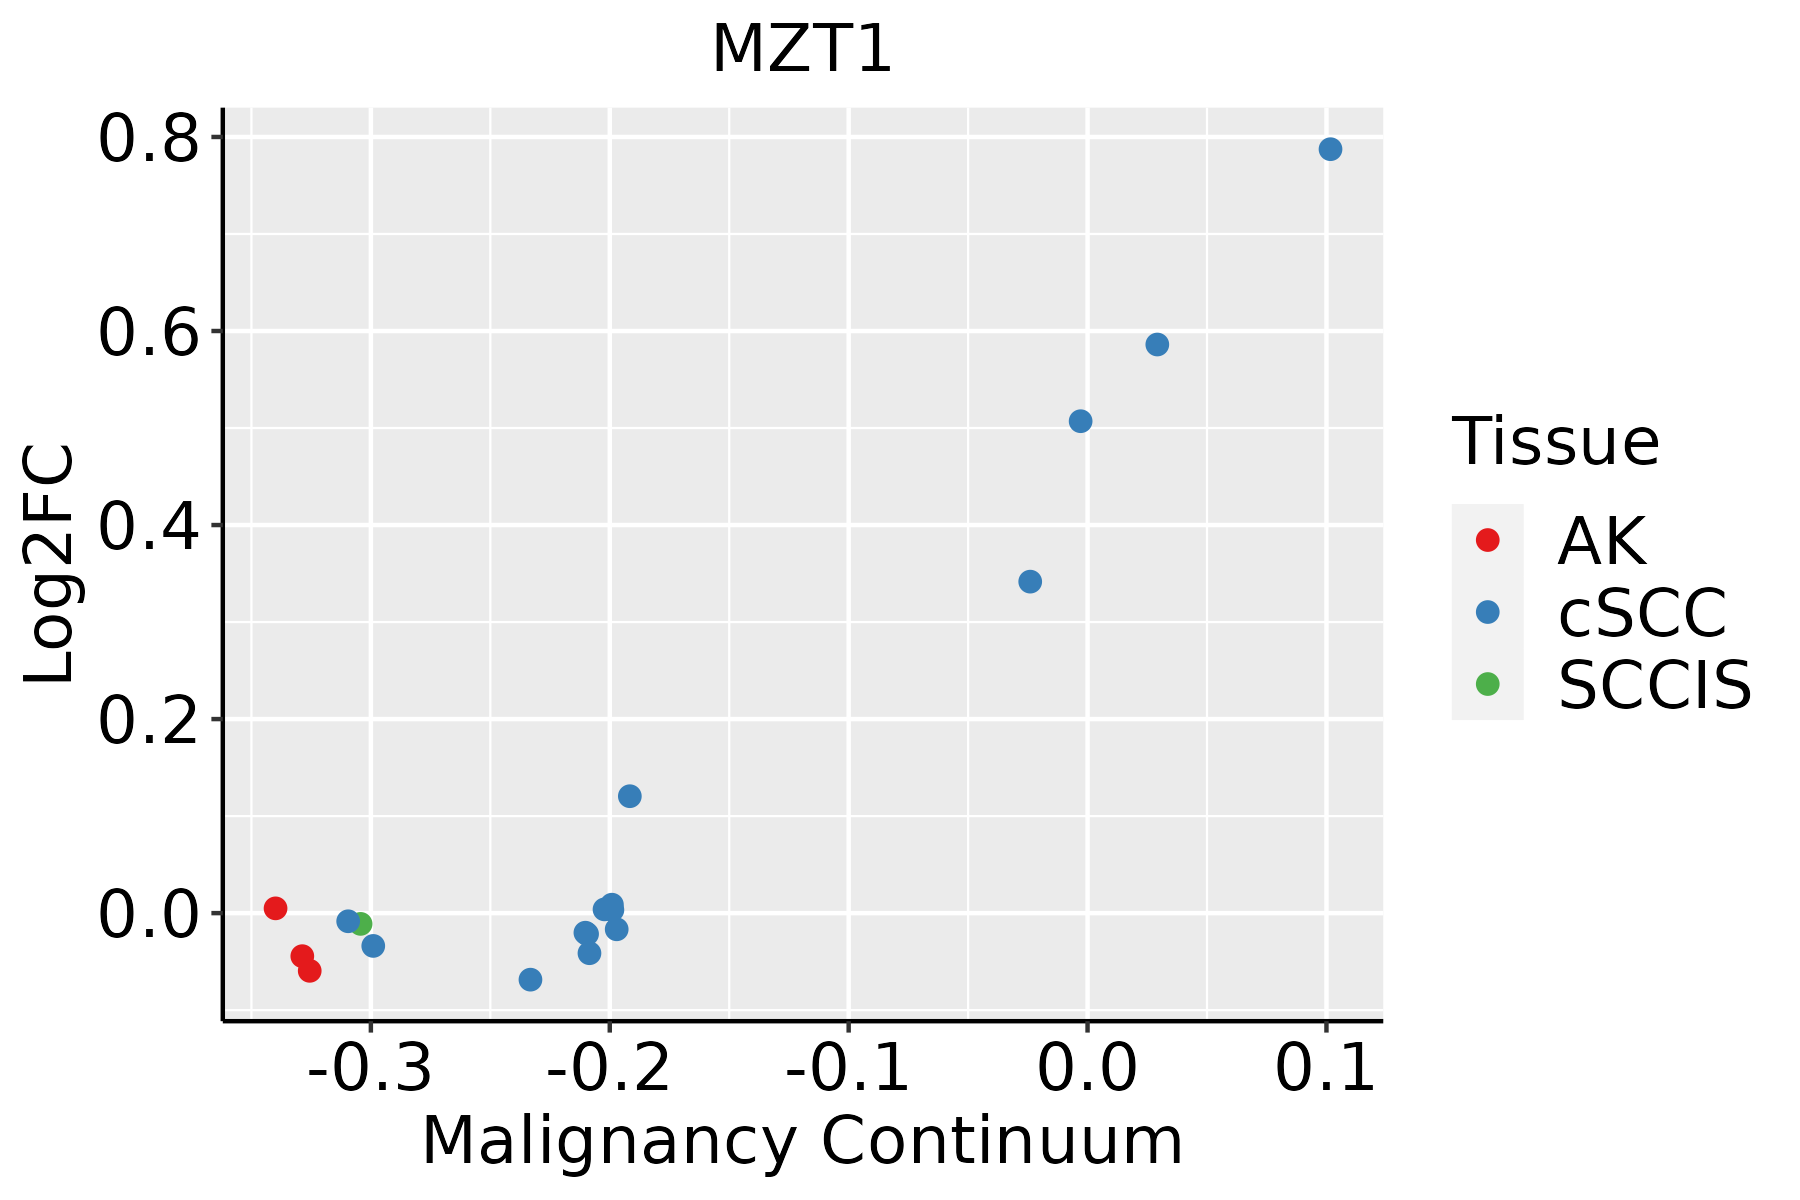 | AK: Actinic keratosis |
| cSCC: Cutaneous squamous cell carcinoma | ||
| SCCIS:squamous cell carcinoma in situ |
| ∗log2FC in expression of this searched gene in stem-like cells from each diseased tissue sample relative to stem-like cells in normal samples in each tissue plotted against the malignancy continuum. Samples are colored based on if they are from different disease stage. |
Top |
Malignant transformation related pathway analysis |
| Find out the enriched GO biological processes and KEGG pathways involved in transition from healthy to precancer to cancer |
| Tissue | Disease Stage | Enriched GO biological Processes |
| Colorectum | AD |  |
| Colorectum | SER |  |
| Colorectum | MSS |  |
| Colorectum | MSI-H |  |
| Colorectum | FAP |  |
| ∗Top 15 enriched GO BP terms are showed in the bar plot of each disease state in each tissue. Each row represents a significant GO biological process which is colored according to the -log10(p.adjust). |
| Page: 1 2 3 4 5 6 7 8 9 |
| GO ID | Tissue | Disease Stage | Description | Gene Ratio | Bg Ratio | pvalue | p.adjust | Count |
| GO:014001414 | Esophagus | ESCC | mitotic nuclear division | 218/8552 | 287/18723 | 6.17e-26 | 1.78e-23 | 218 |
| GO:190285015 | Esophagus | ESCC | microtubule cytoskeleton organization involved in mitosis | 116/8552 | 147/18723 | 1.25e-16 | 9.91e-15 | 116 |
| GO:000705214 | Esophagus | ESCC | mitotic spindle organization | 97/8552 | 120/18723 | 2.17e-15 | 1.33e-13 | 97 |
| GO:000705114 | Esophagus | ESCC | spindle organization | 134/8552 | 184/18723 | 5.70e-14 | 2.87e-12 | 134 |
| GO:00482853 | Esophagus | ESCC | organelle fission | 301/8552 | 488/18723 | 4.64e-13 | 2.12e-11 | 301 |
| GO:00002802 | Esophagus | ESCC | nuclear division | 270/8552 | 439/18723 | 1.17e-11 | 4.24e-10 | 270 |
| GO:00512256 | Esophagus | ESCC | spindle assembly | 85/8552 | 117/18723 | 2.72e-09 | 5.98e-08 | 85 |
| GO:009030715 | Esophagus | ESCC | mitotic spindle assembly | 52/8552 | 65/18723 | 1.41e-08 | 2.77e-07 | 52 |
| GO:0051258111 | Esophagus | ESCC | protein polymerization | 183/8552 | 297/18723 | 1.94e-08 | 3.75e-07 | 183 |
| GO:003150314 | Esophagus | ESCC | protein-containing complex localization | 139/8552 | 220/18723 | 1.14e-07 | 1.85e-06 | 139 |
| GO:00311094 | Esophagus | ESCC | microtubule polymerization or depolymerization | 77/8552 | 122/18723 | 7.60e-05 | 5.68e-04 | 77 |
| GO:00467856 | Esophagus | ESCC | microtubule polymerization | 55/8552 | 83/18723 | 1.21e-04 | 8.31e-04 | 55 |
| GO:00070205 | Esophagus | ESCC | microtubule nucleation | 27/8552 | 35/18723 | 1.48e-04 | 9.88e-04 | 27 |
| GO:005125812 | Liver | Cirrhotic | protein polymerization | 116/4634 | 297/18723 | 2.87e-08 | 9.78e-07 | 116 |
| GO:01400142 | Liver | Cirrhotic | mitotic nuclear division | 97/4634 | 287/18723 | 3.32e-04 | 2.87e-03 | 97 |
| GO:00070522 | Liver | Cirrhotic | mitotic spindle organization | 46/4634 | 120/18723 | 6.56e-04 | 4.98e-03 | 46 |
| GO:0031503 | Liver | Cirrhotic | protein-containing complex localization | 75/4634 | 220/18723 | 1.13e-03 | 7.73e-03 | 75 |
| GO:00903073 | Liver | Cirrhotic | mitotic spindle assembly | 27/4634 | 65/18723 | 2.14e-03 | 1.32e-02 | 27 |
| GO:19028502 | Liver | Cirrhotic | microtubule cytoskeleton organization involved in mitosis | 52/4634 | 147/18723 | 2.52e-03 | 1.51e-02 | 52 |
| GO:00070514 | Liver | Cirrhotic | spindle organization | 62/4634 | 184/18723 | 3.88e-03 | 2.10e-02 | 62 |
| Page: 1 2 3 4 |
| Pathway ID | Tissue | Disease Stage | Description | Gene Ratio | Bg Ratio | pvalue | p.adjust | qvalue | Count |
| Page: 1 |
Top |
Cell-cell communication analysis |
| Identification of potential cell-cell interactions between two cell types and their ligand-receptor pairs for different disease states |
| Ligand | Receptor | LRpair | Pathway | Tissue | Disease Stage |
| Page: 1 |
Top |
Single-cell gene regulatory network inference analysis |
| Find out the significant the regulons (TFs) and the target genes of each regulon across cell types for different disease states |
| TF | Cell Type | Tissue | Disease Stage | Target Gene | RSS | Regulon Activity |
| ∗The dot plots of a searched regulon are shown for all cell subpopulations in each disease state of each tissue based on the regulon specific score inferred using pySCENIC and by calculating the average expression. |
| Page: 1 |
Top |
Somatic mutation of malignant transformation related genes |
| Annotation of somatic variants for genes involved in malignant transformation |
| Hugo Symbol | Variant Class | Variant Classification | dbSNP RS | HGVSc | HGVSp | HGVSp Short | SWISSPROT | BIOTYPE | SIFT | PolyPhen | Tumor Sample Barcode | Tissue | Histology | Sex | Age | Stage | Therapy Types | Drugs | Outcome |
| MZT1 | SNV | Missense_Mutation | c.110N>A | p.Thr37Asn | p.T37N | Q08AG7 | protein_coding | deleterious(0) | probably_damaging(0.991) | TCGA-AP-A051-01 | Endometrium | uterine corpus endometrioid carcinoma | Female | >=65 | I/II | Unknown | Unknown | SD | |
| MZT1 | SNV | Missense_Mutation | c.199N>T | p.Leu67Phe | p.L67F | Q08AG7 | protein_coding | deleterious(0.01) | probably_damaging(0.995) | TCGA-AP-A053-01 | Endometrium | uterine corpus endometrioid carcinoma | Female | >=65 | I/II | Unknown | Unknown | SD | |
| MZT1 | SNV | Missense_Mutation | novel | c.98G>T | p.Arg33Ile | p.R33I | Q08AG7 | protein_coding | deleterious(0.01) | benign(0.406) | TCGA-EO-A3B0-01 | Endometrium | uterine corpus endometrioid carcinoma | Female | <65 | III/IV | Unknown | Unknown | SD |
| MZT1 | SNV | Missense_Mutation | novel | c.211N>G | p.Thr71Ala | p.T71A | Q08AG7 | protein_coding | tolerated(0.28) | benign(0) | TCGA-49-AARE-01 | Lung | lung adenocarcinoma | Female | <65 | I/II | Unknown | Unknown | PD |
| MZT1 | SNV | Missense_Mutation | rs761847353 | c.202N>T | p.Arg68Cys | p.R68C | Q08AG7 | protein_coding | deleterious(0) | probably_damaging(0.995) | TCGA-55-8514-01 | Lung | lung adenocarcinoma | Female | >=65 | I/II | Unknown | Unknown | SD |
| MZT1 | SNV | Missense_Mutation | novel | c.128N>T | p.Thr43Ile | p.T43I | Q08AG7 | protein_coding | deleterious(0.02) | benign(0.011) | TCGA-CN-A642-01 | Oral cavity | head & neck squamous cell carcinoma | Male | <65 | I/II | Unknown | Unknown | PD |
| MZT1 | SNV | Missense_Mutation | c.223N>C | p.Lys75Gln | p.K75Q | Q08AG7 | protein_coding | tolerated(0.11) | benign(0.205) | TCGA-HC-7077-01 | Prostate | prostate adenocarcinoma | Male | <65 | 6 | Unknown | Unknown | SD | |
| MZT1 | SNV | Missense_Mutation | c.224A>C | p.Lys75Thr | p.K75T | Q08AG7 | protein_coding | deleterious(0.01) | benign(0.202) | TCGA-B7-5818-01 | Stomach | stomach adenocarcinoma | Male | <65 | I/II | Unknown | Unknown | SD |
| Page: 1 |
Top |
Related drugs of malignant transformation related genes |
| Identification of chemicals and drugs interact with genes involved in malignant transfromation |
| (DGIdb 4.0) |
| Entrez ID | Symbol | Category | Interaction Types | Drug Claim Name | Drug Name | PMIDs |
| Page: 1 |

Copyright 2023-Present -The University of Texas Health Science Center at Houston |