
|
|||||
|
 | |
| |
| |
| |
| |
| |
|
Gene: MYSM1 |
Gene summary for MYSM1 |
| Gene information | Species | Human | Gene symbol | MYSM1 | Gene ID | 114803 |
| Gene name | Myb like, SWIRM and MPN domains 1 | |
| Gene Alias | 2A-DUB | |
| Cytomap | 1p32.1 | |
| Gene Type | protein-coding | GO ID | GO:0002376 | UniProtAcc | Q5VVJ2 |
Top |
Malignant transformation analysis |
| Identification of the aberrant gene expression in precancerous and cancerous lesions by comparing the gene expression of stem-like cells in diseased tissues with normal stem cells |
| Entrez ID | Symbol | Replicates | Species | Organ | Tissue | Adj P-value | Log2FC | Malignancy |
| 114803 | MYSM1 | HTA11_3410_2000001011 | Human | Colorectum | AD | 4.91e-11 | -5.39e-01 | 0.0155 |
| 114803 | MYSM1 | HTA11_2487_2000001011 | Human | Colorectum | SER | 7.13e-04 | -4.64e-01 | -0.1808 |
| 114803 | MYSM1 | HTA11_78_2000001011 | Human | Colorectum | AD | 1.04e-02 | -3.56e-01 | -0.1088 |
| 114803 | MYSM1 | HTA11_3361_2000001011 | Human | Colorectum | AD | 5.22e-06 | -6.01e-01 | -0.1207 |
| 114803 | MYSM1 | HTA11_83_2000001011 | Human | Colorectum | SER | 3.65e-02 | -5.11e-01 | -0.1526 |
| 114803 | MYSM1 | HTA11_696_2000001011 | Human | Colorectum | AD | 1.54e-14 | -4.90e-01 | -0.1464 |
| 114803 | MYSM1 | HTA11_866_2000001011 | Human | Colorectum | AD | 3.98e-13 | -4.75e-01 | -0.1001 |
| 114803 | MYSM1 | HTA11_866_3004761011 | Human | Colorectum | AD | 5.92e-07 | -4.94e-01 | 0.096 |
| 114803 | MYSM1 | HTA11_10711_2000001011 | Human | Colorectum | AD | 2.35e-04 | -4.95e-01 | 0.0338 |
| 114803 | MYSM1 | HTA11_7696_3000711011 | Human | Colorectum | AD | 8.39e-16 | -5.11e-01 | 0.0674 |
| 114803 | MYSM1 | HTA11_99999970781_79442 | Human | Colorectum | MSS | 3.63e-02 | -2.28e-01 | 0.294 |
| 114803 | MYSM1 | HTA11_99999971662_82457 | Human | Colorectum | MSS | 1.15e-10 | -4.16e-01 | 0.3859 |
| 114803 | MYSM1 | HTA11_99999974143_84620 | Human | Colorectum | MSS | 4.01e-25 | -5.92e-01 | 0.3005 |
| 114803 | MYSM1 | A002-C-010 | Human | Colorectum | FAP | 6.06e-07 | -2.53e-01 | 0.242 |
| 114803 | MYSM1 | A001-C-207 | Human | Colorectum | FAP | 2.90e-02 | -2.77e-01 | 0.1278 |
| 114803 | MYSM1 | A015-C-203 | Human | Colorectum | FAP | 2.83e-26 | -3.85e-01 | -0.1294 |
| 114803 | MYSM1 | A015-C-204 | Human | Colorectum | FAP | 1.28e-04 | -2.05e-01 | -0.0228 |
| 114803 | MYSM1 | A014-C-040 | Human | Colorectum | FAP | 3.34e-03 | -4.09e-01 | -0.1184 |
| 114803 | MYSM1 | A002-C-201 | Human | Colorectum | FAP | 9.14e-11 | -3.20e-01 | 0.0324 |
| 114803 | MYSM1 | A002-C-203 | Human | Colorectum | FAP | 4.39e-09 | -2.66e-01 | 0.2786 |
| Page: 1 2 3 4 5 6 7 |
| Tissue | Expression Dynamics | Abbreviation |
| Colorectum (GSE201348) | 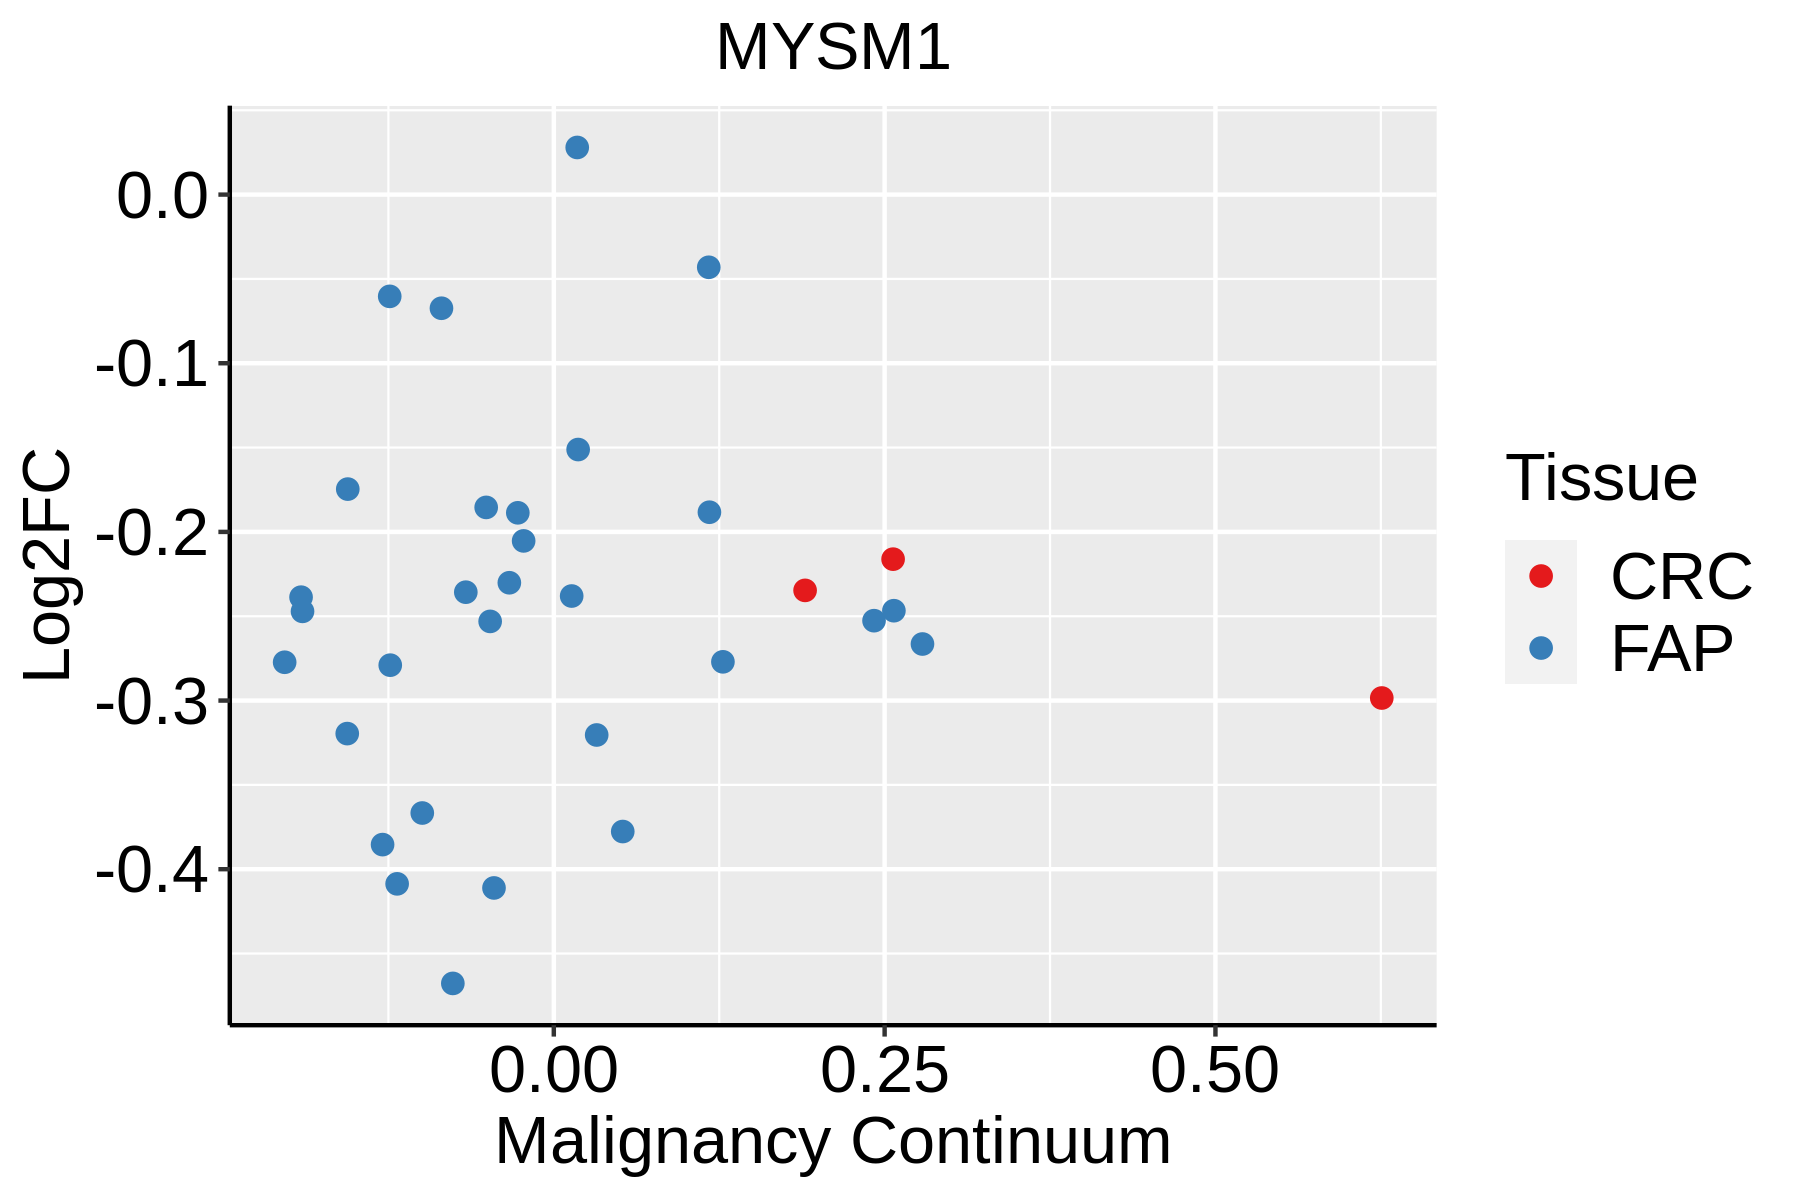 | FAP: Familial adenomatous polyposis |
| CRC: Colorectal cancer | ||
| Colorectum (HTA11) |  | AD: Adenomas |
| SER: Sessile serrated lesions | ||
| MSI-H: Microsatellite-high colorectal cancer | ||
| MSS: Microsatellite stable colorectal cancer | ||
| Esophagus | 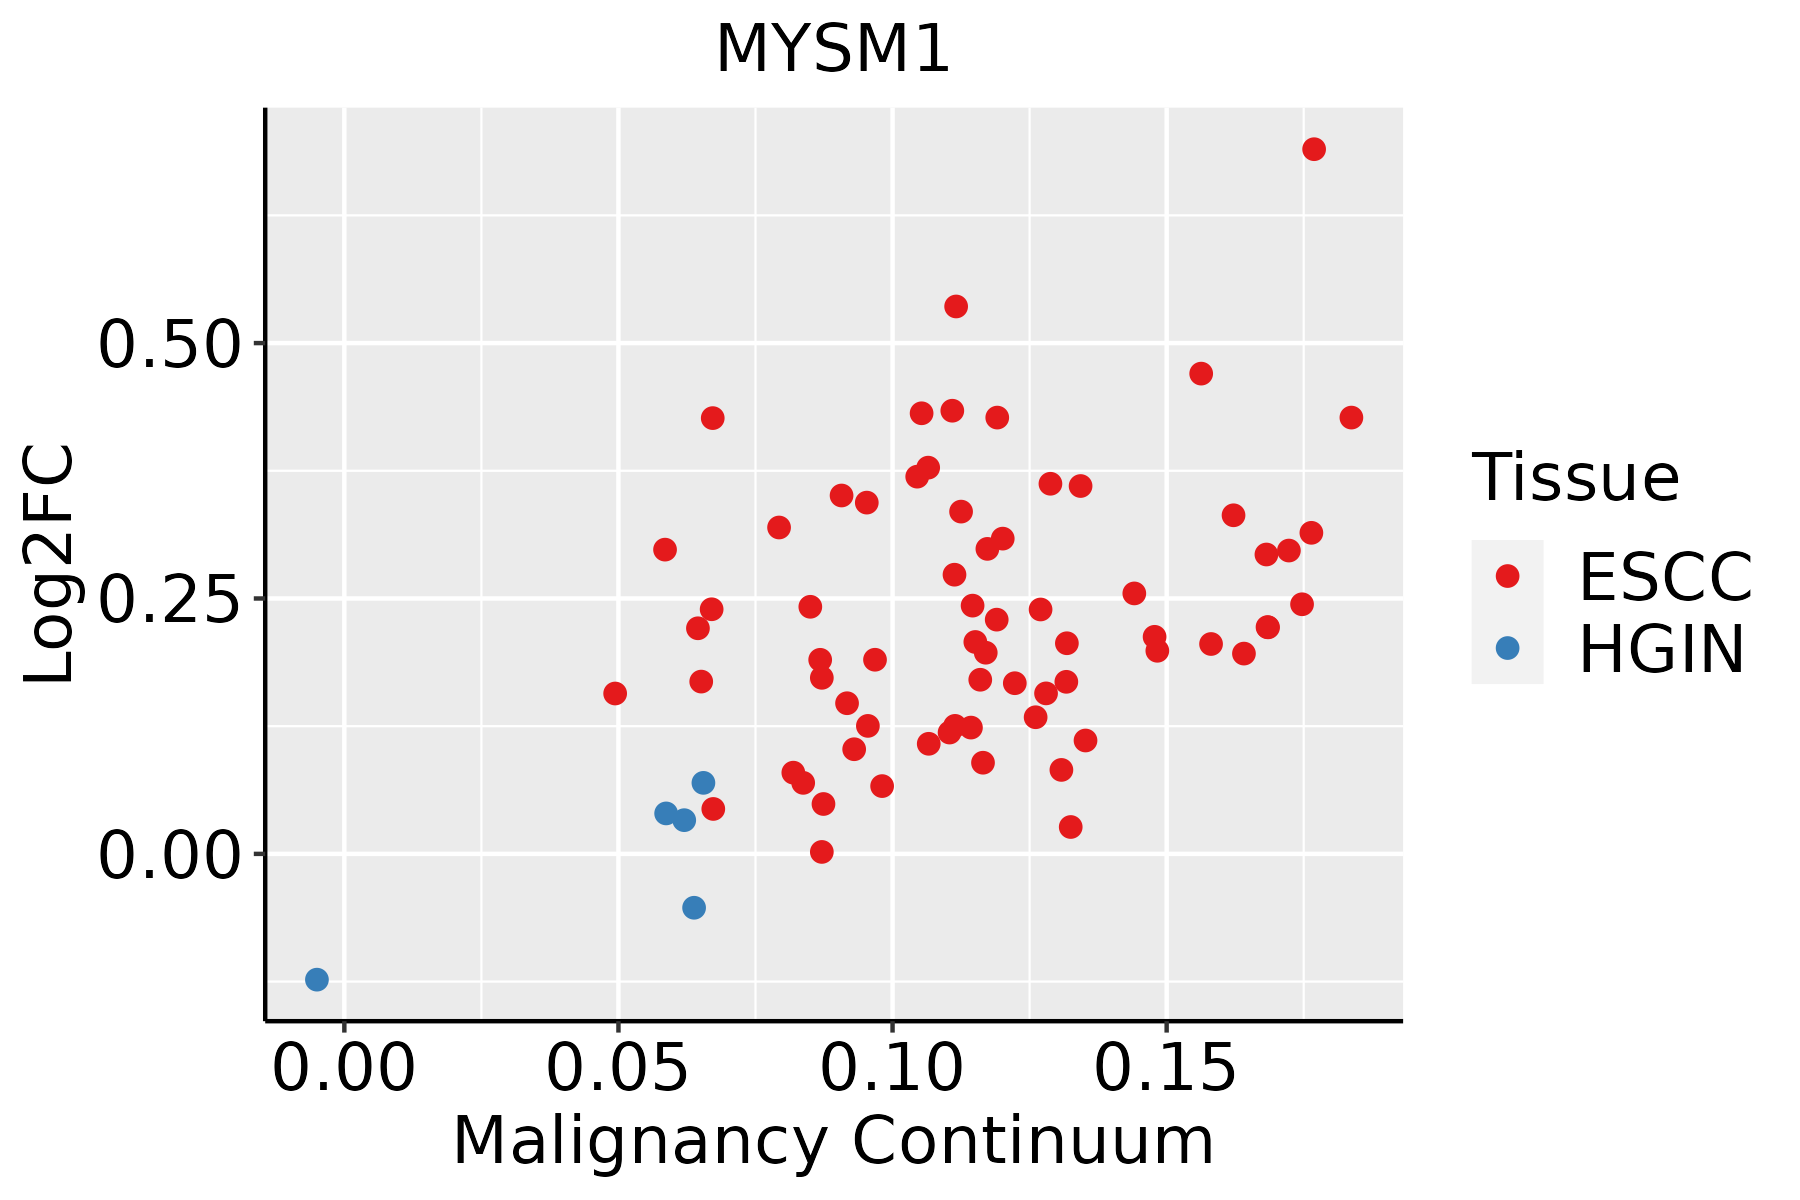 | ESCC: Esophageal squamous cell carcinoma |
| HGIN: High-grade intraepithelial neoplasias | ||
| LGIN: Low-grade intraepithelial neoplasias | ||
| Liver | 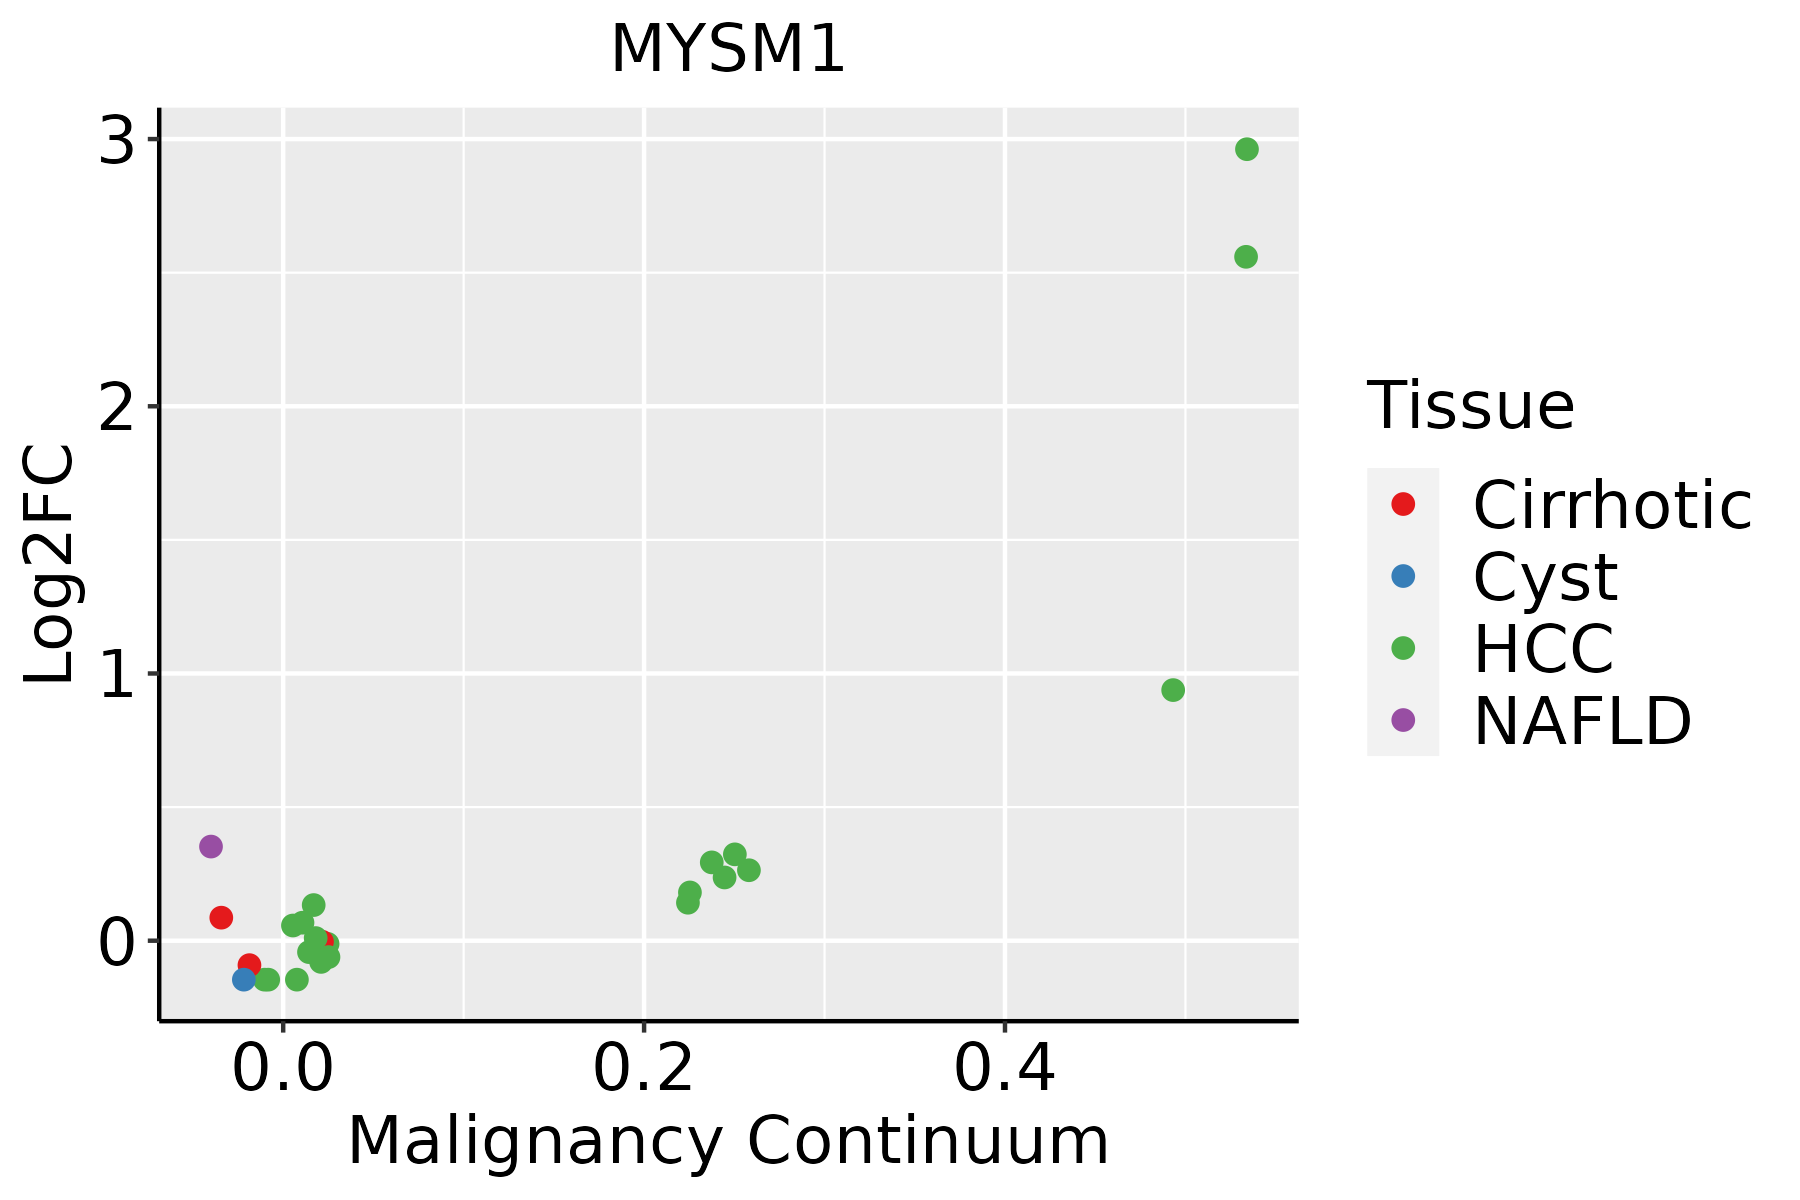 | HCC: Hepatocellular carcinoma |
| NAFLD: Non-alcoholic fatty liver disease | ||
| Thyroid | 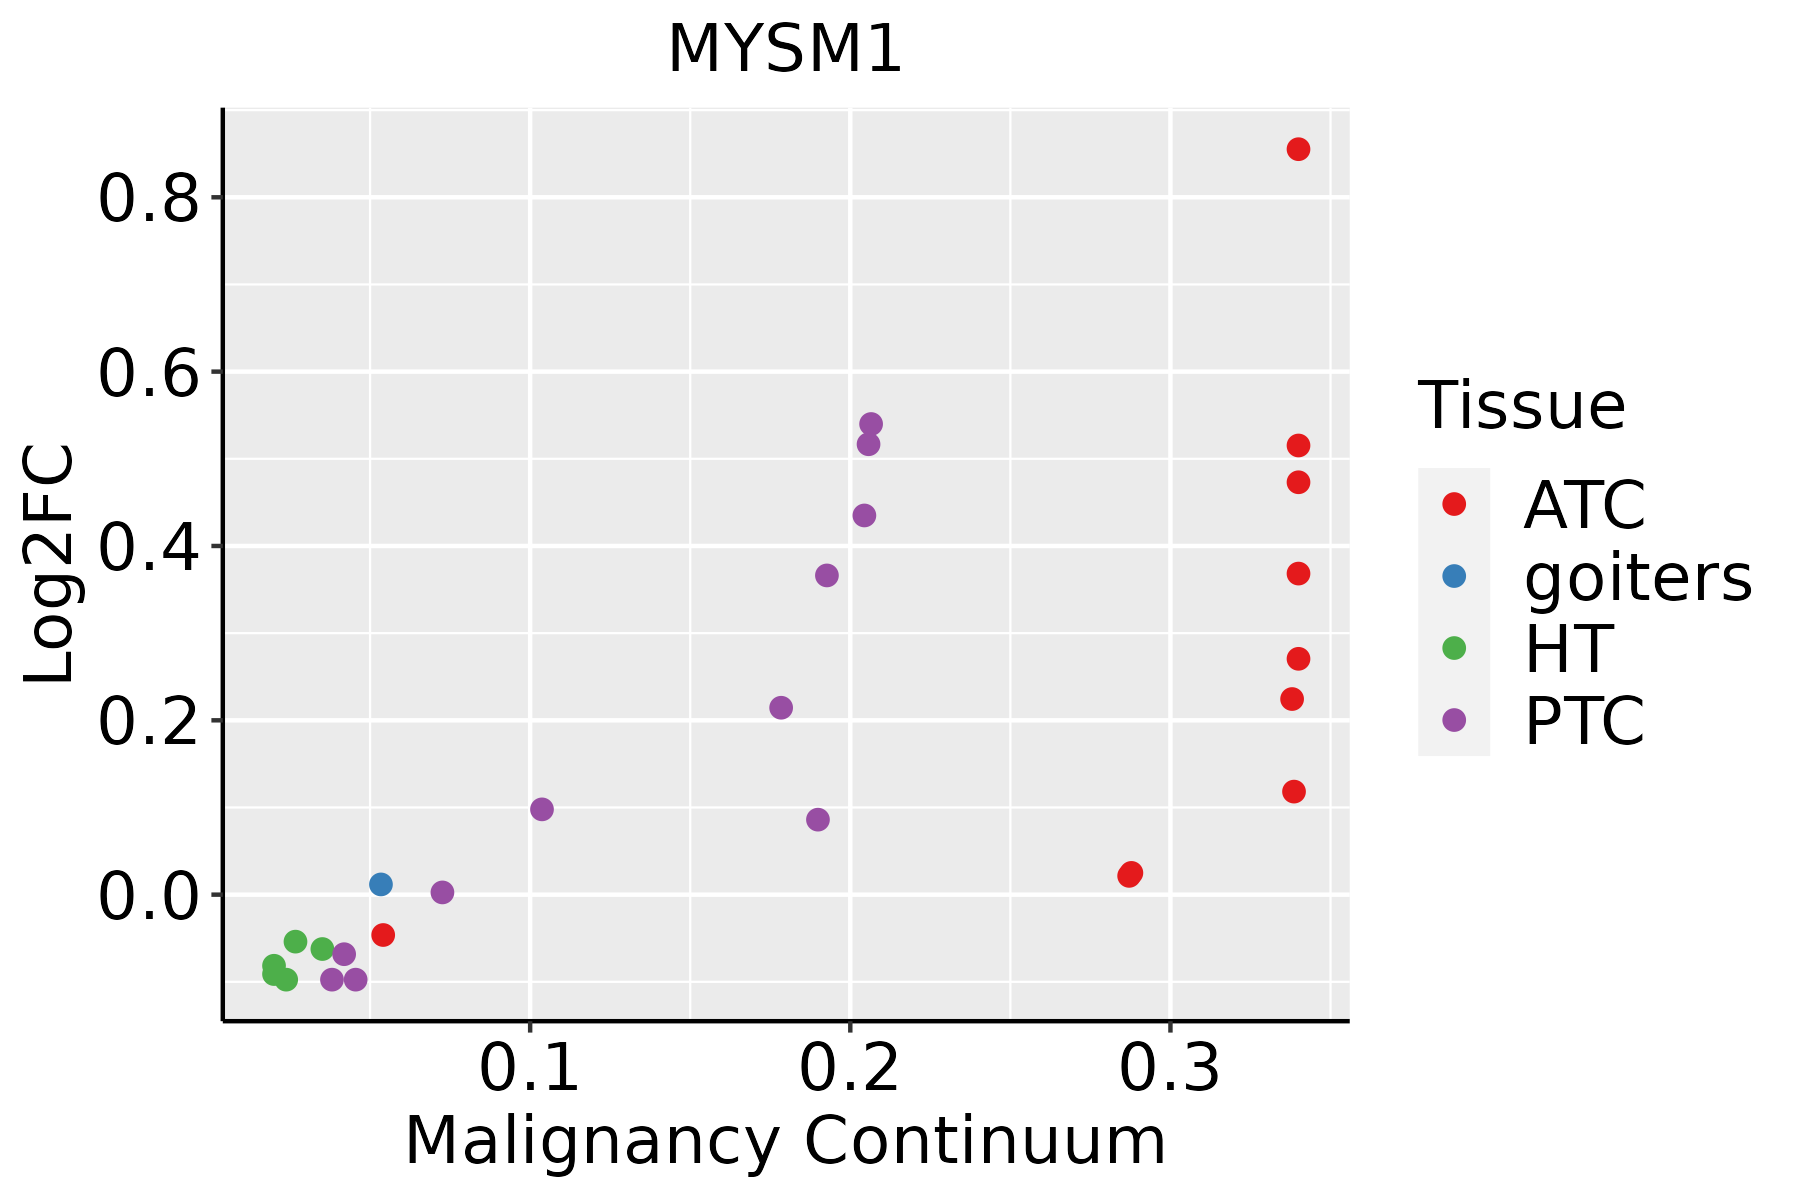 | ATC: Anaplastic thyroid cancer |
| HT: Hashimoto's thyroiditis | ||
| PTC: Papillary thyroid cancer |
| ∗log2FC in expression of this searched gene in stem-like cells from each diseased tissue sample relative to stem-like cells in normal samples in each tissue plotted against the malignancy continuum. Samples are colored based on if they are from different disease stage. |
Top |
Malignant transformation related pathway analysis |
| Find out the enriched GO biological processes and KEGG pathways involved in transition from healthy to precancer to cancer |
| Tissue | Disease Stage | Enriched GO biological Processes |
| Colorectum | AD |  |
| Colorectum | SER |  |
| Colorectum | MSS |  |
| Colorectum | MSI-H |  |
| Colorectum | FAP |  |
| ∗Top 15 enriched GO BP terms are showed in the bar plot of each disease state in each tissue. Each row represents a significant GO biological process which is colored according to the -log10(p.adjust). |
| Page: 1 2 3 4 5 6 7 8 9 |
| GO ID | Tissue | Disease Stage | Description | Gene Ratio | Bg Ratio | pvalue | p.adjust | Count |
| GO:0006325 | Colorectum | AD | chromatin organization | 119/3918 | 409/18723 | 4.85e-05 | 8.33e-04 | 119 |
| GO:1903706 | Colorectum | AD | regulation of hemopoiesis | 99/3918 | 367/18723 | 3.08e-03 | 2.28e-02 | 99 |
| GO:0006338 | Colorectum | AD | chromatin remodeling | 70/3918 | 255/18723 | 7.44e-03 | 4.53e-02 | 70 |
| GO:00063251 | Colorectum | SER | chromatin organization | 89/2897 | 409/18723 | 4.15e-04 | 6.17e-03 | 89 |
| GO:00063252 | Colorectum | MSS | chromatin organization | 107/3467 | 409/18723 | 7.22e-05 | 1.21e-03 | 107 |
| GO:0016570 | Colorectum | MSS | histone modification | 113/3467 | 463/18723 | 8.37e-04 | 8.68e-03 | 113 |
| GO:19037061 | Colorectum | MSS | regulation of hemopoiesis | 89/3467 | 367/18723 | 3.39e-03 | 2.56e-02 | 89 |
| GO:00165701 | Colorectum | FAP | histone modification | 94/2622 | 463/18723 | 1.06e-04 | 1.76e-03 | 94 |
| GO:00063253 | Colorectum | FAP | chromatin organization | 84/2622 | 409/18723 | 1.62e-04 | 2.47e-03 | 84 |
| GO:19037063 | Colorectum | FAP | regulation of hemopoiesis | 69/2622 | 367/18723 | 6.01e-03 | 3.78e-02 | 69 |
| GO:00063254 | Colorectum | CRC | chromatin organization | 74/2078 | 409/18723 | 1.48e-05 | 4.61e-04 | 74 |
| GO:00165702 | Colorectum | CRC | histone modification | 75/2078 | 463/18723 | 4.95e-04 | 7.06e-03 | 75 |
| GO:001657015 | Esophagus | ESCC | histone modification | 323/8552 | 463/18723 | 2.61e-26 | 7.88e-24 | 323 |
| GO:000632517 | Esophagus | ESCC | chromatin organization | 240/8552 | 409/18723 | 6.52e-08 | 1.14e-06 | 240 |
| GO:007064612 | Esophagus | ESCC | protein modification by small protein removal | 95/8552 | 157/18723 | 1.25e-04 | 8.56e-04 | 95 |
| GO:1903706110 | Esophagus | ESCC | regulation of hemopoiesis | 201/8552 | 367/18723 | 2.60e-04 | 1.58e-03 | 201 |
| GO:00165783 | Esophagus | ESCC | histone deubiquitination | 18/8552 | 23/18723 | 1.50e-03 | 7.06e-03 | 18 |
| GO:00355203 | Esophagus | ESCC | monoubiquitinated protein deubiquitination | 9/8552 | 10/18723 | 5.09e-03 | 1.92e-02 | 9 |
| GO:00165793 | Esophagus | ESCC | protein deubiquitination | 79/8552 | 139/18723 | 5.23e-03 | 1.97e-02 | 79 |
| GO:00165703 | Liver | NAFLD | histone modification | 90/1882 | 463/18723 | 5.74e-10 | 1.28e-07 | 90 |
| Page: 1 2 3 |
| Pathway ID | Tissue | Disease Stage | Description | Gene Ratio | Bg Ratio | pvalue | p.adjust | qvalue | Count |
| Page: 1 |
Top |
Cell-cell communication analysis |
| Identification of potential cell-cell interactions between two cell types and their ligand-receptor pairs for different disease states |
| Ligand | Receptor | LRpair | Pathway | Tissue | Disease Stage |
| Page: 1 |
Top |
Single-cell gene regulatory network inference analysis |
| Find out the significant the regulons (TFs) and the target genes of each regulon across cell types for different disease states |
| TF | Cell Type | Tissue | Disease Stage | Target Gene | RSS | Regulon Activity |
| ∗The dot plots of a searched regulon are shown for all cell subpopulations in each disease state of each tissue based on the regulon specific score inferred using pySCENIC and by calculating the average expression. |
| Page: 1 |
Top |
Somatic mutation of malignant transformation related genes |
| Annotation of somatic variants for genes involved in malignant transformation |
| Hugo Symbol | Variant Class | Variant Classification | dbSNP RS | HGVSc | HGVSp | HGVSp Short | SWISSPROT | BIOTYPE | SIFT | PolyPhen | Tumor Sample Barcode | Tissue | Histology | Sex | Age | Stage | Therapy Types | Drugs | Outcome |
| MYSM1 | SNV | Missense_Mutation | rs770341254 | c.413G>A | p.Arg138Gln | p.R138Q | Q5VVJ2 | protein_coding | deleterious(0.03) | possibly_damaging(0.763) | TCGA-BH-A1F0-01 | Breast | breast invasive carcinoma | Female | >=65 | I/II | Unknown | Unknown | PD |
| MYSM1 | SNV | Missense_Mutation | novel | c.2269A>G | p.Ser757Gly | p.S757G | Q5VVJ2 | protein_coding | tolerated(0.56) | benign(0.023) | TCGA-E2-A573-01 | Breast | breast invasive carcinoma | Female | <65 | I/II | Chemotherapy | taxotere | CR |
| MYSM1 | SNV | Missense_Mutation | novel | c.2227G>A | p.Glu743Lys | p.E743K | Q5VVJ2 | protein_coding | tolerated(0.27) | benign(0.23) | TCGA-PE-A5DE-01 | Breast | breast invasive carcinoma | Female | <65 | I/II | Chemotherapy | taxotere | CR |
| MYSM1 | insertion | In_Frame_Ins | novel | c.2033_2034insCTCTCTGTCACCTCCCGGTTTAGGGTTAACAATGAC | p.Ser678_Tyr679insSerLeuSerProProGlyLeuGlyLeuThrMetThr | p.S678_Y679insSLSPPGLGLTMT | Q5VVJ2 | protein_coding | TCGA-AN-A04A-01 | Breast | breast invasive carcinoma | Female | <65 | III/IV | Unknown | Unknown | SD | ||
| MYSM1 | insertion | Frame_Shift_Ins | novel | c.519_520insTCTTTTCTATATATTATCAAACTGCTCTTTGTATTTAAAGATTC | p.Glu174SerfsTer43 | p.E174Sfs*43 | Q5VVJ2 | protein_coding | TCGA-AO-A0JD-01 | Breast | breast invasive carcinoma | Female | <65 | III/IV | Chemotherapy | cyclophosphamide | SD | ||
| MYSM1 | SNV | Missense_Mutation | c.979N>C | p.Asp327His | p.D327H | Q5VVJ2 | protein_coding | tolerated(0.12) | benign(0) | TCGA-C5-A1BK-01 | Cervix | cervical & endocervical cancer | Female | <65 | I/II | Unknown | Unknown | SD | |
| MYSM1 | SNV | Missense_Mutation | c.31G>A | p.Glu11Lys | p.E11K | Q5VVJ2 | protein_coding | deleterious(0) | probably_damaging(0.959) | TCGA-EK-A2PG-01 | Cervix | cervical & endocervical cancer | Female | >=65 | I/II | Unknown | Unknown | SD | |
| MYSM1 | insertion | Frame_Shift_Ins | novel | c.1600dupA | p.Arg534LysfsTer11 | p.R534Kfs*11 | Q5VVJ2 | protein_coding | TCGA-2W-A8YY-01 | Cervix | cervical & endocervical cancer | Female | <65 | I/II | Chemotherapy | cisplatin | CR | ||
| MYSM1 | SNV | Missense_Mutation | novel | c.1688C>A | p.Pro563His | p.P563H | Q5VVJ2 | protein_coding | deleterious(0) | probably_damaging(0.909) | TCGA-A6-2686-01 | Colorectum | colon adenocarcinoma | Female | >=65 | I/II | Unknown | Unknown | SD |
| MYSM1 | SNV | Missense_Mutation | c.2232N>T | p.Lys744Asn | p.K744N | Q5VVJ2 | protein_coding | deleterious(0.01) | possibly_damaging(0.829) | TCGA-A6-6141-01 | Colorectum | colon adenocarcinoma | Male | <65 | I/II | Chemotherapy | 5-fu | SD |
| Page: 1 2 3 4 5 6 7 8 |
Top |
Related drugs of malignant transformation related genes |
| Identification of chemicals and drugs interact with genes involved in malignant transfromation |
| (DGIdb 4.0) |
| Entrez ID | Symbol | Category | Interaction Types | Drug Claim Name | Drug Name | PMIDs |
| Page: 1 |

Copyright 2023-Present -The University of Texas Health Science Center at Houston |