
|
|||||
|
 | |
| |
| |
| |
| |
| |
|
Gene: MYORG |
Gene summary for MYORG |
| Gene information | Species | Human | Gene symbol | MYORG | Gene ID | 57462 |
| Gene name | myogenesis regulating glycosidase (putative) | |
| Gene Alias | IBGC7 | |
| Cytomap | 9p13.3 | |
| Gene Type | protein-coding | GO ID | GO:0005975 | UniProtAcc | Q6NSJ0 |
Top |
Malignant transformation analysis |
| Identification of the aberrant gene expression in precancerous and cancerous lesions by comparing the gene expression of stem-like cells in diseased tissues with normal stem cells |
| Entrez ID | Symbol | Replicates | Species | Organ | Tissue | Adj P-value | Log2FC | Malignancy |
| 57462 | MYORG | HTA11_2487_2000001011 | Human | Colorectum | SER | 3.80e-05 | 3.59e-01 | -0.1808 |
| 57462 | MYORG | HTA11_1938_2000001011 | Human | Colorectum | AD | 9.69e-04 | 2.47e-01 | -0.0811 |
| 57462 | MYORG | HTA11_78_2000001011 | Human | Colorectum | AD | 4.22e-08 | 3.34e-01 | -0.1088 |
| 57462 | MYORG | HTA11_347_2000001011 | Human | Colorectum | AD | 1.06e-12 | 3.71e-01 | -0.1954 |
| 57462 | MYORG | HTA11_1391_2000001011 | Human | Colorectum | AD | 1.82e-02 | 1.43e-01 | -0.059 |
| 57462 | MYORG | HTA11_2992_2000001011 | Human | Colorectum | SER | 9.71e-05 | 4.34e-01 | -0.1706 |
| 57462 | MYORG | S014 | Human | Liver | HCC | 4.12e-18 | 5.62e-01 | 0.2254 |
| 57462 | MYORG | S015 | Human | Liver | HCC | 2.15e-20 | 6.44e-01 | 0.2375 |
| 57462 | MYORG | S016 | Human | Liver | HCC | 1.04e-22 | 6.29e-01 | 0.2243 |
| 57462 | MYORG | S027 | Human | Liver | HCC | 1.36e-08 | 3.63e-01 | 0.2446 |
| 57462 | MYORG | S028 | Human | Liver | HCC | 1.47e-06 | 2.05e-01 | 0.2503 |
| 57462 | MYORG | S029 | Human | Liver | HCC | 1.18e-08 | 3.06e-01 | 0.2581 |
| Page: 1 |
| Tissue | Expression Dynamics | Abbreviation |
| Colorectum (GSE201348) |  | FAP: Familial adenomatous polyposis |
| CRC: Colorectal cancer | ||
| Colorectum (HTA11) |  | AD: Adenomas |
| SER: Sessile serrated lesions | ||
| MSI-H: Microsatellite-high colorectal cancer | ||
| MSS: Microsatellite stable colorectal cancer | ||
| Liver | 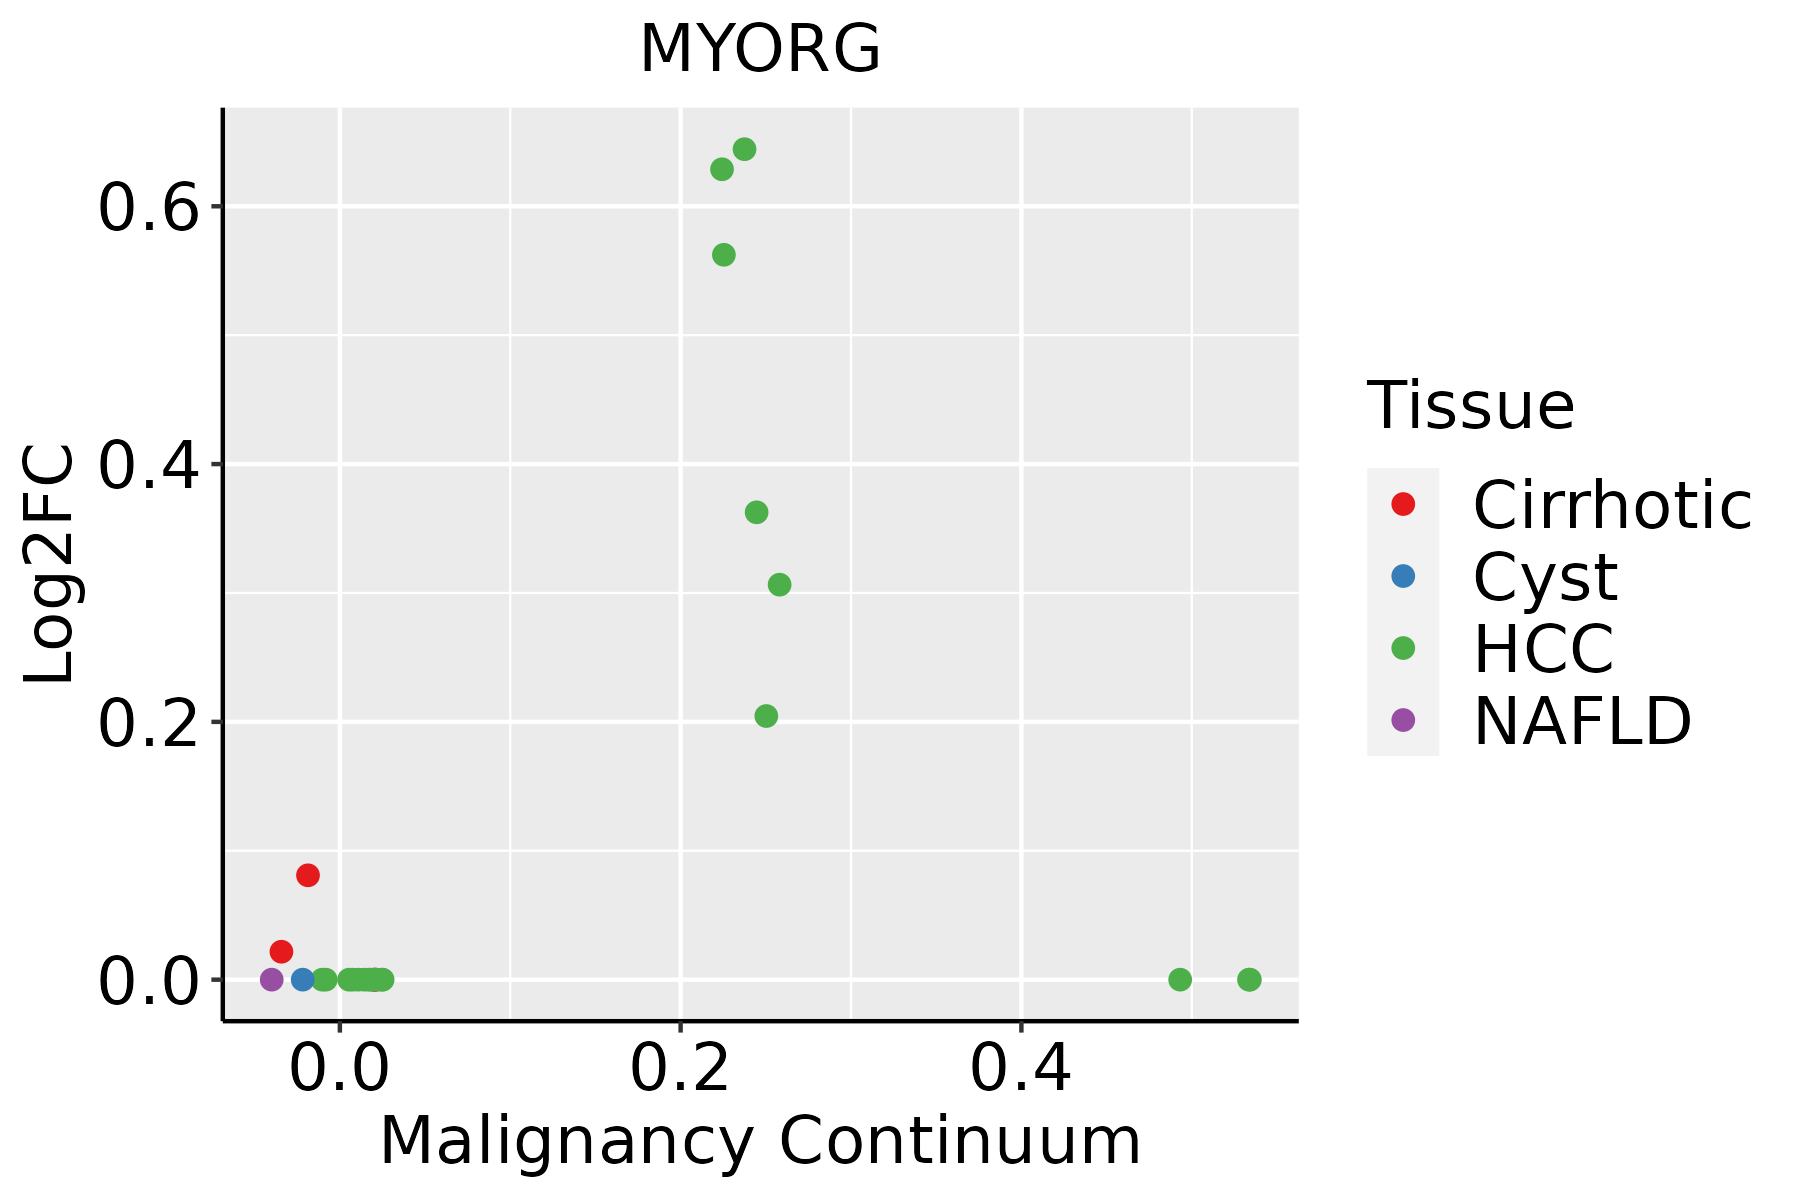 | HCC: Hepatocellular carcinoma |
| NAFLD: Non-alcoholic fatty liver disease |
| ∗log2FC in expression of this searched gene in stem-like cells from each diseased tissue sample relative to stem-like cells in normal samples in each tissue plotted against the malignancy continuum. Samples are colored based on if they are from different disease stage. |
Top |
Malignant transformation related pathway analysis |
| Find out the enriched GO biological processes and KEGG pathways involved in transition from healthy to precancer to cancer |
| Tissue | Disease Stage | Enriched GO biological Processes |
| Colorectum | AD |  |
| Colorectum | SER |  |
| Colorectum | MSS |  |
| Colorectum | MSI-H |  |
| Colorectum | FAP |  |
| ∗Top 15 enriched GO BP terms are showed in the bar plot of each disease state in each tissue. Each row represents a significant GO biological process which is colored according to the -log10(p.adjust). |
| Page: 1 2 3 4 5 6 7 8 9 |
| GO ID | Tissue | Disease Stage | Description | Gene Ratio | Bg Ratio | pvalue | p.adjust | Count |
| GO:0048009 | Colorectum | SER | insulin-like growth factor receptor signaling pathway | 14/2897 | 37/18723 | 7.80e-04 | 9.87e-03 | 14 |
| Page: 1 |
| Pathway ID | Tissue | Disease Stage | Description | Gene Ratio | Bg Ratio | pvalue | p.adjust | qvalue | Count |
| Page: 1 |
Top |
Cell-cell communication analysis |
| Identification of potential cell-cell interactions between two cell types and their ligand-receptor pairs for different disease states |
| Ligand | Receptor | LRpair | Pathway | Tissue | Disease Stage |
| Page: 1 |
Top |
Single-cell gene regulatory network inference analysis |
| Find out the significant the regulons (TFs) and the target genes of each regulon across cell types for different disease states |
| TF | Cell Type | Tissue | Disease Stage | Target Gene | RSS | Regulon Activity |
| ∗The dot plots of a searched regulon are shown for all cell subpopulations in each disease state of each tissue based on the regulon specific score inferred using pySCENIC and by calculating the average expression. |
| Page: 1 |
Top |
Somatic mutation of malignant transformation related genes |
| Annotation of somatic variants for genes involved in malignant transformation |
| Hugo Symbol | Variant Class | Variant Classification | dbSNP RS | HGVSc | HGVSp | HGVSp Short | SWISSPROT | BIOTYPE | SIFT | PolyPhen | Tumor Sample Barcode | Tissue | Histology | Sex | Age | Stage | Therapy Types | Drugs | Outcome |
| Page: 1 |
Top |
Related drugs of malignant transformation related genes |
| Identification of chemicals and drugs interact with genes involved in malignant transfromation |
| (DGIdb 4.0) |
| Entrez ID | Symbol | Category | Interaction Types | Drug Claim Name | Drug Name | PMIDs |
| Page: 1 |

Copyright 2023-Present -The University of Texas Health Science Center at Houston |