
|
|||||
|
 | |
| |
| |
| |
| |
| |
|
Gene: MYOF |
Gene summary for MYOF |
| Gene information | Species | Human | Gene symbol | MYOF | Gene ID | 26509 |
| Gene name | myoferlin | |
| Gene Alias | FER1L3 | |
| Cytomap | 10q23.33 | |
| Gene Type | protein-coding | GO ID | GO:0000768 | UniProtAcc | Q9NZM1 |
Top |
Malignant transformation analysis |
| Identification of the aberrant gene expression in precancerous and cancerous lesions by comparing the gene expression of stem-like cells in diseased tissues with normal stem cells |
| Entrez ID | Symbol | Replicates | Species | Organ | Tissue | Adj P-value | Log2FC | Malignancy |
| 26509 | MYOF | CA_HPV_3 | Human | Cervix | CC | 1.81e-05 | 7.25e-02 | 0.0414 |
| 26509 | MYOF | N_HPV_1 | Human | Cervix | N_HPV | 1.32e-02 | -2.71e-01 | 0.0079 |
| 26509 | MYOF | CCI_1 | Human | Cervix | CC | 7.68e-12 | 1.31e+00 | 0.528 |
| 26509 | MYOF | CCI_2 | Human | Cervix | CC | 4.01e-04 | 7.37e-01 | 0.5249 |
| 26509 | MYOF | Tumor | Human | Cervix | CC | 1.79e-04 | 2.37e-01 | 0.1241 |
| 26509 | MYOF | sample3 | Human | Cervix | CC | 4.07e-14 | 3.36e-01 | 0.1387 |
| 26509 | MYOF | T3 | Human | Cervix | CC | 3.28e-11 | 3.21e-01 | 0.1389 |
| 26509 | MYOF | HTA11_3410_2000001011 | Human | Colorectum | AD | 2.61e-08 | 3.23e-01 | 0.0155 |
| 26509 | MYOF | HTA11_2487_2000001011 | Human | Colorectum | SER | 1.71e-05 | 5.28e-01 | -0.1808 |
| 26509 | MYOF | HTA11_1938_2000001011 | Human | Colorectum | AD | 1.29e-24 | 1.06e+00 | -0.0811 |
| 26509 | MYOF | HTA11_78_2000001011 | Human | Colorectum | AD | 2.63e-15 | 8.48e-01 | -0.1088 |
| 26509 | MYOF | HTA11_347_2000001011 | Human | Colorectum | AD | 7.63e-23 | 7.81e-01 | -0.1954 |
| 26509 | MYOF | HTA11_411_2000001011 | Human | Colorectum | SER | 1.51e-07 | 1.22e+00 | -0.2602 |
| 26509 | MYOF | HTA11_696_2000001011 | Human | Colorectum | AD | 4.28e-25 | 9.22e-01 | -0.1464 |
| 26509 | MYOF | HTA11_866_2000001011 | Human | Colorectum | AD | 1.42e-10 | 5.01e-01 | -0.1001 |
| 26509 | MYOF | HTA11_1391_2000001011 | Human | Colorectum | AD | 3.35e-21 | 9.92e-01 | -0.059 |
| 26509 | MYOF | HTA11_5212_2000001011 | Human | Colorectum | AD | 3.11e-05 | 6.93e-01 | -0.2061 |
| 26509 | MYOF | HTA11_546_2000001011 | Human | Colorectum | AD | 5.20e-03 | 3.71e-01 | -0.0842 |
| 26509 | MYOF | HTA11_866_3004761011 | Human | Colorectum | AD | 1.24e-02 | 3.30e-01 | 0.096 |
| 26509 | MYOF | HTA11_7696_3000711011 | Human | Colorectum | AD | 2.38e-06 | 4.05e-01 | 0.0674 |
| Page: 1 2 3 4 5 6 7 8 9 10 |
| Tissue | Expression Dynamics | Abbreviation |
| Cervix | 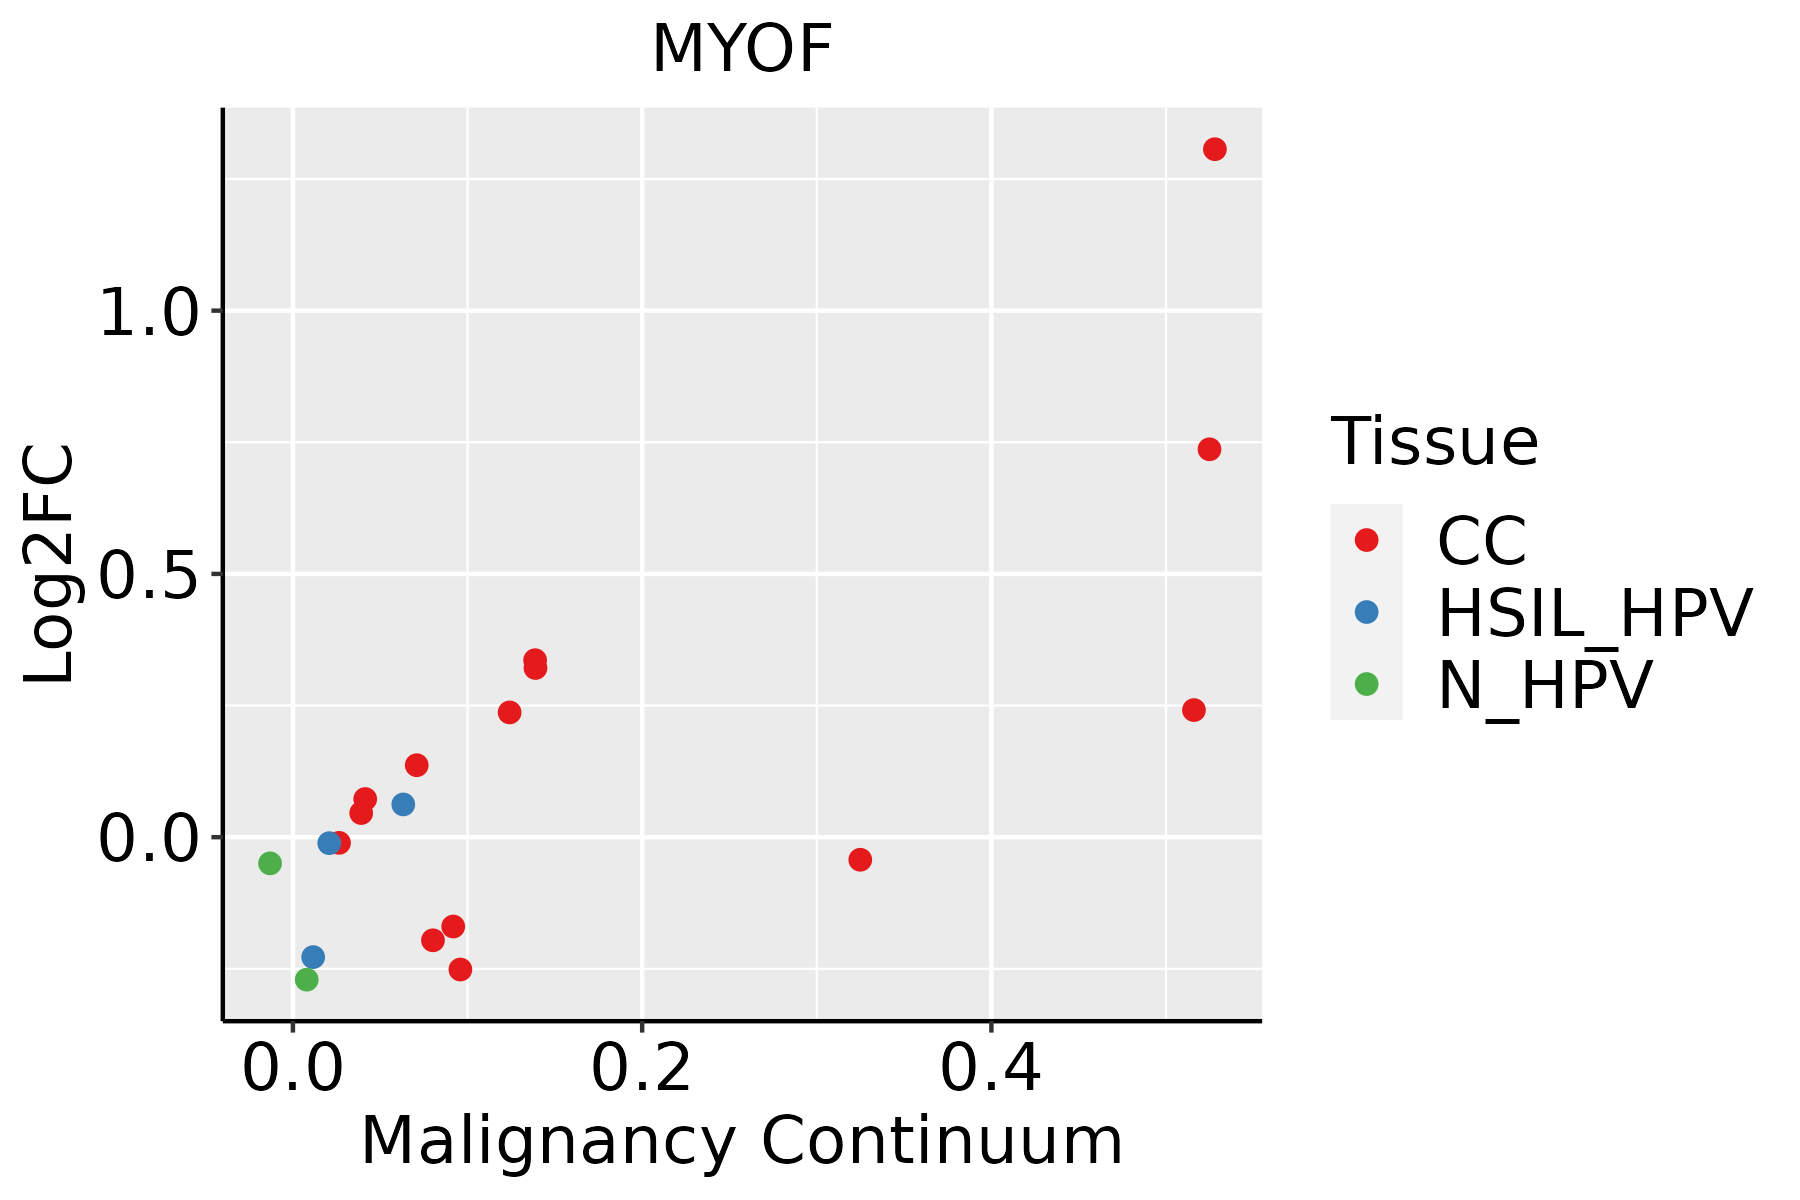 | CC: Cervix cancer |
| HSIL_HPV: HPV-infected high-grade squamous intraepithelial lesions | ||
| N_HPV: HPV-infected normal cervix | ||
| Colorectum (GSE201348) |  | FAP: Familial adenomatous polyposis |
| CRC: Colorectal cancer | ||
| Colorectum (HTA11) |  | AD: Adenomas |
| SER: Sessile serrated lesions | ||
| MSI-H: Microsatellite-high colorectal cancer | ||
| MSS: Microsatellite stable colorectal cancer | ||
| Endometrium |  | AEH: Atypical endometrial hyperplasia |
| EEC: Endometrioid Cancer | ||
| Esophagus |  | ESCC: Esophageal squamous cell carcinoma |
| HGIN: High-grade intraepithelial neoplasias | ||
| LGIN: Low-grade intraepithelial neoplasias | ||
| Lung | 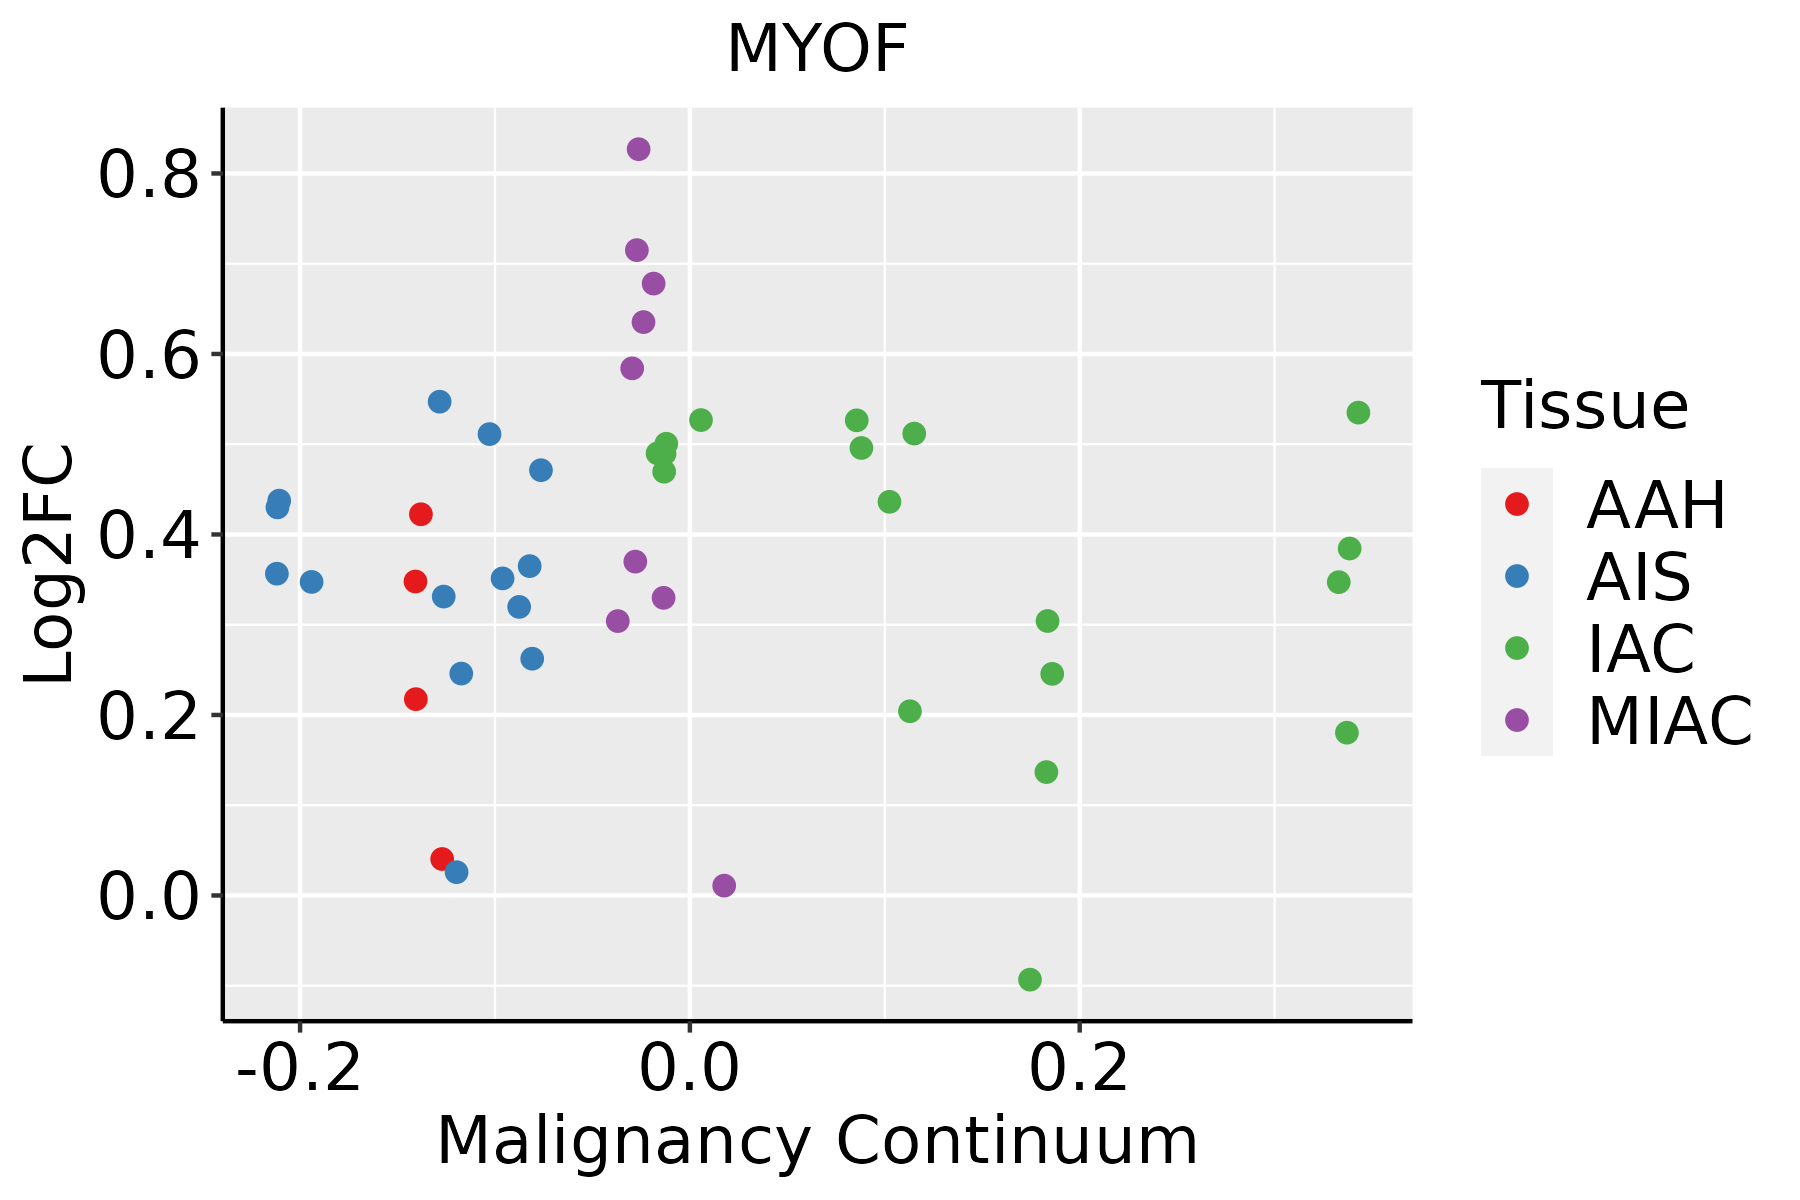 | AAH: Atypical adenomatous hyperplasia |
| AIS: Adenocarcinoma in situ | ||
| IAC: Invasive lung adenocarcinoma | ||
| MIA: Minimally invasive adenocarcinoma | ||
| Oral Cavity |  | EOLP: Erosive Oral lichen planus |
| LP: leukoplakia | ||
| NEOLP: Non-erosive oral lichen planus | ||
| OSCC: Oral squamous cell carcinoma | ||
| Prostate | 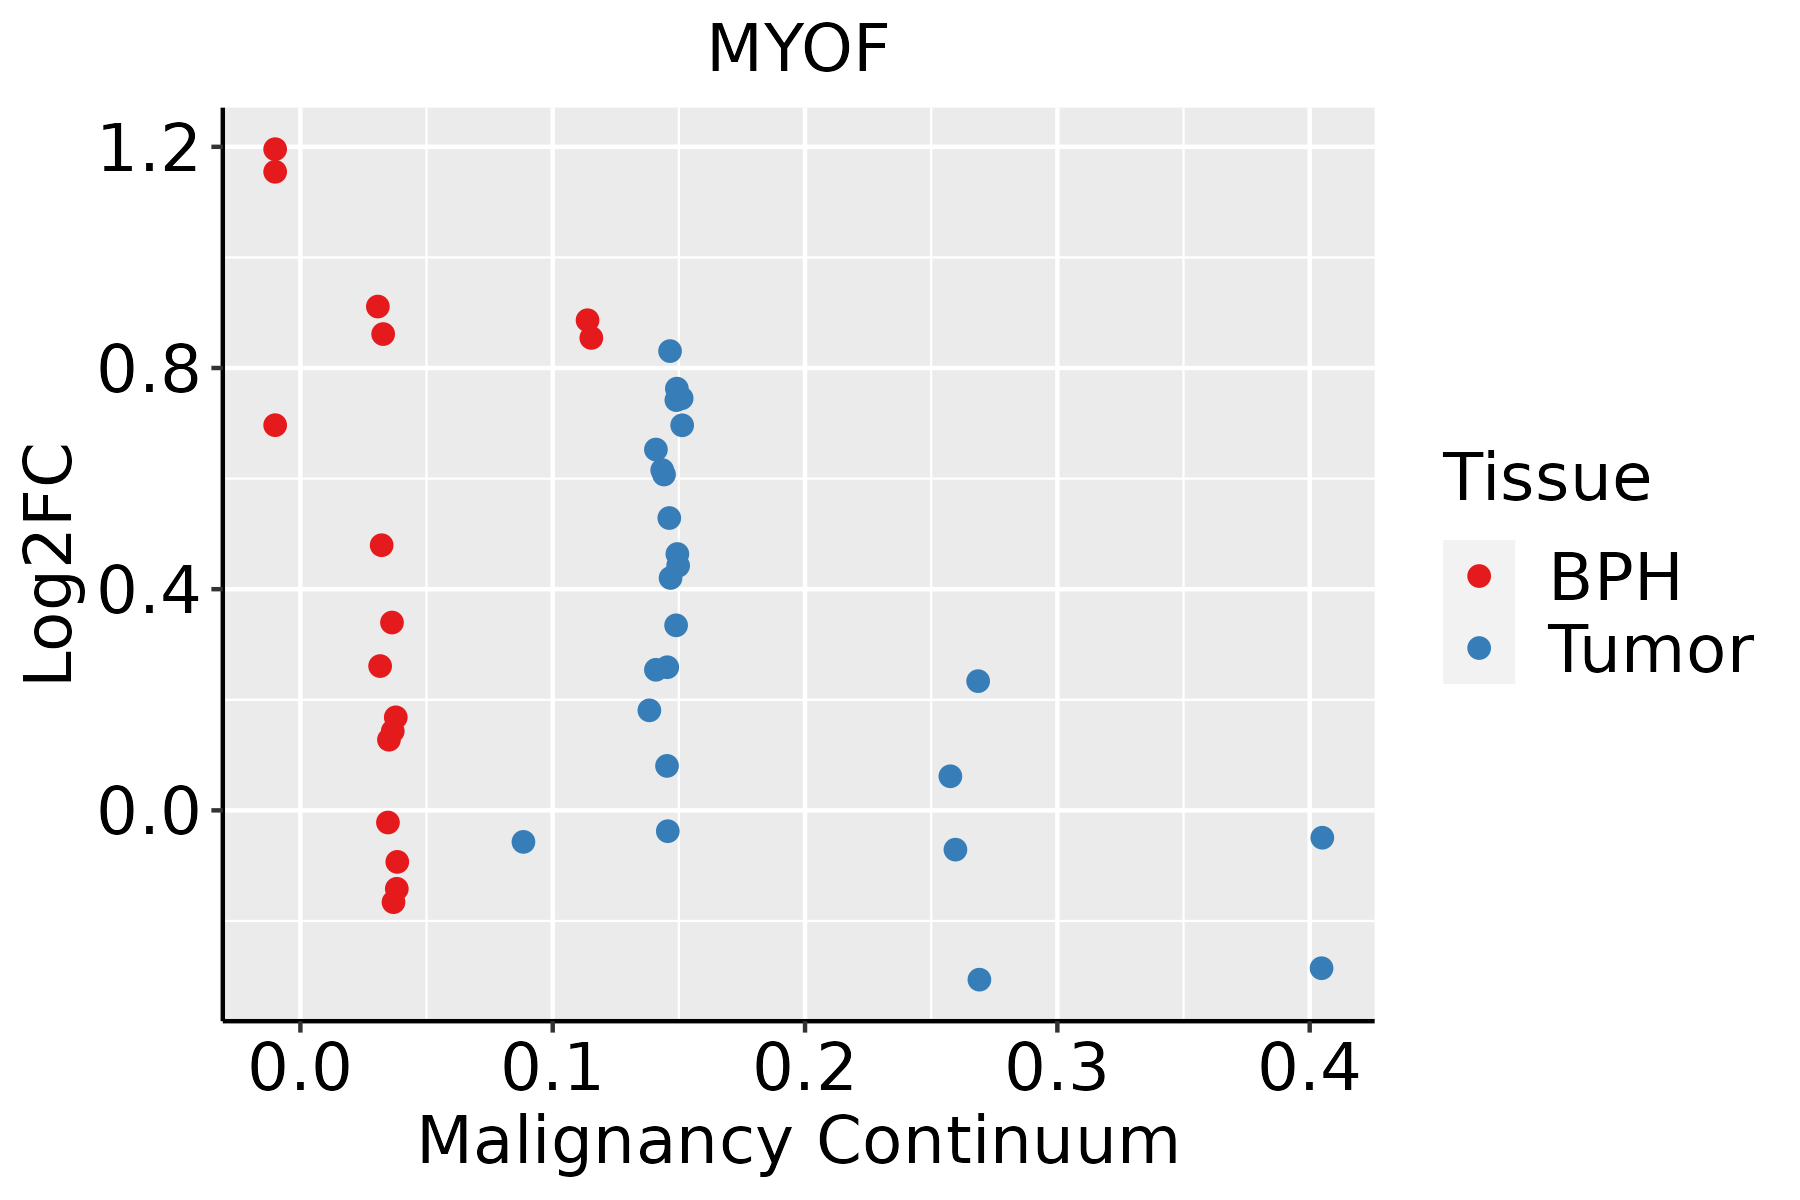 | BPH: Benign Prostatic Hyperplasia |
| Skin | 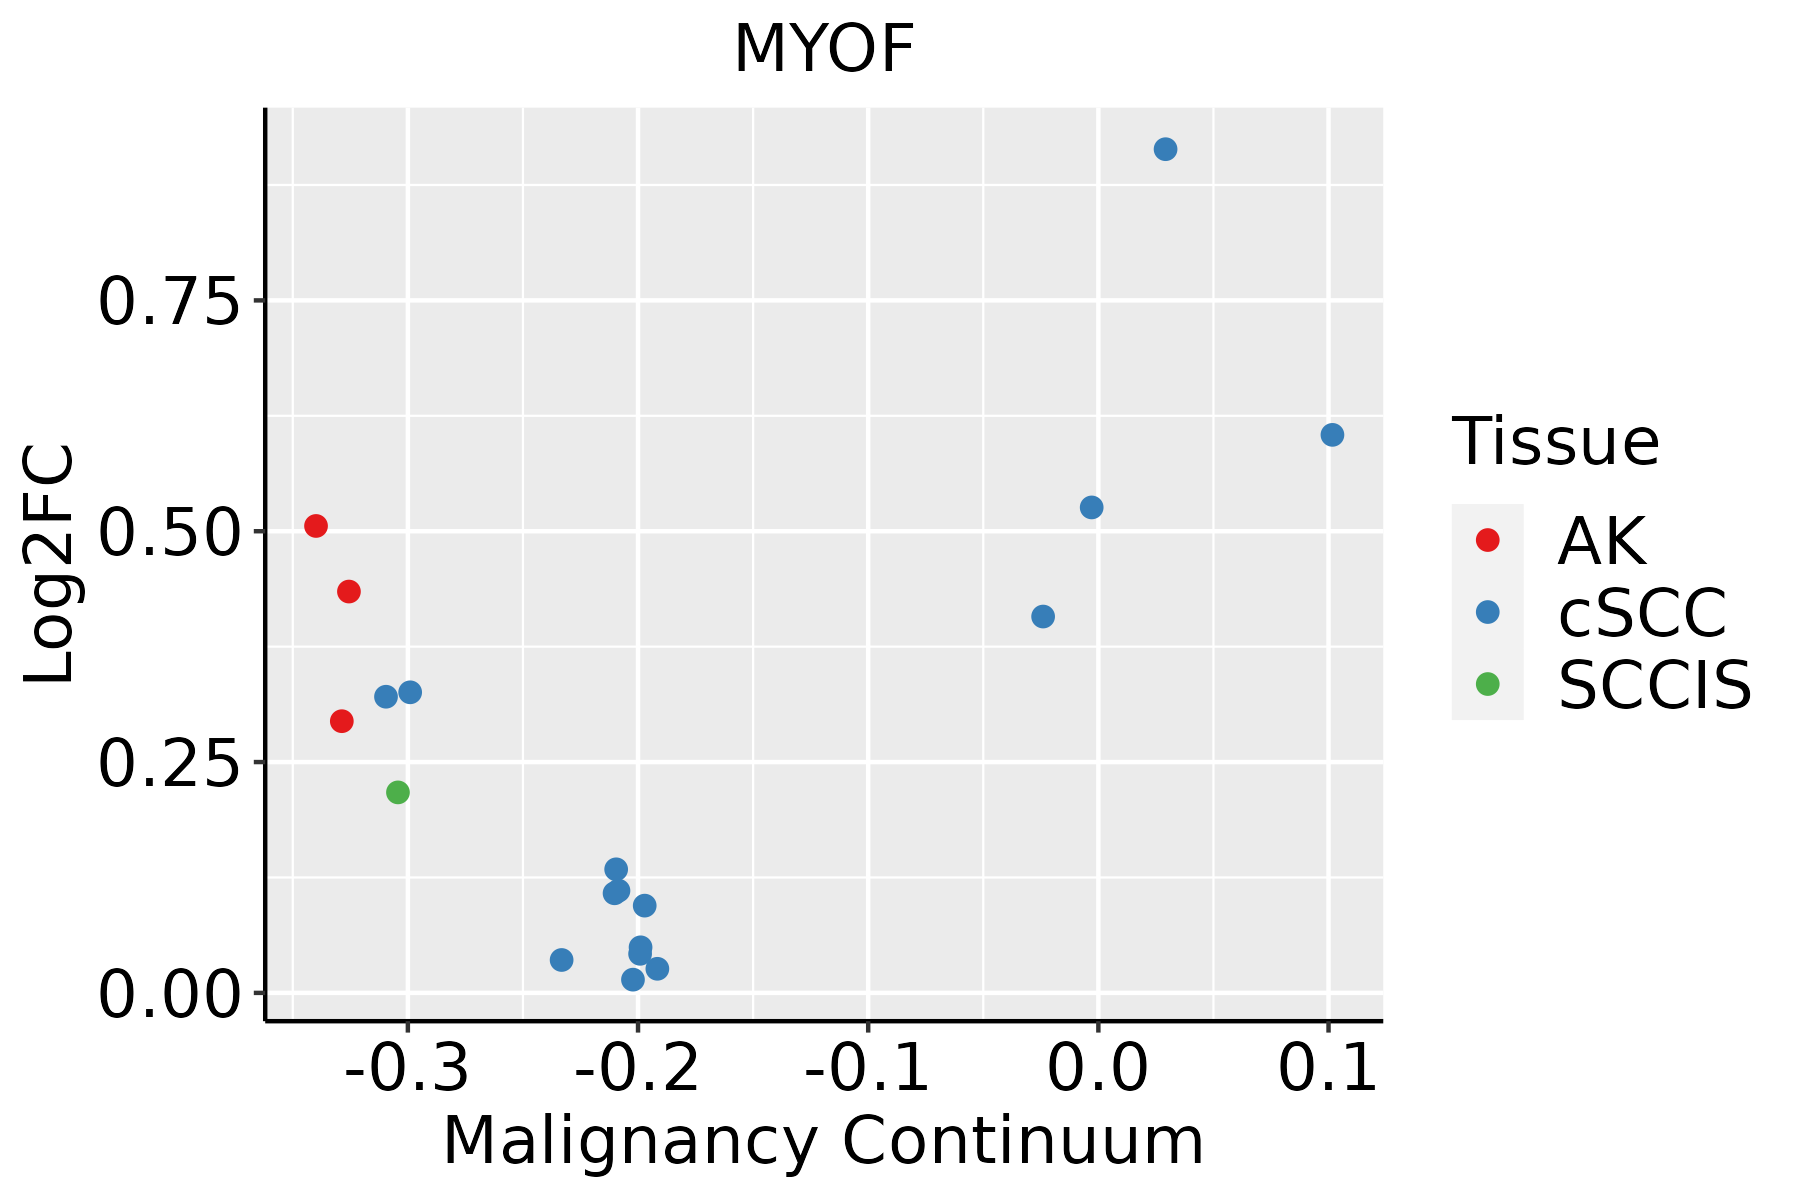 | AK: Actinic keratosis |
| cSCC: Cutaneous squamous cell carcinoma | ||
| SCCIS:squamous cell carcinoma in situ | ||
| Thyroid |  | ATC: Anaplastic thyroid cancer |
| HT: Hashimoto's thyroiditis | ||
| PTC: Papillary thyroid cancer |
| ∗log2FC in expression of this searched gene in stem-like cells from each diseased tissue sample relative to stem-like cells in normal samples in each tissue plotted against the malignancy continuum. Samples are colored based on if they are from different disease stage. |
Top |
Malignant transformation related pathway analysis |
| Find out the enriched GO biological processes and KEGG pathways involved in transition from healthy to precancer to cancer |
| Tissue | Disease Stage | Enriched GO biological Processes |
| Colorectum | AD |  |
| Colorectum | SER |  |
| Colorectum | MSS |  |
| Colorectum | MSI-H |  |
| Colorectum | FAP |  |
| ∗Top 15 enriched GO BP terms are showed in the bar plot of each disease state in each tissue. Each row represents a significant GO biological process which is colored according to the -log10(p.adjust). |
| Page: 1 2 3 4 5 6 7 8 9 |
| GO ID | Tissue | Disease Stage | Description | Gene Ratio | Bg Ratio | pvalue | p.adjust | Count |
| GO:004206010 | Cervix | CC | wound healing | 109/2311 | 422/18723 | 1.84e-14 | 1.57e-11 | 109 |
| GO:00426924 | Cervix | CC | muscle cell differentiation | 69/2311 | 384/18723 | 8.12e-04 | 7.09e-03 | 69 |
| GO:0000768 | Cervix | CC | syncytium formation by plasma membrane fusion | 15/2311 | 55/18723 | 2.14e-03 | 1.54e-02 | 15 |
| GO:0140253 | Cervix | CC | cell-cell fusion | 15/2311 | 55/18723 | 2.14e-03 | 1.54e-02 | 15 |
| GO:00069491 | Cervix | CC | syncytium formation | 15/2311 | 57/18723 | 3.13e-03 | 2.05e-02 | 15 |
| GO:00511464 | Cervix | CC | striated muscle cell differentiation | 50/2311 | 283/18723 | 5.53e-03 | 3.19e-02 | 50 |
| GO:00070092 | Cervix | CC | plasma membrane organization | 28/2311 | 142/18723 | 7.85e-03 | 4.14e-02 | 28 |
| GO:004206025 | Cervix | N_HPV | wound healing | 28/534 | 422/18723 | 3.37e-05 | 8.58e-04 | 28 |
| GO:0042060 | Colorectum | AD | wound healing | 128/3918 | 422/18723 | 2.73e-06 | 7.89e-05 | 128 |
| GO:00420601 | Colorectum | SER | wound healing | 97/2897 | 422/18723 | 2.69e-05 | 7.30e-04 | 97 |
| GO:0007009 | Colorectum | SER | plasma membrane organization | 36/2897 | 142/18723 | 1.50e-03 | 1.62e-02 | 36 |
| GO:0003012 | Colorectum | SER | muscle system process | 92/2897 | 452/18723 | 2.98e-03 | 2.63e-02 | 92 |
| GO:00420602 | Colorectum | MSS | wound healing | 119/3467 | 422/18723 | 5.93e-07 | 2.24e-05 | 119 |
| GO:00030121 | Colorectum | MSS | muscle system process | 105/3467 | 452/18723 | 6.39e-03 | 4.26e-02 | 105 |
| GO:00420604 | Colorectum | FAP | wound healing | 99/2622 | 422/18723 | 9.50e-08 | 6.33e-06 | 99 |
| GO:00030122 | Colorectum | FAP | muscle system process | 89/2622 | 452/18723 | 4.63e-04 | 5.39e-03 | 89 |
| GO:00070091 | Colorectum | FAP | plasma membrane organization | 31/2622 | 142/18723 | 7.20e-03 | 4.38e-02 | 31 |
| GO:004206016 | Endometrium | AEH | wound healing | 91/2100 | 422/18723 | 4.85e-10 | 4.61e-08 | 91 |
| GO:00030126 | Endometrium | AEH | muscle system process | 78/2100 | 452/18723 | 6.89e-05 | 1.06e-03 | 78 |
| GO:00426925 | Endometrium | AEH | muscle cell differentiation | 68/2100 | 384/18723 | 8.88e-05 | 1.30e-03 | 68 |
| Page: 1 2 3 4 5 |
| Pathway ID | Tissue | Disease Stage | Description | Gene Ratio | Bg Ratio | pvalue | p.adjust | qvalue | Count |
| Page: 1 |
Top |
Cell-cell communication analysis |
| Identification of potential cell-cell interactions between two cell types and their ligand-receptor pairs for different disease states |
| Ligand | Receptor | LRpair | Pathway | Tissue | Disease Stage |
| Page: 1 |
Top |
Single-cell gene regulatory network inference analysis |
| Find out the significant the regulons (TFs) and the target genes of each regulon across cell types for different disease states |
| TF | Cell Type | Tissue | Disease Stage | Target Gene | RSS | Regulon Activity |
| ∗The dot plots of a searched regulon are shown for all cell subpopulations in each disease state of each tissue based on the regulon specific score inferred using pySCENIC and by calculating the average expression. |
| Page: 1 |
Top |
Somatic mutation of malignant transformation related genes |
| Annotation of somatic variants for genes involved in malignant transformation |
| Hugo Symbol | Variant Class | Variant Classification | dbSNP RS | HGVSc | HGVSp | HGVSp Short | SWISSPROT | BIOTYPE | SIFT | PolyPhen | Tumor Sample Barcode | Tissue | Histology | Sex | Age | Stage | Therapy Types | Drugs | Outcome |
| MYOF | SNV | Missense_Mutation | novel | c.1168N>C | p.Asp390His | p.D390H | Q9NZM1 | protein_coding | deleterious(0.01) | probably_damaging(0.975) | TCGA-A7-A6VY-01 | Breast | breast invasive carcinoma | Female | <65 | I/II | Chemotherapy | cyclophosphamide | CR |
| MYOF | SNV | Missense_Mutation | rs557119618 | c.409N>A | p.Gly137Arg | p.G137R | Q9NZM1 | protein_coding | tolerated(0.26) | possibly_damaging(0.587) | TCGA-A8-A09I-01 | Breast | breast invasive carcinoma | Female | >=65 | I/II | Hormone Therapy | anastrozole | SD |
| MYOF | SNV | Missense_Mutation | rs543442746 | c.3424N>T | p.Arg1142Cys | p.R1142C | Q9NZM1 | protein_coding | deleterious(0) | probably_damaging(1) | TCGA-A8-A09Z-01 | Breast | breast invasive carcinoma | Female | >=65 | I/II | Unknown | Unknown | SD |
| MYOF | SNV | Missense_Mutation | novel | c.1682N>G | p.Asp561Gly | p.D561G | Q9NZM1 | protein_coding | deleterious(0) | benign(0.301) | TCGA-AN-A046-01 | Breast | breast invasive carcinoma | Female | >=65 | I/II | Unknown | Unknown | SD |
| MYOF | SNV | Missense_Mutation | c.5507N>C | p.Arg1836Thr | p.R1836T | Q9NZM1 | protein_coding | deleterious(0) | probably_damaging(0.999) | TCGA-C8-A26Y-01 | Breast | breast invasive carcinoma | Female | >=65 | I/II | Unknown | Unknown | SD | |
| MYOF | SNV | Missense_Mutation | rs369733924 | c.6088G>A | p.Gly2030Ser | p.G2030S | Q9NZM1 | protein_coding | tolerated(0.26) | benign(0.132) | TCGA-E9-A1NA-01 | Breast | breast invasive carcinoma | Female | <65 | I/II | Chemotherapy | cyclophosphamide | SD |
| MYOF | SNV | Missense_Mutation | c.5757N>G | p.Cys1919Trp | p.C1919W | Q9NZM1 | protein_coding | deleterious(0) | probably_damaging(1) | TCGA-E9-A244-01 | Breast | breast invasive carcinoma | Female | <65 | I/II | Chemotherapy | cyclophosphamide | SD | |
| MYOF | SNV | Missense_Mutation | novel | c.4985N>G | p.Ser1662Cys | p.S1662C | Q9NZM1 | protein_coding | deleterious(0.01) | possibly_damaging(0.653) | TCGA-E9-A3X8-01 | Breast | breast invasive carcinoma | Female | <65 | I/II | Chemotherapy | cyclophosphane | CR |
| MYOF | SNV | Missense_Mutation | c.2564G>C | p.Gly855Ala | p.G855A | Q9NZM1 | protein_coding | tolerated(0.06) | probably_damaging(0.999) | TCGA-GM-A2D9-01 | Breast | breast invasive carcinoma | Female | >=65 | I/II | Hormone Therapy | arimidex | SD | |
| MYOF | insertion | Nonsense_Mutation | novel | c.4612_4613insTATGAGTCCAGATATTACAGAGAGTCCTTGAGTGCTTGTGTGTT | p.Pro1538LeufsTer2 | p.P1538Lfs*2 | Q9NZM1 | protein_coding | TCGA-AN-A0FF-01 | Breast | breast invasive carcinoma | Female | <65 | I/II | Unknown | Unknown | SD |
| Page: 1 2 3 4 5 6 7 8 9 10 11 12 13 14 15 16 17 18 19 20 21 |
Top |
Related drugs of malignant transformation related genes |
| Identification of chemicals and drugs interact with genes involved in malignant transfromation |
| (DGIdb 4.0) |
| Entrez ID | Symbol | Category | Interaction Types | Drug Claim Name | Drug Name | PMIDs |
| Page: 1 |

Copyright 2023-Present -The University of Texas Health Science Center at Houston |