
|
|||||
|
 | |
| |
| |
| |
| |
| |
|
Gene: MYO9B |
Gene summary for MYO9B |
| Gene information | Species | Human | Gene symbol | MYO9B | Gene ID | 4650 |
| Gene name | myosin IXB | |
| Gene Alias | CELIAC4 | |
| Cytomap | 19p13.11 | |
| Gene Type | protein-coding | GO ID | GO:0006928 | UniProtAcc | Q4LE74 |
Top |
Malignant transformation analysis |
| Identification of the aberrant gene expression in precancerous and cancerous lesions by comparing the gene expression of stem-like cells in diseased tissues with normal stem cells |
| Entrez ID | Symbol | Replicates | Species | Organ | Tissue | Adj P-value | Log2FC | Malignancy |
| 4650 | MYO9B | CCI_1 | Human | Cervix | CC | 1.44e-05 | 7.07e-01 | 0.528 |
| 4650 | MYO9B | CCI_3 | Human | Cervix | CC | 1.55e-06 | 6.44e-01 | 0.516 |
| 4650 | MYO9B | AEH-subject1 | Human | Endometrium | AEH | 2.81e-02 | 2.78e-01 | -0.3059 |
| 4650 | MYO9B | AEH-subject2 | Human | Endometrium | AEH | 3.50e-03 | 1.72e-01 | -0.2525 |
| 4650 | MYO9B | AEH-subject4 | Human | Endometrium | AEH | 1.56e-03 | 3.00e-01 | -0.2657 |
| 4650 | MYO9B | EEC-subject5 | Human | Endometrium | EEC | 1.11e-02 | 2.67e-01 | -0.249 |
| 4650 | MYO9B | GSM5276934 | Human | Endometrium | EEC | 1.09e-02 | 2.75e-01 | -0.0913 |
| 4650 | MYO9B | GSM5276937 | Human | Endometrium | EEC | 3.84e-03 | 2.82e-01 | -0.0897 |
| 4650 | MYO9B | GSM6177620_NYU_UCEC1_lib1_lib1 | Human | Endometrium | EEC | 1.80e-05 | -3.15e-02 | -0.1869 |
| 4650 | MYO9B | GSM6177620_NYU_UCEC1_lib2_lib2 | Human | Endometrium | EEC | 1.34e-07 | -4.88e-02 | -0.1875 |
| 4650 | MYO9B | GSM6177620_NYU_UCEC1_lib3_lib3 | Human | Endometrium | EEC | 7.83e-05 | -5.59e-02 | -0.1883 |
| 4650 | MYO9B | GSM6177621_NYU_UCEC2_lib1_lib1 | Human | Endometrium | EEC | 2.71e-04 | -7.84e-02 | -0.1934 |
| 4650 | MYO9B | GSM6177622_NYU_UCEC3_lib1_lib1 | Human | Endometrium | EEC | 1.94e-06 | -8.93e-02 | -0.1917 |
| 4650 | MYO9B | GSM6177622_NYU_UCEC3_lib2_lib2 | Human | Endometrium | EEC | 8.72e-09 | -1.23e-01 | -0.1916 |
| 4650 | MYO9B | GSM6177623_NYU_UCEC3_Vis | Human | Endometrium | EEC | 5.36e-03 | 2.89e-01 | -0.1269 |
| 4650 | MYO9B | LZE4T | Human | Esophagus | ESCC | 2.58e-03 | 1.18e-01 | 0.0811 |
| 4650 | MYO9B | LZE7T | Human | Esophagus | ESCC | 3.21e-11 | 5.16e-01 | 0.0667 |
| 4650 | MYO9B | LZE20T | Human | Esophagus | ESCC | 4.04e-02 | 1.08e-01 | 0.0662 |
| 4650 | MYO9B | LZE22T | Human | Esophagus | ESCC | 6.20e-05 | 3.02e-01 | 0.068 |
| 4650 | MYO9B | LZE24T | Human | Esophagus | ESCC | 1.20e-06 | 2.32e-01 | 0.0596 |
| Page: 1 2 3 4 5 6 7 |
| Tissue | Expression Dynamics | Abbreviation |
| Cervix | 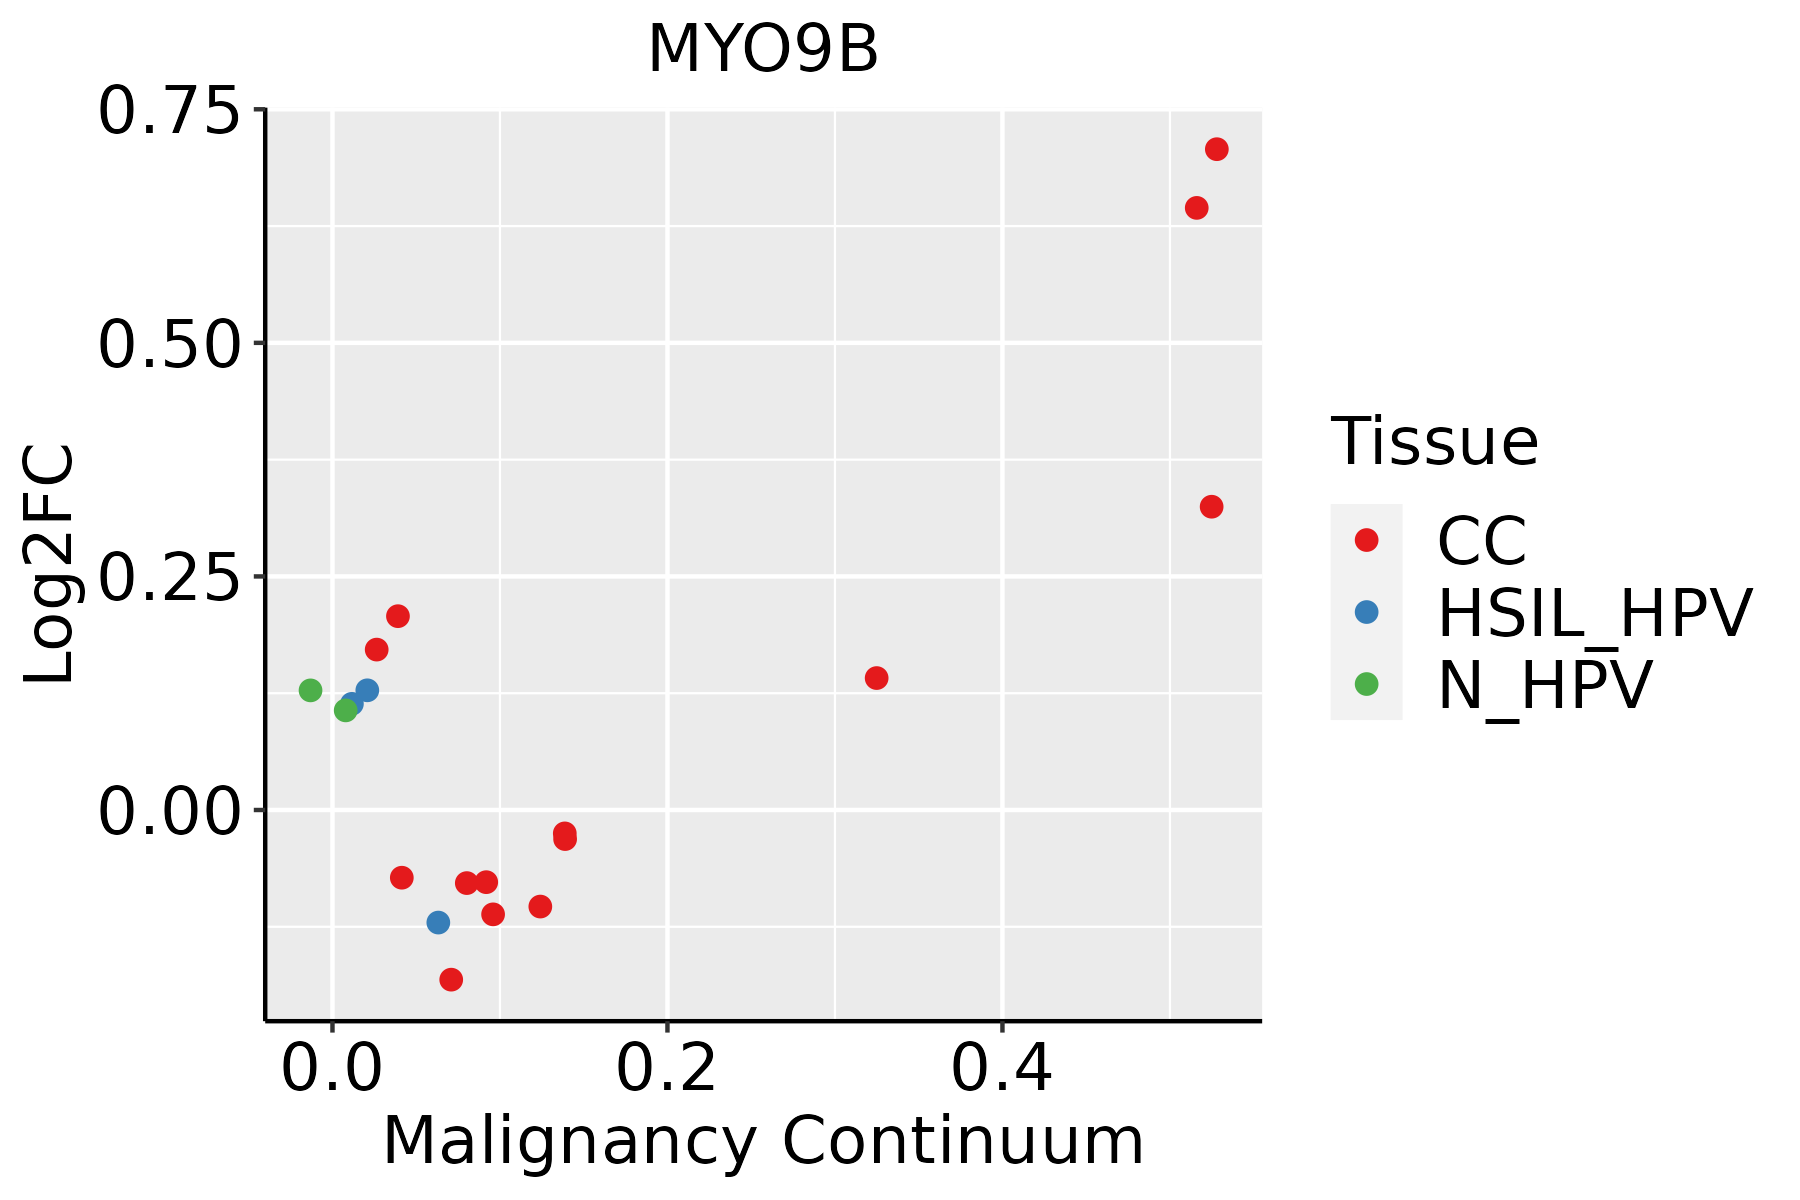 | CC: Cervix cancer |
| HSIL_HPV: HPV-infected high-grade squamous intraepithelial lesions | ||
| N_HPV: HPV-infected normal cervix | ||
| Endometrium | 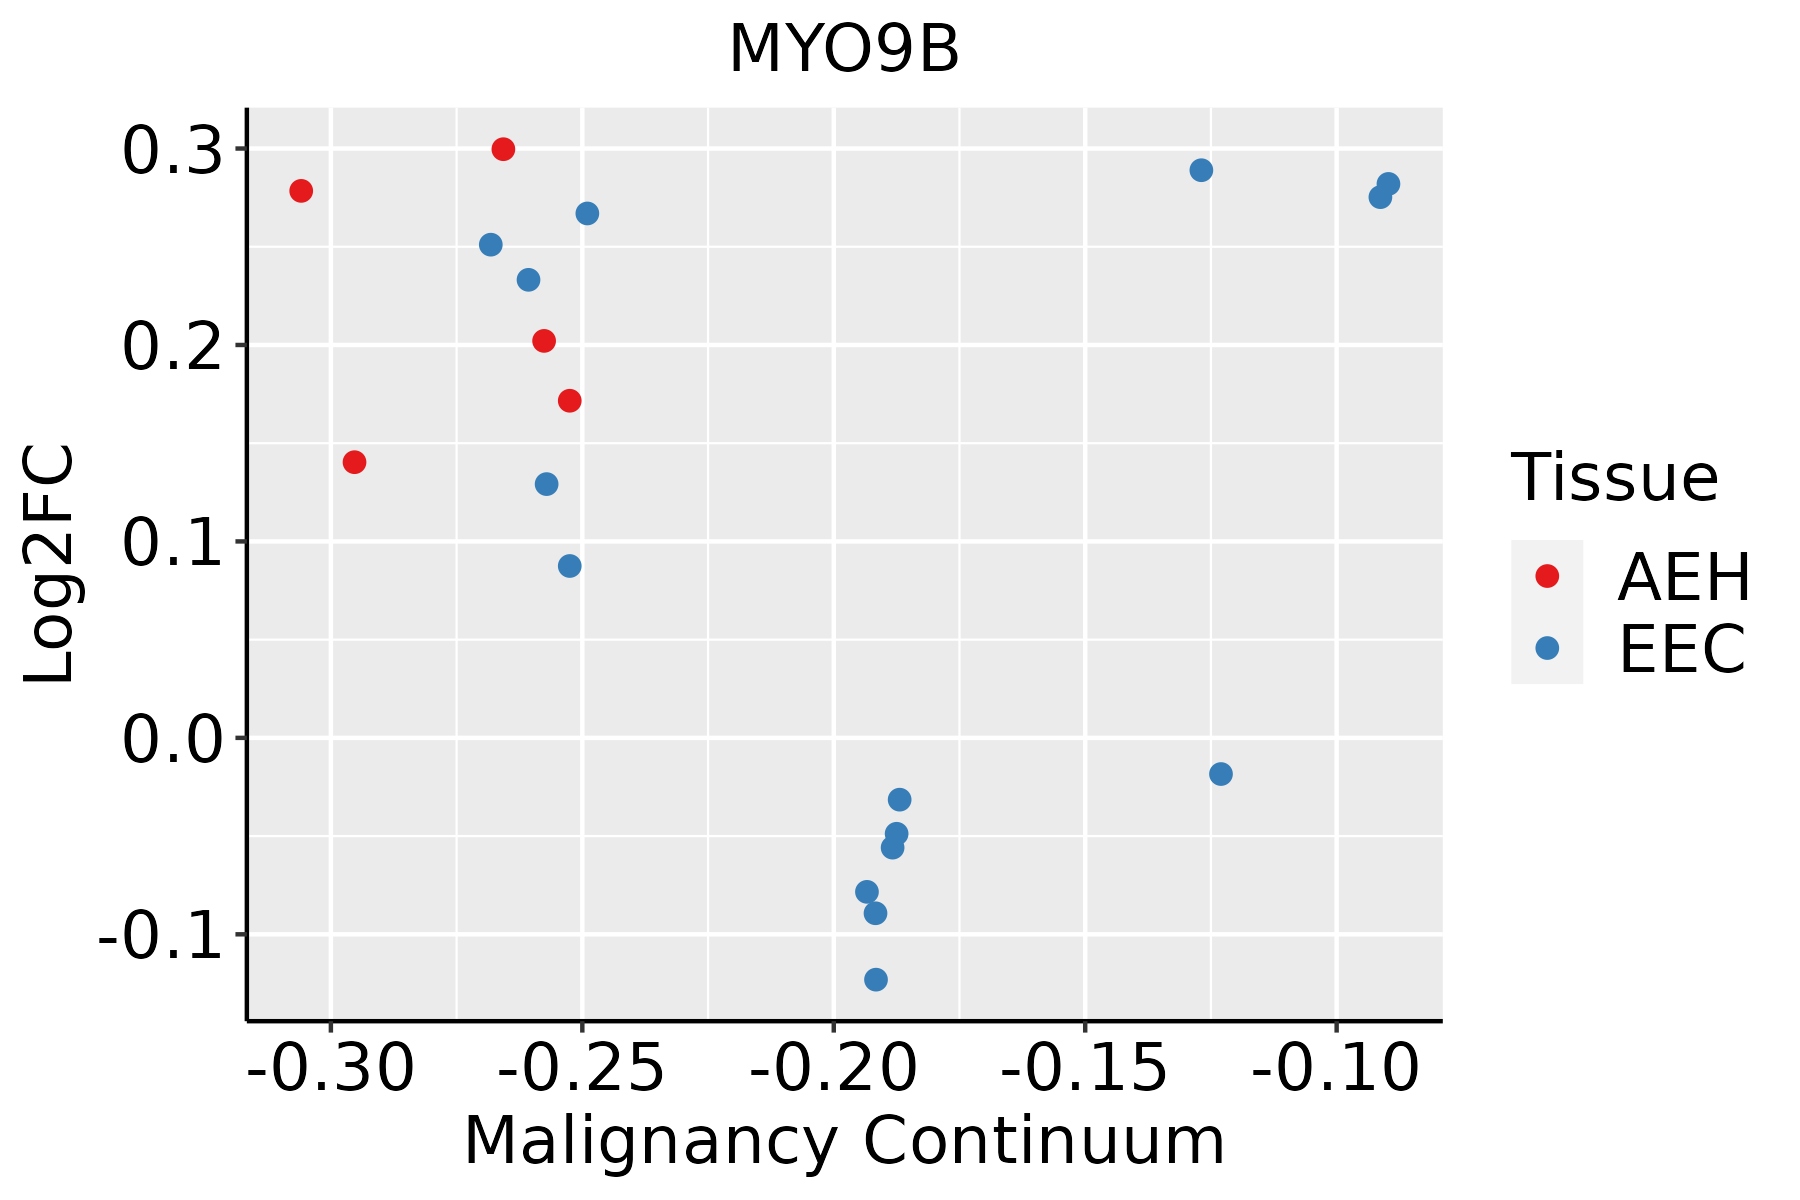 | AEH: Atypical endometrial hyperplasia |
| EEC: Endometrioid Cancer | ||
| Esophagus |  | ESCC: Esophageal squamous cell carcinoma |
| HGIN: High-grade intraepithelial neoplasias | ||
| LGIN: Low-grade intraepithelial neoplasias | ||
| Liver | 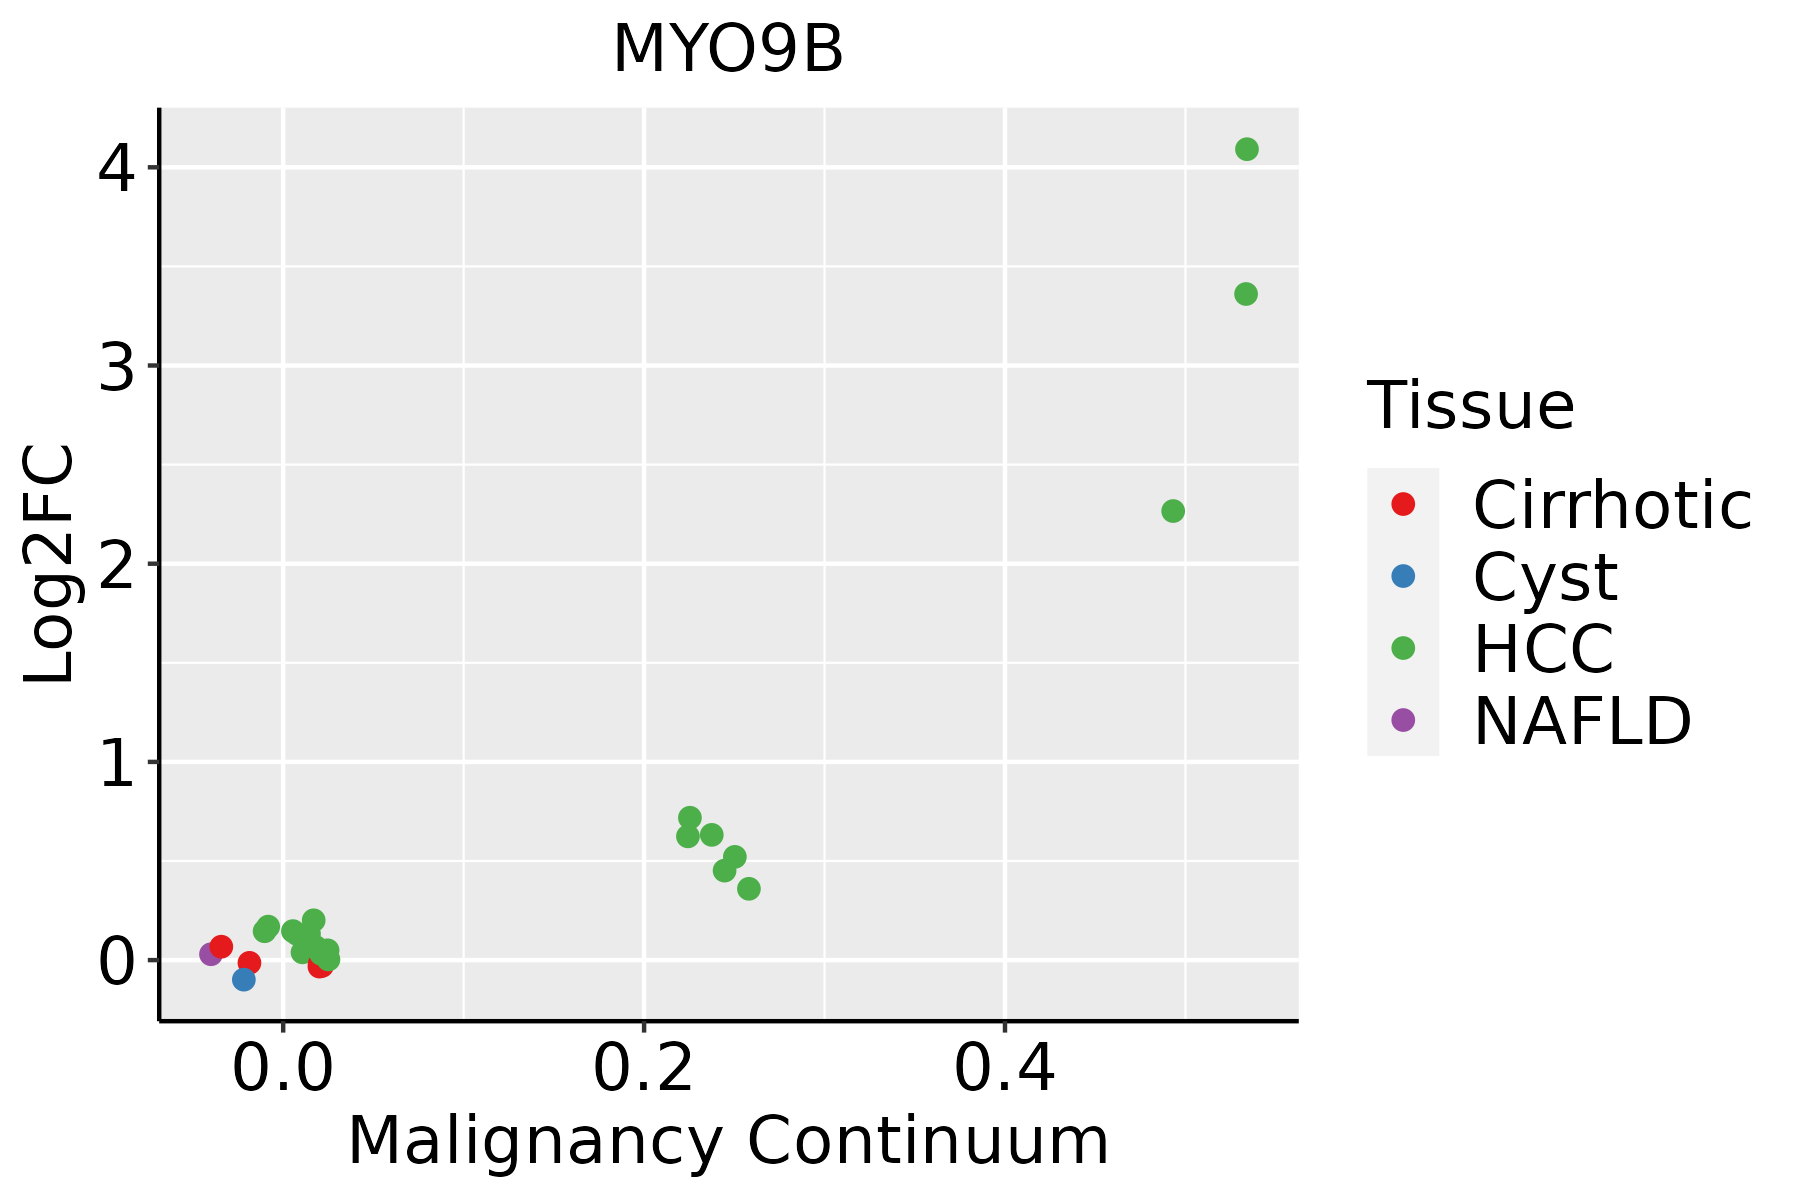 | HCC: Hepatocellular carcinoma |
| NAFLD: Non-alcoholic fatty liver disease | ||
| Oral Cavity |  | EOLP: Erosive Oral lichen planus |
| LP: leukoplakia | ||
| NEOLP: Non-erosive oral lichen planus | ||
| OSCC: Oral squamous cell carcinoma | ||
| Prostate |  | BPH: Benign Prostatic Hyperplasia |
| Thyroid | 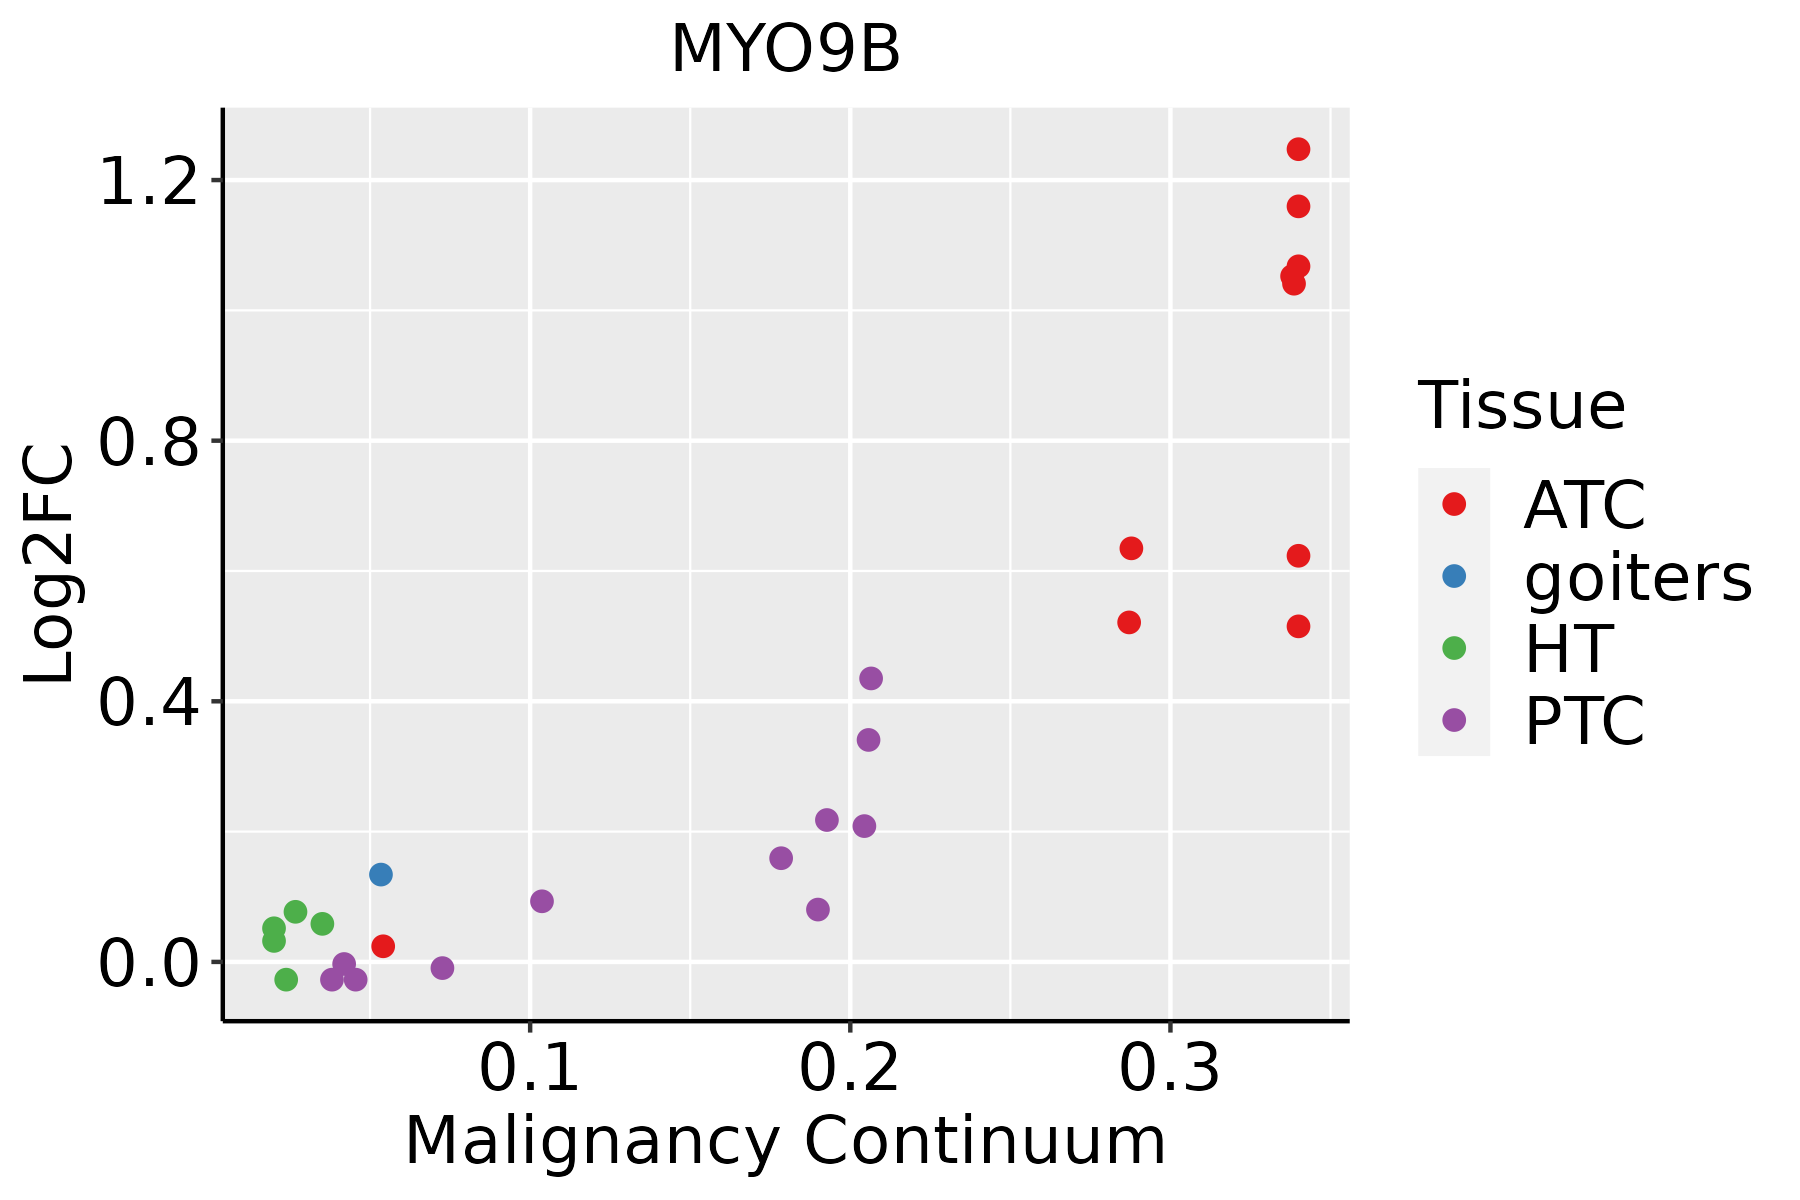 | ATC: Anaplastic thyroid cancer |
| HT: Hashimoto's thyroiditis | ||
| PTC: Papillary thyroid cancer |
| ∗log2FC in expression of this searched gene in stem-like cells from each diseased tissue sample relative to stem-like cells in normal samples in each tissue plotted against the malignancy continuum. Samples are colored based on if they are from different disease stage. |
Top |
Malignant transformation related pathway analysis |
| Find out the enriched GO biological processes and KEGG pathways involved in transition from healthy to precancer to cancer |
| Tissue | Disease Stage | Enriched GO biological Processes |
| Colorectum | AD |  |
| Colorectum | SER |  |
| Colorectum | MSS |  |
| Colorectum | MSI-H |  |
| Colorectum | FAP |  |
| ∗Top 15 enriched GO BP terms are showed in the bar plot of each disease state in each tissue. Each row represents a significant GO biological process which is colored according to the -log10(p.adjust). |
| Page: 1 2 3 4 5 6 7 8 9 |
| GO ID | Tissue | Disease Stage | Description | Gene Ratio | Bg Ratio | pvalue | p.adjust | Count |
| GO:00510566 | Cervix | CC | regulation of small GTPase mediated signal transduction | 75/2311 | 302/18723 | 1.54e-09 | 1.74e-07 | 75 |
| GO:00072656 | Cervix | CC | Ras protein signal transduction | 79/2311 | 337/18723 | 9.49e-09 | 7.77e-07 | 79 |
| GO:00072666 | Cervix | CC | Rho protein signal transduction | 35/2311 | 137/18723 | 1.77e-05 | 3.33e-04 | 35 |
| GO:00465785 | Cervix | CC | regulation of Ras protein signal transduction | 44/2311 | 189/18723 | 2.05e-05 | 3.73e-04 | 44 |
| GO:00350235 | Cervix | CC | regulation of Rho protein signal transduction | 22/2311 | 86/18723 | 5.93e-04 | 5.60e-03 | 22 |
| GO:00300487 | Cervix | CC | actin filament-based movement | 29/2311 | 127/18723 | 6.91e-04 | 6.33e-03 | 29 |
| GO:00510567 | Endometrium | AEH | regulation of small GTPase mediated signal transduction | 59/2100 | 302/18723 | 1.43e-05 | 3.03e-04 | 59 |
| GO:00300488 | Endometrium | AEH | actin filament-based movement | 31/2100 | 127/18723 | 2.10e-05 | 4.14e-04 | 31 |
| GO:00072657 | Endometrium | AEH | Ras protein signal transduction | 63/2100 | 337/18723 | 3.09e-05 | 5.66e-04 | 63 |
| GO:00465786 | Endometrium | AEH | regulation of Ras protein signal transduction | 36/2100 | 189/18723 | 1.01e-03 | 8.97e-03 | 36 |
| GO:00072667 | Endometrium | AEH | Rho protein signal transduction | 28/2100 | 137/18723 | 1.17e-03 | 1.01e-02 | 28 |
| GO:00350236 | Endometrium | AEH | regulation of Rho protein signal transduction | 18/2100 | 86/18723 | 6.39e-03 | 3.79e-02 | 18 |
| GO:005105612 | Endometrium | EEC | regulation of small GTPase mediated signal transduction | 61/2168 | 302/18723 | 9.42e-06 | 2.08e-04 | 61 |
| GO:003004814 | Endometrium | EEC | actin filament-based movement | 31/2168 | 127/18723 | 3.90e-05 | 6.56e-04 | 31 |
| GO:000726513 | Endometrium | EEC | Ras protein signal transduction | 64/2168 | 337/18723 | 4.31e-05 | 7.10e-04 | 64 |
| GO:000726613 | Endometrium | EEC | Rho protein signal transduction | 30/2168 | 137/18723 | 4.05e-04 | 4.31e-03 | 30 |
| GO:004657813 | Endometrium | EEC | regulation of Ras protein signal transduction | 37/2168 | 189/18723 | 9.23e-04 | 8.32e-03 | 37 |
| GO:003502313 | Endometrium | EEC | regulation of Rho protein signal transduction | 20/2168 | 86/18723 | 1.65e-03 | 1.29e-02 | 20 |
| GO:000726510 | Esophagus | ESCC | Ras protein signal transduction | 201/8552 | 337/18723 | 1.44e-07 | 2.30e-06 | 201 |
| GO:000726610 | Esophagus | ESCC | Rho protein signal transduction | 81/8552 | 137/18723 | 1.03e-03 | 5.20e-03 | 81 |
| Page: 1 2 3 |
| Pathway ID | Tissue | Disease Stage | Description | Gene Ratio | Bg Ratio | pvalue | p.adjust | qvalue | Count |
| hsa048144 | Endometrium | AEH | Motor proteins | 42/1197 | 193/8465 | 2.41e-03 | 1.42e-02 | 1.04e-02 | 42 |
| hsa0481411 | Endometrium | AEH | Motor proteins | 42/1197 | 193/8465 | 2.41e-03 | 1.42e-02 | 1.04e-02 | 42 |
| hsa048145 | Oral cavity | NEOLP | Motor proteins | 37/1112 | 193/8465 | 1.06e-02 | 3.54e-02 | 2.22e-02 | 37 |
| hsa0481412 | Oral cavity | NEOLP | Motor proteins | 37/1112 | 193/8465 | 1.06e-02 | 3.54e-02 | 2.22e-02 | 37 |
| Page: 1 |
Top |
Cell-cell communication analysis |
| Identification of potential cell-cell interactions between two cell types and their ligand-receptor pairs for different disease states |
| Ligand | Receptor | LRpair | Pathway | Tissue | Disease Stage |
| Page: 1 |
Top |
Single-cell gene regulatory network inference analysis |
| Find out the significant the regulons (TFs) and the target genes of each regulon across cell types for different disease states |
| TF | Cell Type | Tissue | Disease Stage | Target Gene | RSS | Regulon Activity |
| ∗The dot plots of a searched regulon are shown for all cell subpopulations in each disease state of each tissue based on the regulon specific score inferred using pySCENIC and by calculating the average expression. |
| Page: 1 |
Top |
Somatic mutation of malignant transformation related genes |
| Annotation of somatic variants for genes involved in malignant transformation |
| Hugo Symbol | Variant Class | Variant Classification | dbSNP RS | HGVSc | HGVSp | HGVSp Short | SWISSPROT | BIOTYPE | SIFT | PolyPhen | Tumor Sample Barcode | Tissue | Histology | Sex | Age | Stage | Therapy Types | Drugs | Outcome |
| MYO9B | SNV | Missense_Mutation | rs765947052 | c.304N>A | p.Glu102Lys | p.E102K | Q13459 | protein_coding | tolerated(0.35) | benign(0.003) | TCGA-A8-A094-01 | Breast | breast invasive carcinoma | Female | >=65 | I/II | Unknown | Unknown | SD |
| MYO9B | SNV | Missense_Mutation | novel | c.364N>G | p.His122Asp | p.H122D | Q13459 | protein_coding | tolerated(0.07) | benign(0.045) | TCGA-BH-A0B6-01 | Breast | breast invasive carcinoma | Female | <65 | I/II | Unknown | Unknown | SD |
| MYO9B | SNV | Missense_Mutation | c.4836N>T | p.Lys1612Asn | p.K1612N | Q13459 | protein_coding | deleterious(0) | probably_damaging(0.994) | TCGA-BH-A0EB-01 | Breast | breast invasive carcinoma | Female | >=65 | I/II | Hormone Therapy | arimidex | SD | |
| MYO9B | SNV | Missense_Mutation | c.3385N>T | p.Pro1129Ser | p.P1129S | Q13459 | protein_coding | tolerated(0.45) | benign(0) | TCGA-BH-A18G-01 | Breast | breast invasive carcinoma | Female | >=65 | I/II | Unknown | Unknown | SD | |
| MYO9B | SNV | Missense_Mutation | rs751354042 | c.4186N>A | p.Ala1396Thr | p.A1396T | Q13459 | protein_coding | tolerated(0.71) | benign(0) | TCGA-BH-A18G-01 | Breast | breast invasive carcinoma | Female | >=65 | I/II | Unknown | Unknown | SD |
| MYO9B | SNV | Missense_Mutation | c.5704G>A | p.Glu1902Lys | p.E1902K | Q13459 | protein_coding | deleterious(0) | probably_damaging(0.986) | TCGA-BH-A1FC-01 | Breast | breast invasive carcinoma | Female | >=65 | I/II | Unknown | Unknown | SD | |
| MYO9B | SNV | Missense_Mutation | c.4735N>A | p.Glu1579Lys | p.E1579K | Q13459 | protein_coding | tolerated(0.2) | benign(0.021) | TCGA-D8-A27G-01 | Breast | breast invasive carcinoma | Female | >=65 | I/II | Unknown | Unknown | SD | |
| MYO9B | insertion | Frame_Shift_Ins | novel | c.3411_3412insACTGTCTCTAAAAGCAAAA | p.His1138ThrfsTer18 | p.H1138Tfs*18 | Q13459 | protein_coding | TCGA-BH-A0AY-01 | Breast | breast invasive carcinoma | Female | <65 | I/II | Chemotherapy | SD | |||
| MYO9B | SNV | Missense_Mutation | c.1373N>T | p.Thr458Met | p.T458M | Q13459 | protein_coding | deleterious(0.03) | probably_damaging(0.995) | TCGA-2W-A8YY-01 | Cervix | cervical & endocervical cancer | Female | <65 | I/II | Chemotherapy | cisplatin | CR | |
| MYO9B | SNV | Missense_Mutation | rs767106410 | c.4738N>T | p.Arg1580Cys | p.R1580C | Q13459 | protein_coding | deleterious(0.01) | possibly_damaging(0.794) | TCGA-2W-A8YY-01 | Cervix | cervical & endocervical cancer | Female | <65 | I/II | Chemotherapy | cisplatin | CR |
| Page: 1 2 3 4 5 6 7 8 9 10 11 12 13 14 15 16 |
Top |
Related drugs of malignant transformation related genes |
| Identification of chemicals and drugs interact with genes involved in malignant transfromation |
| (DGIdb 4.0) |
| Entrez ID | Symbol | Category | Interaction Types | Drug Claim Name | Drug Name | PMIDs |
| 4650 | MYO9B | NA | SALT | VOLANESORSEN SODIUM | 8987990 | |
| 4650 | MYO9B | NA | STREPTOZOTOCIN | STREPTOZOCIN | 2523196 | |
| 4650 | MYO9B | NA | PTHRP | 10985428 | ||
| 4650 | MYO9B | NA | WORTMANNIN | WORTMANNIN | 15823093 | |
| 4650 | MYO9B | NA | TESTOSTERONE | TESTOSTERONE | 8409979 | |
| 4650 | MYO9B | NA | PROPYLTHIOURACIL | PROPYLTHIOURACIL | 3989729 | |
| 4650 | MYO9B | NA | CAPTOPRIL | CAPTOPRIL | 10052650 | |
| 4650 | MYO9B | NA | FELODIPINE | FELODIPINE | 2833901 | |
| 4650 | MYO9B | NA | CAFFEINE | CAFFEINE | 8495738 | |
| 4650 | MYO9B | NA | NIFEDIPINE | NIFEDIPINE | 3161480 |
| Page: 1 2 |

Copyright 2023-Present -The University of Texas Health Science Center at Houston |