
|
|||||
|
 | |
| |
| |
| |
| |
| |
|
Gene: MYO7B |
Gene summary for MYO7B |
| Gene information | Species | Human | Gene symbol | MYO7B | Gene ID | 4648 |
| Gene name | myosin VIIB | |
| Gene Alias | MYO7B | |
| Cytomap | 2q14.3 | |
| Gene Type | protein-coding | GO ID | GO:0003008 | UniProtAcc | Q6PIF6 |
Top |
Malignant transformation analysis |
| Identification of the aberrant gene expression in precancerous and cancerous lesions by comparing the gene expression of stem-like cells in diseased tissues with normal stem cells |
| Entrez ID | Symbol | Replicates | Species | Organ | Tissue | Adj P-value | Log2FC | Malignancy |
| 4648 | MYO7B | HTA11_3410_2000001011 | Human | Colorectum | AD | 4.47e-15 | -5.84e-01 | 0.0155 |
| 4648 | MYO7B | HTA11_411_2000001011 | Human | Colorectum | SER | 5.33e-04 | 8.30e-01 | -0.2602 |
| 4648 | MYO7B | HTA11_866_3004761011 | Human | Colorectum | AD | 6.75e-07 | -4.00e-01 | 0.096 |
| 4648 | MYO7B | HTA11_99999970781_79442 | Human | Colorectum | MSS | 3.16e-10 | -4.97e-01 | 0.294 |
| 4648 | MYO7B | A001-C-207 | Human | Colorectum | FAP | 8.82e-03 | -1.66e-01 | 0.1278 |
| 4648 | MYO7B | A015-C-203 | Human | Colorectum | FAP | 1.70e-23 | -2.24e-01 | -0.1294 |
| 4648 | MYO7B | A015-C-204 | Human | Colorectum | FAP | 3.25e-06 | -2.30e-01 | -0.0228 |
| 4648 | MYO7B | A014-C-040 | Human | Colorectum | FAP | 5.67e-04 | -3.90e-01 | -0.1184 |
| 4648 | MYO7B | A002-C-201 | Human | Colorectum | FAP | 5.19e-16 | -3.52e-01 | 0.0324 |
| 4648 | MYO7B | A002-C-203 | Human | Colorectum | FAP | 4.90e-03 | -1.03e-01 | 0.2786 |
| 4648 | MYO7B | A001-C-119 | Human | Colorectum | FAP | 6.27e-08 | -3.74e-01 | -0.1557 |
| 4648 | MYO7B | A001-C-108 | Human | Colorectum | FAP | 7.35e-13 | -1.23e-01 | -0.0272 |
| 4648 | MYO7B | A002-C-205 | Human | Colorectum | FAP | 4.02e-23 | -3.24e-01 | -0.1236 |
| 4648 | MYO7B | A015-C-006 | Human | Colorectum | FAP | 1.35e-15 | -2.68e-01 | -0.0994 |
| 4648 | MYO7B | A015-C-106 | Human | Colorectum | FAP | 1.24e-08 | -8.97e-02 | -0.0511 |
| 4648 | MYO7B | A002-C-114 | Human | Colorectum | FAP | 6.99e-18 | -2.57e-01 | -0.1561 |
| 4648 | MYO7B | A015-C-104 | Human | Colorectum | FAP | 1.39e-26 | -3.00e-01 | -0.1899 |
| 4648 | MYO7B | A001-C-014 | Human | Colorectum | FAP | 2.69e-14 | -1.53e-01 | 0.0135 |
| 4648 | MYO7B | A002-C-016 | Human | Colorectum | FAP | 1.65e-16 | -2.86e-01 | 0.0521 |
| 4648 | MYO7B | A015-C-002 | Human | Colorectum | FAP | 1.09e-13 | -3.48e-01 | -0.0763 |
| Page: 1 2 |
| Tissue | Expression Dynamics | Abbreviation |
| Colorectum (GSE201348) |  | FAP: Familial adenomatous polyposis |
| CRC: Colorectal cancer | ||
| Colorectum (HTA11) |  | AD: Adenomas |
| SER: Sessile serrated lesions | ||
| MSI-H: Microsatellite-high colorectal cancer | ||
| MSS: Microsatellite stable colorectal cancer | ||
| GC | 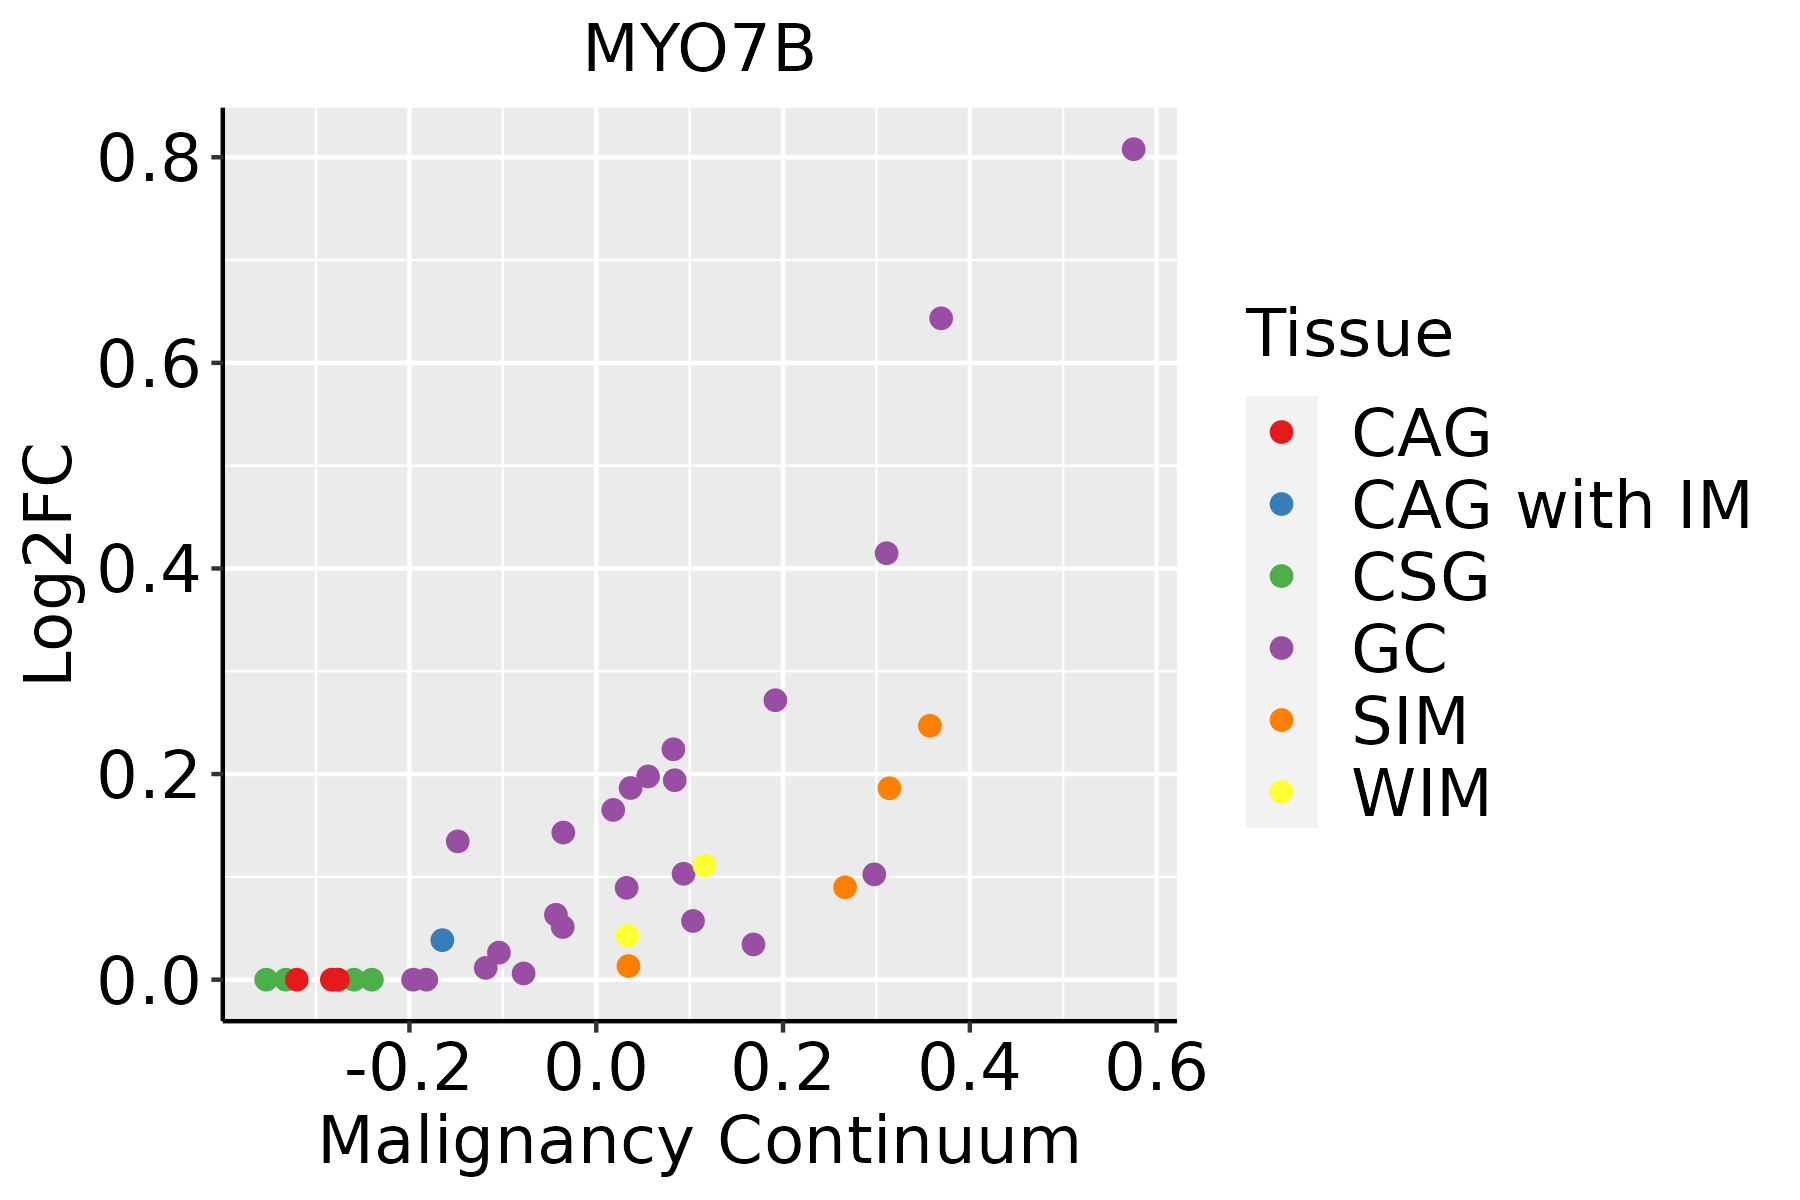 | CAG: Chronic atrophic gastritis |
| CAG with IM: Chronic atrophic gastritis with intestinal metaplasia | ||
| CSG: Chronic superficial gastritis | ||
| GC: Gastric cancer | ||
| SIM: Severe intestinal metaplasia | ||
| WIM: Wild intestinal metaplasia |
| ∗log2FC in expression of this searched gene in stem-like cells from each diseased tissue sample relative to stem-like cells in normal samples in each tissue plotted against the malignancy continuum. Samples are colored based on if they are from different disease stage. |
Top |
Malignant transformation related pathway analysis |
| Find out the enriched GO biological processes and KEGG pathways involved in transition from healthy to precancer to cancer |
| Tissue | Disease Stage | Enriched GO biological Processes |
| Colorectum | AD |  |
| Colorectum | SER |  |
| Colorectum | MSS |  |
| Colorectum | MSI-H |  |
| Colorectum | FAP |  |
| ∗Top 15 enriched GO BP terms are showed in the bar plot of each disease state in each tissue. Each row represents a significant GO biological process which is colored according to the -log10(p.adjust). |
| Page: 1 2 3 4 5 6 7 8 9 |
| GO ID | Tissue | Disease Stage | Description | Gene Ratio | Bg Ratio | pvalue | p.adjust | Count |
| GO:0007015 | Colorectum | AD | actin filament organization | 167/3918 | 442/18723 | 1.65e-16 | 7.94e-14 | 167 |
| GO:0051656 | Colorectum | AD | establishment of organelle localization | 131/3918 | 390/18723 | 3.00e-09 | 2.06e-07 | 131 |
| GO:0051650 | Colorectum | AD | establishment of vesicle localization | 57/3918 | 161/18723 | 1.47e-05 | 3.15e-04 | 57 |
| GO:0051648 | Colorectum | AD | vesicle localization | 59/3918 | 177/18723 | 7.83e-05 | 1.25e-03 | 59 |
| GO:0030048 | Colorectum | AD | actin filament-based movement | 44/3918 | 127/18723 | 2.31e-04 | 2.99e-03 | 44 |
| GO:0099515 | Colorectum | AD | actin filament-based transport | 12/3918 | 21/18723 | 3.02e-04 | 3.62e-03 | 12 |
| GO:0030050 | Colorectum | AD | vesicle transport along actin filament | 11/3918 | 19/18723 | 4.66e-04 | 5.15e-03 | 11 |
| GO:0030705 | Colorectum | AD | cytoskeleton-dependent intracellular transport | 60/3918 | 195/18723 | 7.56e-04 | 7.59e-03 | 60 |
| GO:00070151 | Colorectum | SER | actin filament organization | 134/2897 | 442/18723 | 1.39e-15 | 5.70e-13 | 134 |
| GO:00516561 | Colorectum | SER | establishment of organelle localization | 100/2897 | 390/18723 | 1.11e-07 | 6.79e-06 | 100 |
| GO:00300481 | Colorectum | SER | actin filament-based movement | 38/2897 | 127/18723 | 2.80e-05 | 7.56e-04 | 38 |
| GO:00995151 | Colorectum | SER | actin filament-based transport | 11/2897 | 21/18723 | 9.28e-05 | 1.98e-03 | 11 |
| GO:00300501 | Colorectum | SER | vesicle transport along actin filament | 10/2897 | 19/18723 | 1.86e-04 | 3.43e-03 | 10 |
| GO:00516501 | Colorectum | SER | establishment of vesicle localization | 42/2897 | 161/18723 | 3.38e-04 | 5.35e-03 | 42 |
| GO:00516481 | Colorectum | SER | vesicle localization | 43/2897 | 177/18723 | 1.41e-03 | 1.53e-02 | 43 |
| GO:00307051 | Colorectum | SER | cytoskeleton-dependent intracellular transport | 44/2897 | 195/18723 | 5.53e-03 | 4.09e-02 | 44 |
| GO:00070152 | Colorectum | MSS | actin filament organization | 146/3467 | 442/18723 | 1.16e-13 | 2.67e-11 | 146 |
| GO:00516562 | Colorectum | MSS | establishment of organelle localization | 115/3467 | 390/18723 | 7.30e-08 | 3.67e-06 | 115 |
| GO:00300482 | Colorectum | MSS | actin filament-based movement | 44/3467 | 127/18723 | 1.11e-05 | 2.64e-04 | 44 |
| GO:00516502 | Colorectum | MSS | establishment of vesicle localization | 51/3467 | 161/18723 | 3.92e-05 | 7.45e-04 | 51 |
| Page: 1 2 3 |
| Pathway ID | Tissue | Disease Stage | Description | Gene Ratio | Bg Ratio | pvalue | p.adjust | qvalue | Count |
| Page: 1 |
Top |
Cell-cell communication analysis |
| Identification of potential cell-cell interactions between two cell types and their ligand-receptor pairs for different disease states |
| Ligand | Receptor | LRpair | Pathway | Tissue | Disease Stage |
| Page: 1 |
Top |
Single-cell gene regulatory network inference analysis |
| Find out the significant the regulons (TFs) and the target genes of each regulon across cell types for different disease states |
| TF | Cell Type | Tissue | Disease Stage | Target Gene | RSS | Regulon Activity |
| ∗The dot plots of a searched regulon are shown for all cell subpopulations in each disease state of each tissue based on the regulon specific score inferred using pySCENIC and by calculating the average expression. |
| Page: 1 |
Top |
Somatic mutation of malignant transformation related genes |
| Annotation of somatic variants for genes involved in malignant transformation |
| Hugo Symbol | Variant Class | Variant Classification | dbSNP RS | HGVSc | HGVSp | HGVSp Short | SWISSPROT | BIOTYPE | SIFT | PolyPhen | Tumor Sample Barcode | Tissue | Histology | Sex | Age | Stage | Therapy Types | Drugs | Outcome |
| MYO7B | SNV | Missense_Mutation | rs371739405 | c.2725N>A | p.Val909Ile | p.V909I | Q6PIF6 | protein_coding | tolerated(0.74) | benign(0) | TCGA-A2-A0T0-01 | Breast | breast invasive carcinoma | Female | <65 | I/II | Chemotherapy | taxotere | SD |
| MYO7B | SNV | Missense_Mutation | novel | c.3913N>G | p.Leu1305Val | p.L1305V | Q6PIF6 | protein_coding | deleterious(0) | probably_damaging(0.931) | TCGA-A7-A6VY-01 | Breast | breast invasive carcinoma | Female | <65 | I/II | Chemotherapy | cyclophosphamide | CR |
| MYO7B | SNV | Missense_Mutation | c.4493N>T | p.Gly1498Val | p.G1498V | Q6PIF6 | protein_coding | deleterious(0) | probably_damaging(0.985) | TCGA-A8-A075-01 | Breast | breast invasive carcinoma | Female | <65 | I/II | Chemotherapy | epirubicin | CR | |
| MYO7B | SNV | Missense_Mutation | novel | c.4180N>C | p.Glu1394Gln | p.E1394Q | Q6PIF6 | protein_coding | deleterious(0.05) | benign(0.011) | TCGA-AC-A5XS-01 | Breast | breast invasive carcinoma | Female | >=65 | I/II | Hormone Therapy | femara | SD |
| MYO7B | SNV | Missense_Mutation | c.1667N>T | p.Gly556Val | p.G556V | Q6PIF6 | protein_coding | deleterious(0) | probably_damaging(0.999) | TCGA-AR-A1AO-01 | Breast | breast invasive carcinoma | Female | <65 | I/II | Chemotherapy | doxorubicin | SD | |
| MYO7B | SNV | Missense_Mutation | rs576789048 | c.38N>G | p.Glu13Gly | p.E13G | Q6PIF6 | protein_coding | deleterious(0.01) | benign(0.05) | TCGA-AR-A1AP-01 | Breast | breast invasive carcinoma | Female | >=65 | I/II | Hormone Therapy | anastrozole | SD |
| MYO7B | SNV | Missense_Mutation | rs576789048 | c.38N>G | p.Glu13Gly | p.E13G | Q6PIF6 | protein_coding | deleterious(0.01) | benign(0.05) | TCGA-BH-A0HO-01 | Breast | breast invasive carcinoma | Female | <65 | I/II | Chemotherapy | cyclophosphamide | SD |
| MYO7B | SNV | Missense_Mutation | rs576789048 | c.38N>G | p.Glu13Gly | p.E13G | Q6PIF6 | protein_coding | deleterious(0.01) | benign(0.05) | TCGA-BH-A0HU-01 | Breast | breast invasive carcinoma | Female | <65 | I/II | Chemotherapy | docetaxel | SD |
| MYO7B | SNV | Missense_Mutation | c.1791N>C | p.Leu597Phe | p.L597F | Q6PIF6 | protein_coding | tolerated(0.57) | possibly_damaging(0.588) | TCGA-D8-A147-01 | Breast | breast invasive carcinoma | Female | <65 | I/II | Chemotherapy | doxorubicine | SD | |
| MYO7B | SNV | Missense_Mutation | c.4426N>A | p.Glu1476Lys | p.E1476K | Q6PIF6 | protein_coding | tolerated(0.07) | benign(0.169) | TCGA-D8-A1J8-01 | Breast | breast invasive carcinoma | Female | >=65 | I/II | Hormone Therapy | nolvadex | SD |
| Page: 1 2 3 4 5 6 7 8 9 10 11 12 13 14 15 16 17 18 19 20 21 22 23 24 |
Top |
Related drugs of malignant transformation related genes |
| Identification of chemicals and drugs interact with genes involved in malignant transfromation |
| (DGIdb 4.0) |
| Entrez ID | Symbol | Category | Interaction Types | Drug Claim Name | Drug Name | PMIDs |
| Page: 1 |

Copyright 2023-Present -The University of Texas Health Science Center at Houston |