| Tissue | Expression Dynamics | Abbreviation |
| Colorectum (GSE201348) |  | FAP: Familial adenomatous polyposis |
| CRC: Colorectal cancer |
| Colorectum (HTA11) |  | AD: Adenomas |
| SER: Sessile serrated lesions |
| MSI-H: Microsatellite-high colorectal cancer |
| MSS: Microsatellite stable colorectal cancer |
| Endometrium |  | AEH: Atypical endometrial hyperplasia |
| EEC: Endometrioid Cancer |
| Esophagus | 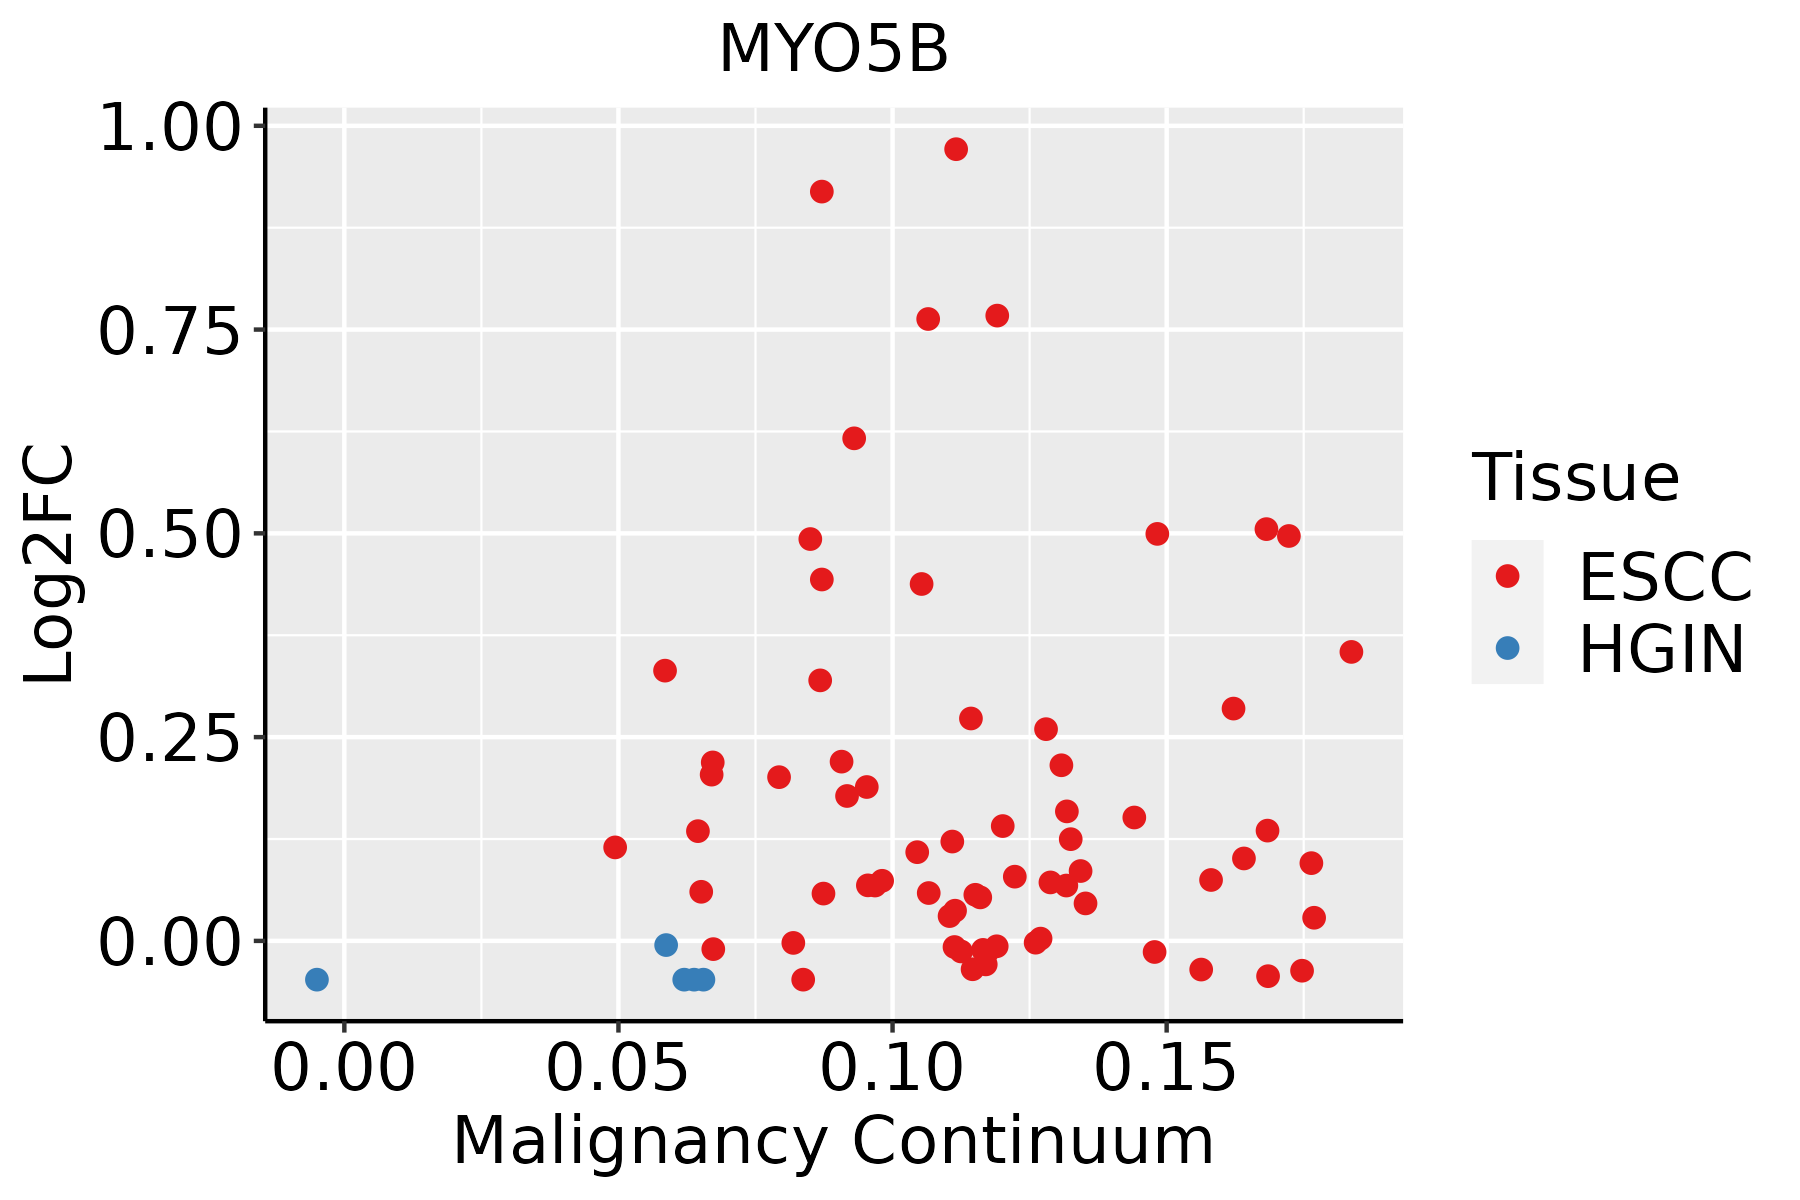 | ESCC: Esophageal squamous cell carcinoma |
| HGIN: High-grade intraepithelial neoplasias |
| LGIN: Low-grade intraepithelial neoplasias |
| GC |  | CAG: Chronic atrophic gastritis |
| CAG with IM: Chronic atrophic gastritis with intestinal metaplasia |
| CSG: Chronic superficial gastritis |
| GC: Gastric cancer |
| SIM: Severe intestinal metaplasia |
| WIM: Wild intestinal metaplasia |
| Liver |  | HCC: Hepatocellular carcinoma |
| NAFLD: Non-alcoholic fatty liver disease |
| Lung | 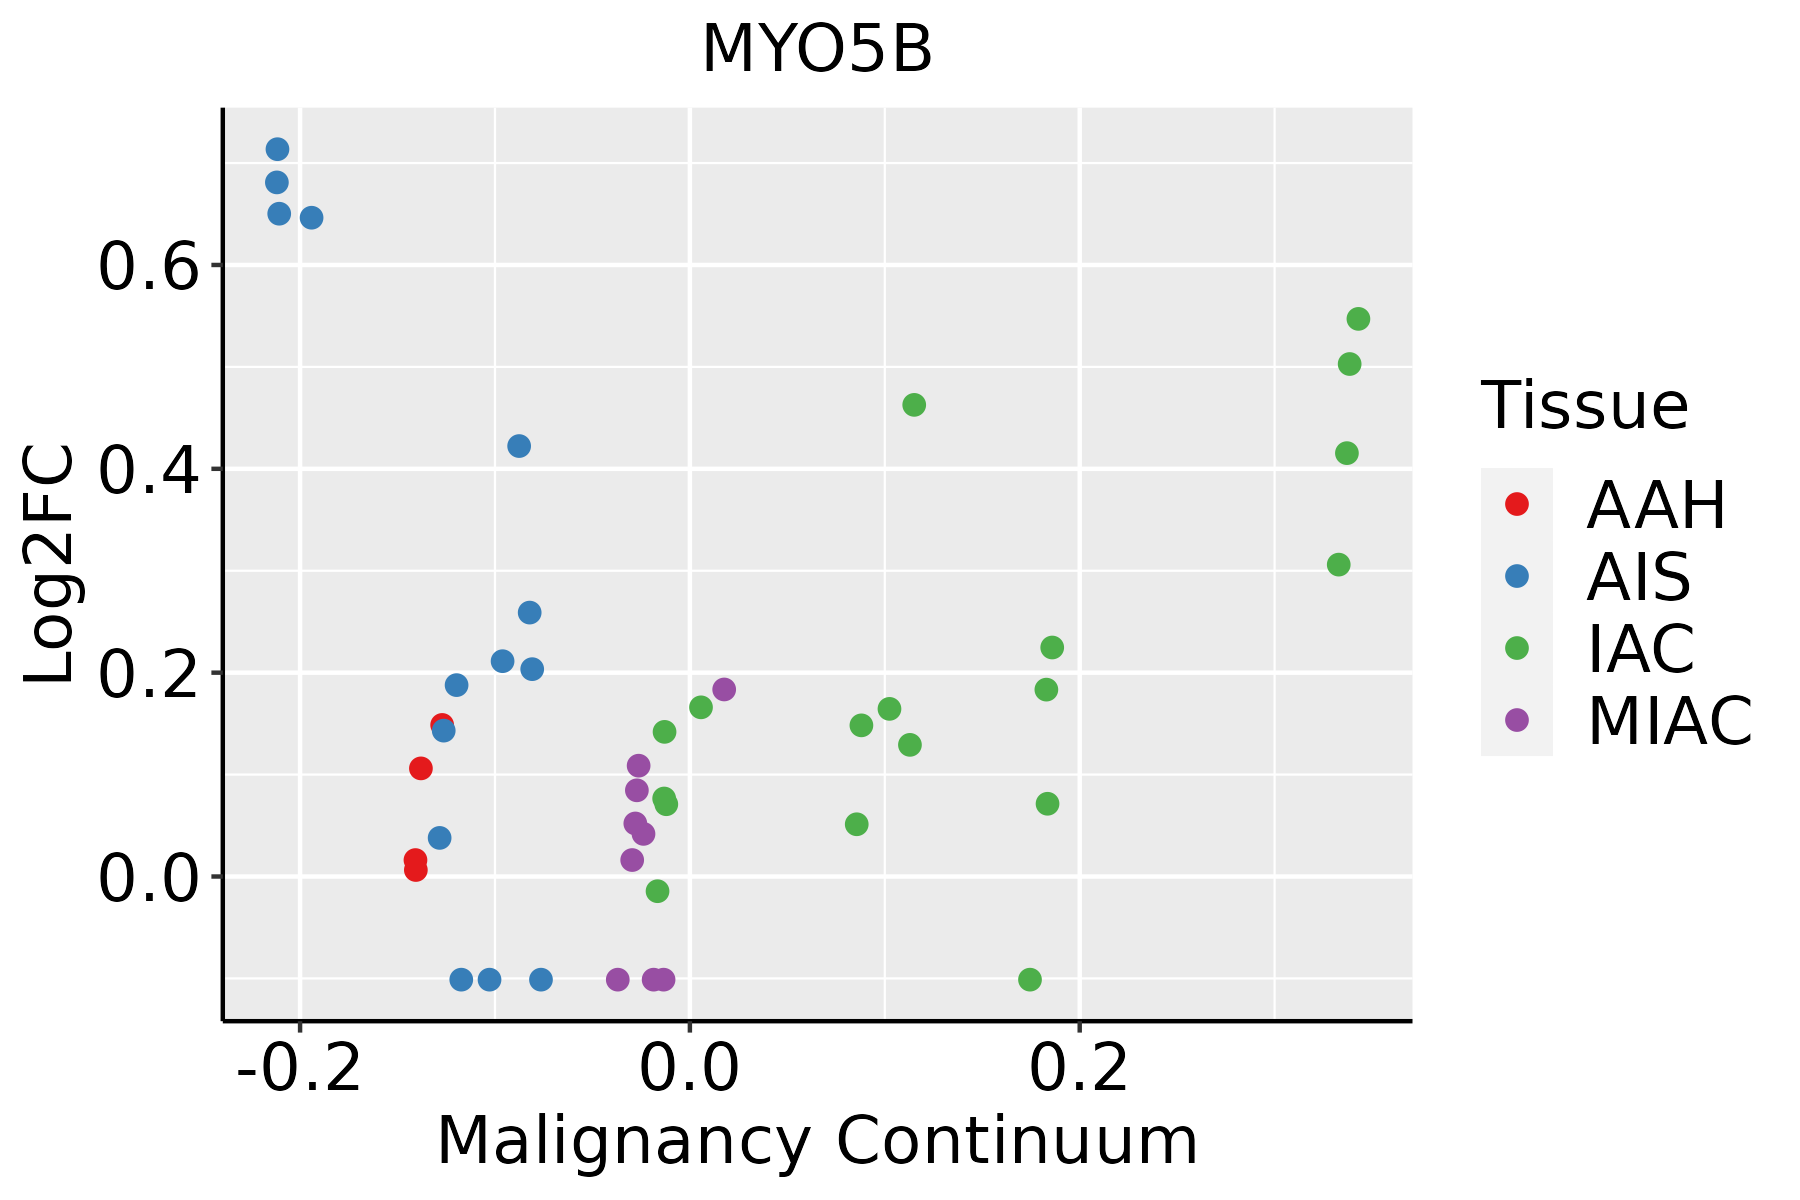 | AAH: Atypical adenomatous hyperplasia |
| AIS: Adenocarcinoma in situ |
| IAC: Invasive lung adenocarcinoma |
| MIA: Minimally invasive adenocarcinoma |
| Oral Cavity |  | EOLP: Erosive Oral lichen planus |
| LP: leukoplakia |
| NEOLP: Non-erosive oral lichen planus |
| OSCC: Oral squamous cell carcinoma |
| Prostate |  | BPH: Benign Prostatic Hyperplasia |
| Thyroid |  | ATC: Anaplastic thyroid cancer |
| HT: Hashimoto's thyroiditis |
| PTC: Papillary thyroid cancer |
| GO ID | Tissue | Disease Stage | Description | Gene Ratio | Bg Ratio | pvalue | p.adjust | Count |
| GO:0007015 | Colorectum | AD | actin filament organization | 167/3918 | 442/18723 | 1.65e-16 | 7.94e-14 | 167 |
| GO:0016197 | Colorectum | AD | endosomal transport | 90/3918 | 230/18723 | 1.88e-10 | 1.73e-08 | 90 |
| GO:0051656 | Colorectum | AD | establishment of organelle localization | 131/3918 | 390/18723 | 3.00e-09 | 2.06e-07 | 131 |
| GO:0051650 | Colorectum | AD | establishment of vesicle localization | 57/3918 | 161/18723 | 1.47e-05 | 3.15e-04 | 57 |
| GO:0051648 | Colorectum | AD | vesicle localization | 59/3918 | 177/18723 | 7.83e-05 | 1.25e-03 | 59 |
| GO:0030048 | Colorectum | AD | actin filament-based movement | 44/3918 | 127/18723 | 2.31e-04 | 2.99e-03 | 44 |
| GO:0050878 | Colorectum | AD | regulation of body fluid levels | 108/3918 | 379/18723 | 2.54e-04 | 3.20e-03 | 108 |
| GO:0099515 | Colorectum | AD | actin filament-based transport | 12/3918 | 21/18723 | 3.02e-04 | 3.62e-03 | 12 |
| GO:0030050 | Colorectum | AD | vesicle transport along actin filament | 11/3918 | 19/18723 | 4.66e-04 | 5.15e-03 | 11 |
| GO:0030705 | Colorectum | AD | cytoskeleton-dependent intracellular transport | 60/3918 | 195/18723 | 7.56e-04 | 7.59e-03 | 60 |
| GO:0003014 | Colorectum | AD | renal system process | 35/3918 | 110/18723 | 4.85e-03 | 3.27e-02 | 35 |
| GO:00070151 | Colorectum | SER | actin filament organization | 134/2897 | 442/18723 | 1.39e-15 | 5.70e-13 | 134 |
| GO:00516561 | Colorectum | SER | establishment of organelle localization | 100/2897 | 390/18723 | 1.11e-07 | 6.79e-06 | 100 |
| GO:00161971 | Colorectum | SER | endosomal transport | 61/2897 | 230/18723 | 1.03e-05 | 3.35e-04 | 61 |
| GO:00300481 | Colorectum | SER | actin filament-based movement | 38/2897 | 127/18723 | 2.80e-05 | 7.56e-04 | 38 |
| GO:00995151 | Colorectum | SER | actin filament-based transport | 11/2897 | 21/18723 | 9.28e-05 | 1.98e-03 | 11 |
| GO:00300501 | Colorectum | SER | vesicle transport along actin filament | 10/2897 | 19/18723 | 1.86e-04 | 3.43e-03 | 10 |
| GO:00516501 | Colorectum | SER | establishment of vesicle localization | 42/2897 | 161/18723 | 3.38e-04 | 5.35e-03 | 42 |
| GO:00030141 | Colorectum | SER | renal system process | 30/2897 | 110/18723 | 1.05e-03 | 1.22e-02 | 30 |
| GO:00508781 | Colorectum | SER | regulation of body fluid levels | 81/2897 | 379/18723 | 1.28e-03 | 1.43e-02 | 81 |
| Pathway ID | Tissue | Disease Stage | Description | Gene Ratio | Bg Ratio | pvalue | p.adjust | qvalue | Count |
| hsa05130 | Colorectum | AD | Pathogenic Escherichia coli infection | 79/2092 | 197/8465 | 1.05e-06 | 1.36e-05 | 8.65e-06 | 79 |
| hsa051301 | Colorectum | AD | Pathogenic Escherichia coli infection | 79/2092 | 197/8465 | 1.05e-06 | 1.36e-05 | 8.65e-06 | 79 |
| hsa051302 | Colorectum | SER | Pathogenic Escherichia coli infection | 60/1580 | 197/8465 | 3.63e-05 | 4.31e-04 | 3.13e-04 | 60 |
| hsa051303 | Colorectum | SER | Pathogenic Escherichia coli infection | 60/1580 | 197/8465 | 3.63e-05 | 4.31e-04 | 3.13e-04 | 60 |
| hsa051304 | Colorectum | MSS | Pathogenic Escherichia coli infection | 73/1875 | 197/8465 | 1.10e-06 | 1.48e-05 | 9.06e-06 | 73 |
| hsa051305 | Colorectum | MSS | Pathogenic Escherichia coli infection | 73/1875 | 197/8465 | 1.10e-06 | 1.48e-05 | 9.06e-06 | 73 |
| hsa051308 | Colorectum | FAP | Pathogenic Escherichia coli infection | 62/1404 | 197/8465 | 1.37e-07 | 3.08e-06 | 1.87e-06 | 62 |
| hsa051309 | Colorectum | FAP | Pathogenic Escherichia coli infection | 62/1404 | 197/8465 | 1.37e-07 | 3.08e-06 | 1.87e-06 | 62 |
| hsa0513010 | Colorectum | CRC | Pathogenic Escherichia coli infection | 47/1091 | 197/8465 | 1.49e-05 | 3.84e-04 | 2.60e-04 | 47 |
| hsa0513011 | Colorectum | CRC | Pathogenic Escherichia coli infection | 47/1091 | 197/8465 | 1.49e-05 | 3.84e-04 | 2.60e-04 | 47 |
| hsa0513026 | Endometrium | AEH | Pathogenic Escherichia coli infection | 50/1197 | 197/8465 | 1.72e-05 | 1.86e-04 | 1.36e-04 | 50 |
| hsa048144 | Endometrium | AEH | Motor proteins | 42/1197 | 193/8465 | 2.41e-03 | 1.42e-02 | 1.04e-02 | 42 |
| hsa05130112 | Endometrium | AEH | Pathogenic Escherichia coli infection | 50/1197 | 197/8465 | 1.72e-05 | 1.86e-04 | 1.36e-04 | 50 |
| hsa0481411 | Endometrium | AEH | Motor proteins | 42/1197 | 193/8465 | 2.41e-03 | 1.42e-02 | 1.04e-02 | 42 |
| hsa0513027 | Endometrium | EEC | Pathogenic Escherichia coli infection | 51/1237 | 197/8465 | 1.98e-05 | 2.28e-04 | 1.70e-04 | 51 |
| hsa048142 | Endometrium | EEC | Motor proteins | 42/1237 | 193/8465 | 4.43e-03 | 2.39e-02 | 1.78e-02 | 42 |
| hsa0513036 | Endometrium | EEC | Pathogenic Escherichia coli infection | 51/1237 | 197/8465 | 1.98e-05 | 2.28e-04 | 1.70e-04 | 51 |
| hsa048143 | Endometrium | EEC | Motor proteins | 42/1237 | 193/8465 | 4.43e-03 | 2.39e-02 | 1.78e-02 | 42 |
| hsa05130211 | Esophagus | ESCC | Pathogenic Escherichia coli infection | 142/4205 | 197/8465 | 8.21e-11 | 1.06e-09 | 5.42e-10 | 142 |
| hsa05130310 | Esophagus | ESCC | Pathogenic Escherichia coli infection | 142/4205 | 197/8465 | 8.21e-11 | 1.06e-09 | 5.42e-10 | 142 |
| Hugo Symbol | Variant Class | Variant Classification | dbSNP RS | HGVSc | HGVSp | HGVSp Short | SWISSPROT | BIOTYPE | SIFT | PolyPhen | Tumor Sample Barcode | Tissue | Histology | Sex | Age | Stage | Therapy Types | Drugs | Outcome |
| MYO5B | SNV | Missense_Mutation | | c.3526N>C | p.Lys1176Gln | p.K1176Q | Q9ULV0 | protein_coding | tolerated(0.16) | benign(0.003) | TCGA-A2-A04N-01 | Breast | breast invasive carcinoma | Female | >=65 | I/II | Chemotherapy | cytoxan | SD |
| MYO5B | SNV | Missense_Mutation | novel | c.2095G>C | p.Ala699Pro | p.A699P | Q9ULV0 | protein_coding | deleterious(0) | benign(0.001) | TCGA-A2-A04P-01 | Breast | breast invasive carcinoma | Female | <65 | III/IV | Chemotherapy | taxol | PD |
| MYO5B | SNV | Missense_Mutation | | c.1436N>C | p.Met479Thr | p.M479T | Q9ULV0 | protein_coding | deleterious(0.03) | benign(0.015) | TCGA-A2-A0YJ-01 | Breast | breast invasive carcinoma | Female | <65 | III/IV | Chemotherapy | cytoxan | PD |
| MYO5B | SNV | Missense_Mutation | | c.2566N>T | p.Arg856Cys | p.R856C | Q9ULV0 | protein_coding | deleterious(0.04) | benign(0.026) | TCGA-A7-A0CG-01 | Breast | breast invasive carcinoma | Female | >=65 | I/II | Unknown | Unknown | SD |
| MYO5B | SNV | Missense_Mutation | rs745968678 | c.1214N>T | p.Ala405Val | p.A405V | Q9ULV0 | protein_coding | deleterious(0) | possibly_damaging(0.707) | TCGA-A8-A07W-01 | Breast | breast invasive carcinoma | Female | >=65 | III/IV | Hormone Therapy | exemestane | SD |
| MYO5B | SNV | Missense_Mutation | rs575729461 | c.2395C>T | p.Arg799Trp | p.R799W | Q9ULV0 | protein_coding | deleterious(0) | probably_damaging(0.999) | TCGA-A8-A096-01 | Breast | breast invasive carcinoma | Female | >=65 | I/II | Unknown | Unknown | SD |
| MYO5B | SNV | Missense_Mutation | rs748776509 | c.5146A>G | p.Ile1716Val | p.I1716V | Q9ULV0 | protein_coding | tolerated(0.69) | benign(0.015) | TCGA-A8-A09C-01 | Breast | breast invasive carcinoma | Female | >=65 | I/II | Unknown | Unknown | SD |
| MYO5B | SNV | Missense_Mutation | | c.5332N>T | p.Leu1778Phe | p.L1778F | Q9ULV0 | protein_coding | deleterious(0.01) | probably_damaging(1) | TCGA-A8-A09Z-01 | Breast | breast invasive carcinoma | Female | >=65 | I/II | Unknown | Unknown | SD |
| MYO5B | SNV | Missense_Mutation | novel | c.559G>A | p.Ala187Thr | p.A187T | Q9ULV0 | protein_coding | tolerated(0.08) | benign(0.007) | TCGA-AC-A5EH-01 | Breast | breast invasive carcinoma | Female | >=65 | I/II | Unknown | Unknown | SD |
| MYO5B | SNV | Missense_Mutation | | c.5497N>G | p.Ser1833Ala | p.S1833A | Q9ULV0 | protein_coding | tolerated(0.15) | benign(0.044) | TCGA-B6-A0IE-01 | Breast | breast invasive carcinoma | Female | <65 | III/IV | Unknown | Unknown | PD |


