
|
|||||
|
 | |
| |
| |
| |
| |
| |
|
Gene: MYO3B |
Gene summary for MYO3B |
| Gene information | Species | Human | Gene symbol | MYO3B | Gene ID | 140469 |
| Gene name | myosin IIIB | |
| Gene Alias | MYO3B | |
| Cytomap | 2q31.1 | |
| Gene Type | protein-coding | GO ID | GO:0003008 | UniProtAcc | B7ZM71 |
Top |
Malignant transformation analysis |
| Identification of the aberrant gene expression in precancerous and cancerous lesions by comparing the gene expression of stem-like cells in diseased tissues with normal stem cells |
| Entrez ID | Symbol | Replicates | Species | Organ | Tissue | Adj P-value | Log2FC | Malignancy |
| 140469 | MYO3B | HCC1 | Human | Liver | HCC | 5.93e-05 | 4.79e-01 | 0.5336 |
| 140469 | MYO3B | HCC2 | Human | Liver | HCC | 2.79e-23 | 1.46e+00 | 0.5341 |
| 140469 | MYO3B | HCC5 | Human | Liver | HCC | 3.79e-24 | 1.17e+00 | 0.4932 |
| 140469 | MYO3B | RNA-P17T-P17T-4 | Human | Lung | IAC | 4.28e-05 | 6.88e-01 | 0.343 |
| 140469 | MYO3B | RNA-P3T-P3T-1 | Human | Lung | IAC | 1.02e-16 | 9.33e-01 | 0.1829 |
| 140469 | MYO3B | RNA-P3T-P3T-2 | Human | Lung | IAC | 4.73e-12 | 7.95e-01 | 0.1835 |
| 140469 | MYO3B | RNA-P3T-P3T-4 | Human | Lung | IAC | 7.47e-20 | 9.82e-01 | 0.1859 |
| 140469 | MYO3B | RNA-P6T2-P6T2-1 | Human | Lung | IAC | 4.64e-16 | 5.44e-01 | -0.0166 |
| 140469 | MYO3B | RNA-P6T2-P6T2-2 | Human | Lung | IAC | 5.18e-16 | 4.97e-01 | -0.0132 |
| 140469 | MYO3B | RNA-P6T2-P6T2-3 | Human | Lung | IAC | 8.04e-21 | 5.82e-01 | -0.013 |
| 140469 | MYO3B | RNA-P6T2-P6T2-4 | Human | Lung | IAC | 9.48e-21 | 6.37e-01 | -0.0121 |
| Page: 1 |
| Tissue | Expression Dynamics | Abbreviation |
| Liver |  | HCC: Hepatocellular carcinoma |
| NAFLD: Non-alcoholic fatty liver disease | ||
| Lung | 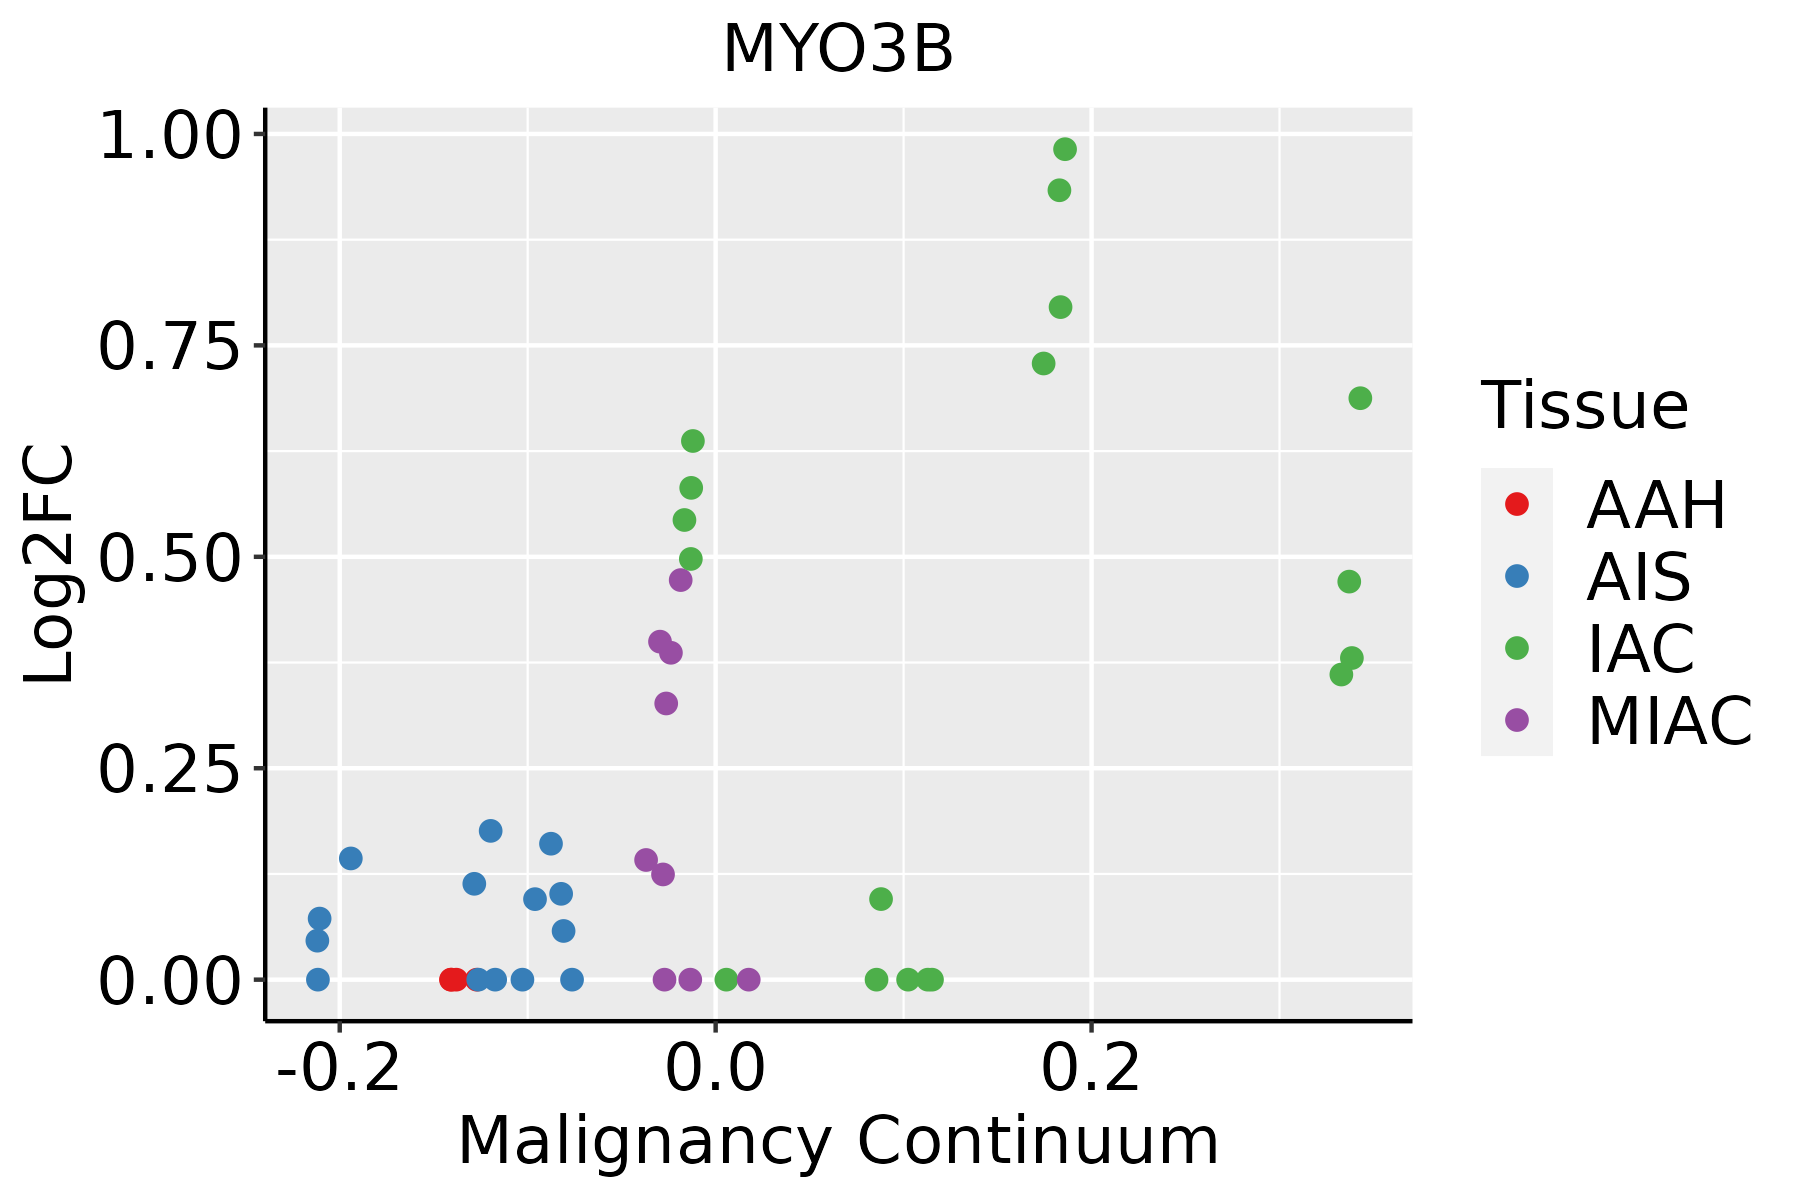 | AAH: Atypical adenomatous hyperplasia |
| AIS: Adenocarcinoma in situ | ||
| IAC: Invasive lung adenocarcinoma | ||
| MIA: Minimally invasive adenocarcinoma |
| ∗log2FC in expression of this searched gene in stem-like cells from each diseased tissue sample relative to stem-like cells in normal samples in each tissue plotted against the malignancy continuum. Samples are colored based on if they are from different disease stage. |
Top |
Malignant transformation related pathway analysis |
| Find out the enriched GO biological processes and KEGG pathways involved in transition from healthy to precancer to cancer |
| Tissue | Disease Stage | Enriched GO biological Processes |
| Colorectum | AD |  |
| Colorectum | SER |  |
| Colorectum | MSS |  |
| Colorectum | MSI-H |  |
| Colorectum | FAP |  |
| ∗Top 15 enriched GO BP terms are showed in the bar plot of each disease state in each tissue. Each row represents a significant GO biological process which is colored according to the -log10(p.adjust). |
| Page: 1 2 3 4 5 6 7 8 9 |
| GO ID | Tissue | Disease Stage | Description | Gene Ratio | Bg Ratio | pvalue | p.adjust | Count |
| GO:00485684 | Lung | IAC | embryonic organ development | 64/2061 | 427/18723 | 6.46e-03 | 4.59e-02 | 64 |
| Page: 1 |
| Pathway ID | Tissue | Disease Stage | Description | Gene Ratio | Bg Ratio | pvalue | p.adjust | qvalue | Count |
| Page: 1 |
Top |
Cell-cell communication analysis |
| Identification of potential cell-cell interactions between two cell types and their ligand-receptor pairs for different disease states |
| Ligand | Receptor | LRpair | Pathway | Tissue | Disease Stage |
| Page: 1 |
Top |
Single-cell gene regulatory network inference analysis |
| Find out the significant the regulons (TFs) and the target genes of each regulon across cell types for different disease states |
| TF | Cell Type | Tissue | Disease Stage | Target Gene | RSS | Regulon Activity |
| ∗The dot plots of a searched regulon are shown for all cell subpopulations in each disease state of each tissue based on the regulon specific score inferred using pySCENIC and by calculating the average expression. |
| Page: 1 |
Top |
Somatic mutation of malignant transformation related genes |
| Annotation of somatic variants for genes involved in malignant transformation |
| Hugo Symbol | Variant Class | Variant Classification | dbSNP RS | HGVSc | HGVSp | HGVSp Short | SWISSPROT | BIOTYPE | SIFT | PolyPhen | Tumor Sample Barcode | Tissue | Histology | Sex | Age | Stage | Therapy Types | Drugs | Outcome |
| MYO3B | SNV | Missense_Mutation | novel | c.1003C>T | p.His335Tyr | p.H335Y | Q8WXR4 | protein_coding | tolerated(1) | benign(0) | TCGA-5L-AAT1-01 | Breast | breast invasive carcinoma | Female | <65 | III/IV | Hormone Therapy | letrozol | SD |
| MYO3B | SNV | Missense_Mutation | c.1247N>T | p.Ala416Val | p.A416V | Q8WXR4 | protein_coding | deleterious(0) | probably_damaging(1) | TCGA-A2-A0SW-01 | Breast | breast invasive carcinoma | Female | >=65 | III/IV | Hormone Therapy | arimidex | PD | |
| MYO3B | SNV | Missense_Mutation | c.2272N>C | p.Glu758Gln | p.E758Q | Q8WXR4 | protein_coding | deleterious(0.01) | possibly_damaging(0.764) | TCGA-AC-A23H-01 | Breast | breast invasive carcinoma | Female | >=65 | I/II | Unknown | Unknown | PD | |
| MYO3B | SNV | Missense_Mutation | c.3055G>C | p.Ala1019Pro | p.A1019P | Q8WXR4 | protein_coding | tolerated(0.43) | benign(0.007) | TCGA-AR-A0TX-01 | Breast | breast invasive carcinoma | Female | <65 | I/II | Unknown | Unknown | SD | |
| MYO3B | SNV | Missense_Mutation | novel | c.3937N>T | p.Pro1313Ser | p.P1313S | Q8WXR4 | protein_coding | tolerated_low_confidence(0.27) | benign(0.058) | TCGA-AR-A2LL-01 | Breast | breast invasive carcinoma | Female | >=65 | I/II | Hormone Therapy | tamoxiphen | SD |
| MYO3B | SNV | Missense_Mutation | rs764664846 | c.3253G>A | p.Glu1085Lys | p.E1085K | Q8WXR4 | protein_coding | tolerated(0.31) | benign(0.003) | TCGA-BH-A18P-01 | Breast | breast invasive carcinoma | Female | <65 | I/II | Unknown | Unknown | PD |
| MYO3B | SNV | Missense_Mutation | c.3254A>T | p.Glu1085Val | p.E1085V | Q8WXR4 | protein_coding | tolerated(0.09) | benign(0.009) | TCGA-BH-A18P-01 | Breast | breast invasive carcinoma | Female | <65 | I/II | Unknown | Unknown | PD | |
| MYO3B | SNV | Missense_Mutation | c.2566C>T | p.Leu856Phe | p.L856F | Q8WXR4 | protein_coding | deleterious(0) | possibly_damaging(0.903) | TCGA-GM-A2D9-01 | Breast | breast invasive carcinoma | Female | >=65 | I/II | Hormone Therapy | arimidex | SD | |
| MYO3B | insertion | Nonsense_Mutation | novel | c.1762_1763insAA | p.Cys588Ter | p.C588* | Q8WXR4 | protein_coding | TCGA-BH-A0B4-01 | Breast | breast invasive carcinoma | Male | >=65 | III/IV | Hormone Therapy | tamoxiphen | SD | ||
| MYO3B | insertion | In_Frame_Ins | novel | c.1763_1764insTTACGGGAT | p.Cys588_Phe589insTyrGlyIle | p.C588_F589insYGI | Q8WXR4 | protein_coding | TCGA-BH-A0B4-01 | Breast | breast invasive carcinoma | Male | >=65 | III/IV | Hormone Therapy | tamoxiphen | SD |
| Page: 1 2 3 4 5 6 7 8 9 10 11 12 13 14 15 16 17 18 |
Top |
Related drugs of malignant transformation related genes |
| Identification of chemicals and drugs interact with genes involved in malignant transfromation |
| (DGIdb 4.0) |
| Entrez ID | Symbol | Category | Interaction Types | Drug Claim Name | Drug Name | PMIDs |
| Page: 1 |

Copyright 2023-Present -The University of Texas Health Science Center at Houston |