| Tissue | Expression Dynamics | Abbreviation |
| Cervix | 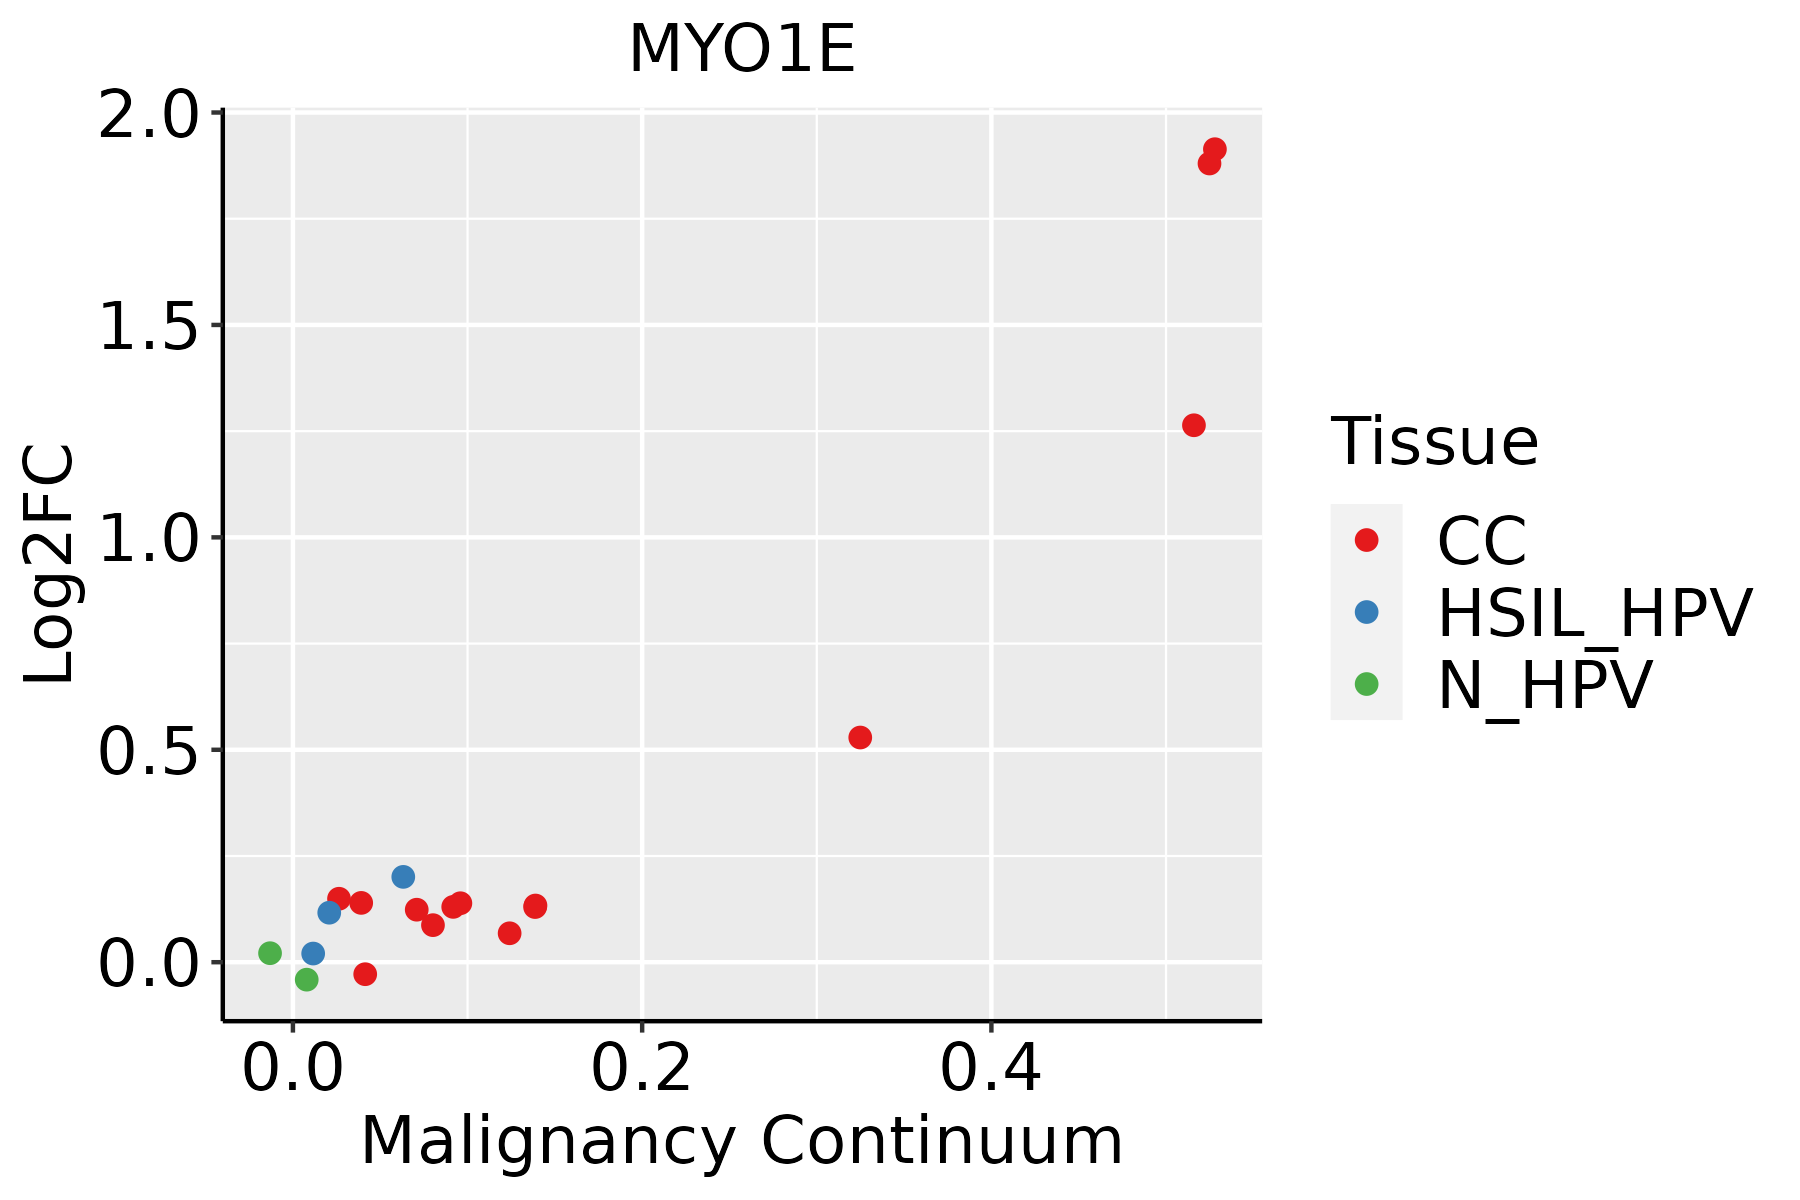 | CC: Cervix cancer |
| HSIL_HPV: HPV-infected high-grade squamous intraepithelial lesions |
| N_HPV: HPV-infected normal cervix |
| Colorectum (GSE201348) |  | FAP: Familial adenomatous polyposis |
| CRC: Colorectal cancer |
| Colorectum (HTA11) |  | AD: Adenomas |
| SER: Sessile serrated lesions |
| MSI-H: Microsatellite-high colorectal cancer |
| MSS: Microsatellite stable colorectal cancer |
| Endometrium |  | AEH: Atypical endometrial hyperplasia |
| EEC: Endometrioid Cancer |
| Esophagus | 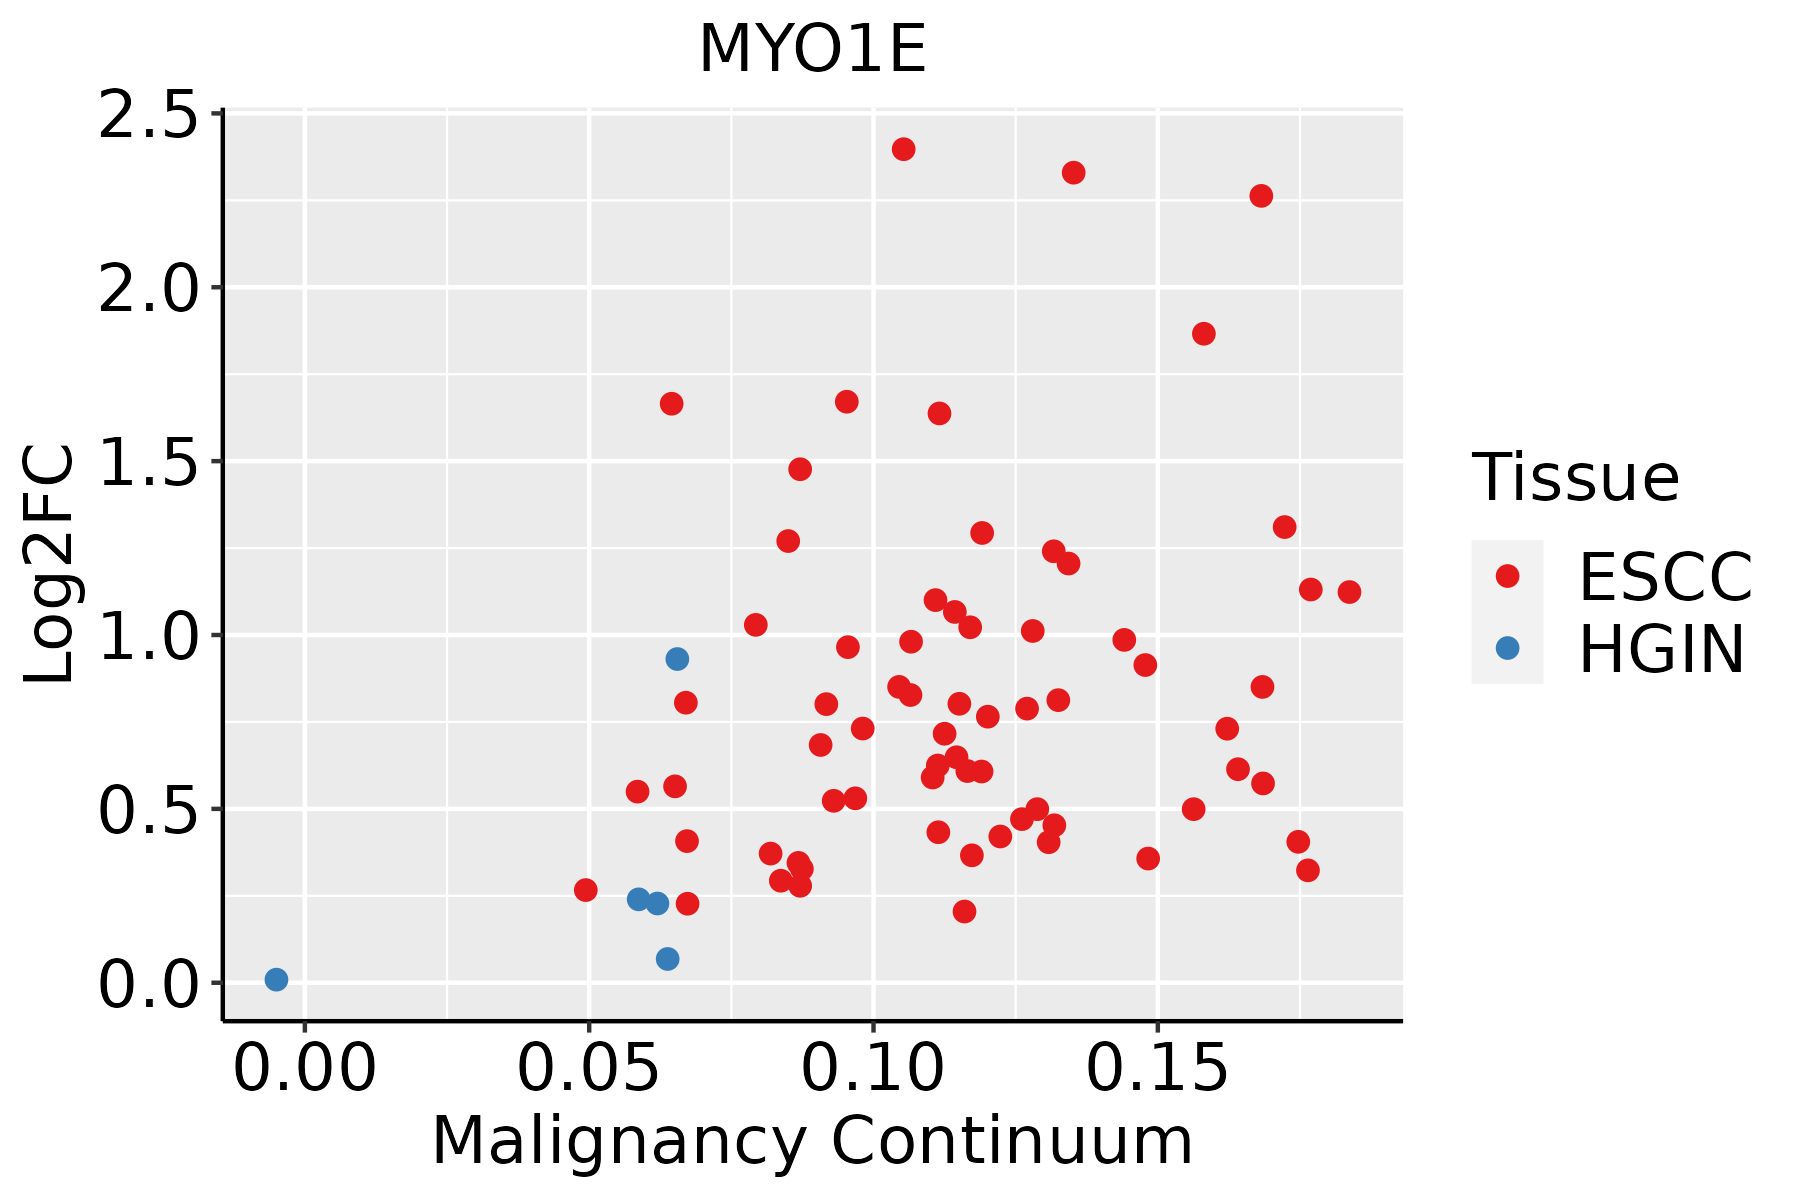 | ESCC: Esophageal squamous cell carcinoma |
| HGIN: High-grade intraepithelial neoplasias |
| LGIN: Low-grade intraepithelial neoplasias |
| GC | 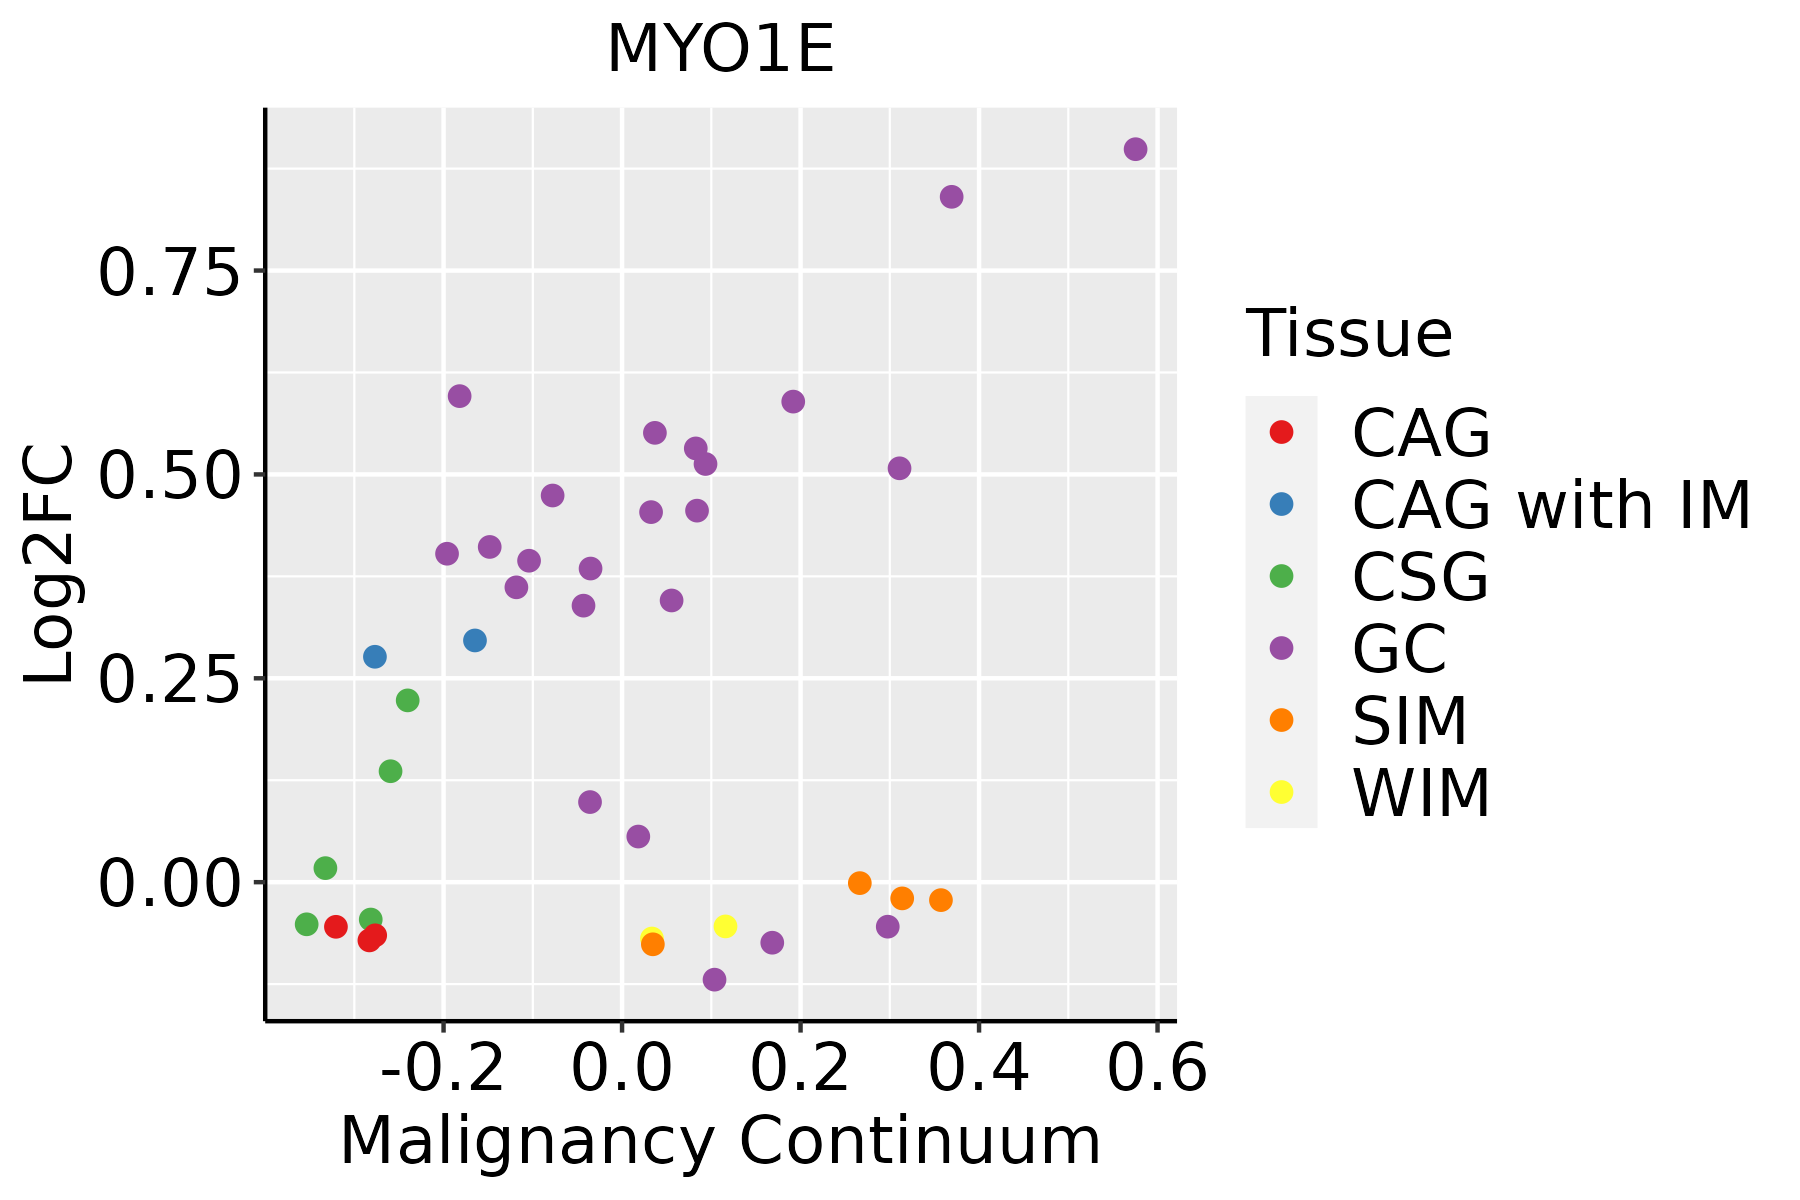 | CAG: Chronic atrophic gastritis |
| CAG with IM: Chronic atrophic gastritis with intestinal metaplasia |
| CSG: Chronic superficial gastritis |
| GC: Gastric cancer |
| SIM: Severe intestinal metaplasia |
| WIM: Wild intestinal metaplasia |
| Liver | 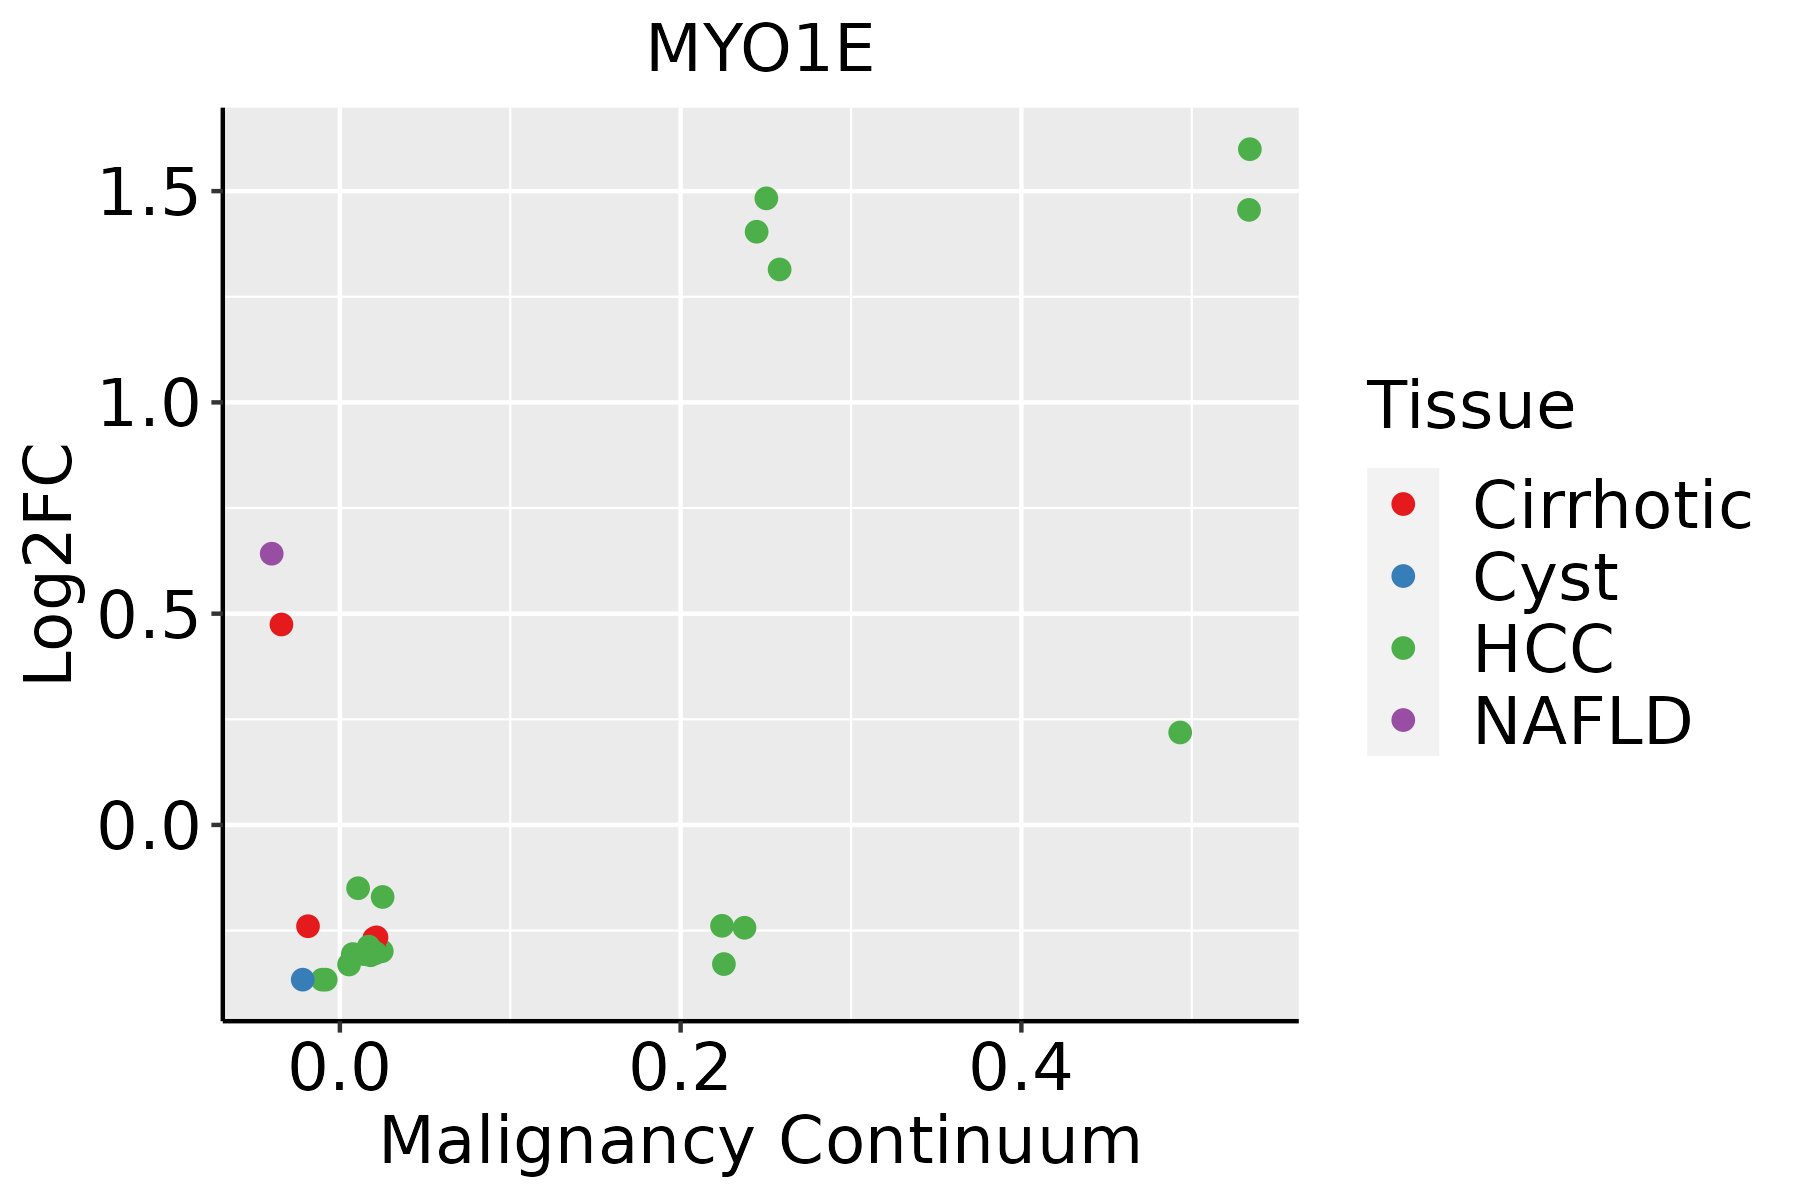 | HCC: Hepatocellular carcinoma |
| NAFLD: Non-alcoholic fatty liver disease |
| Lung | 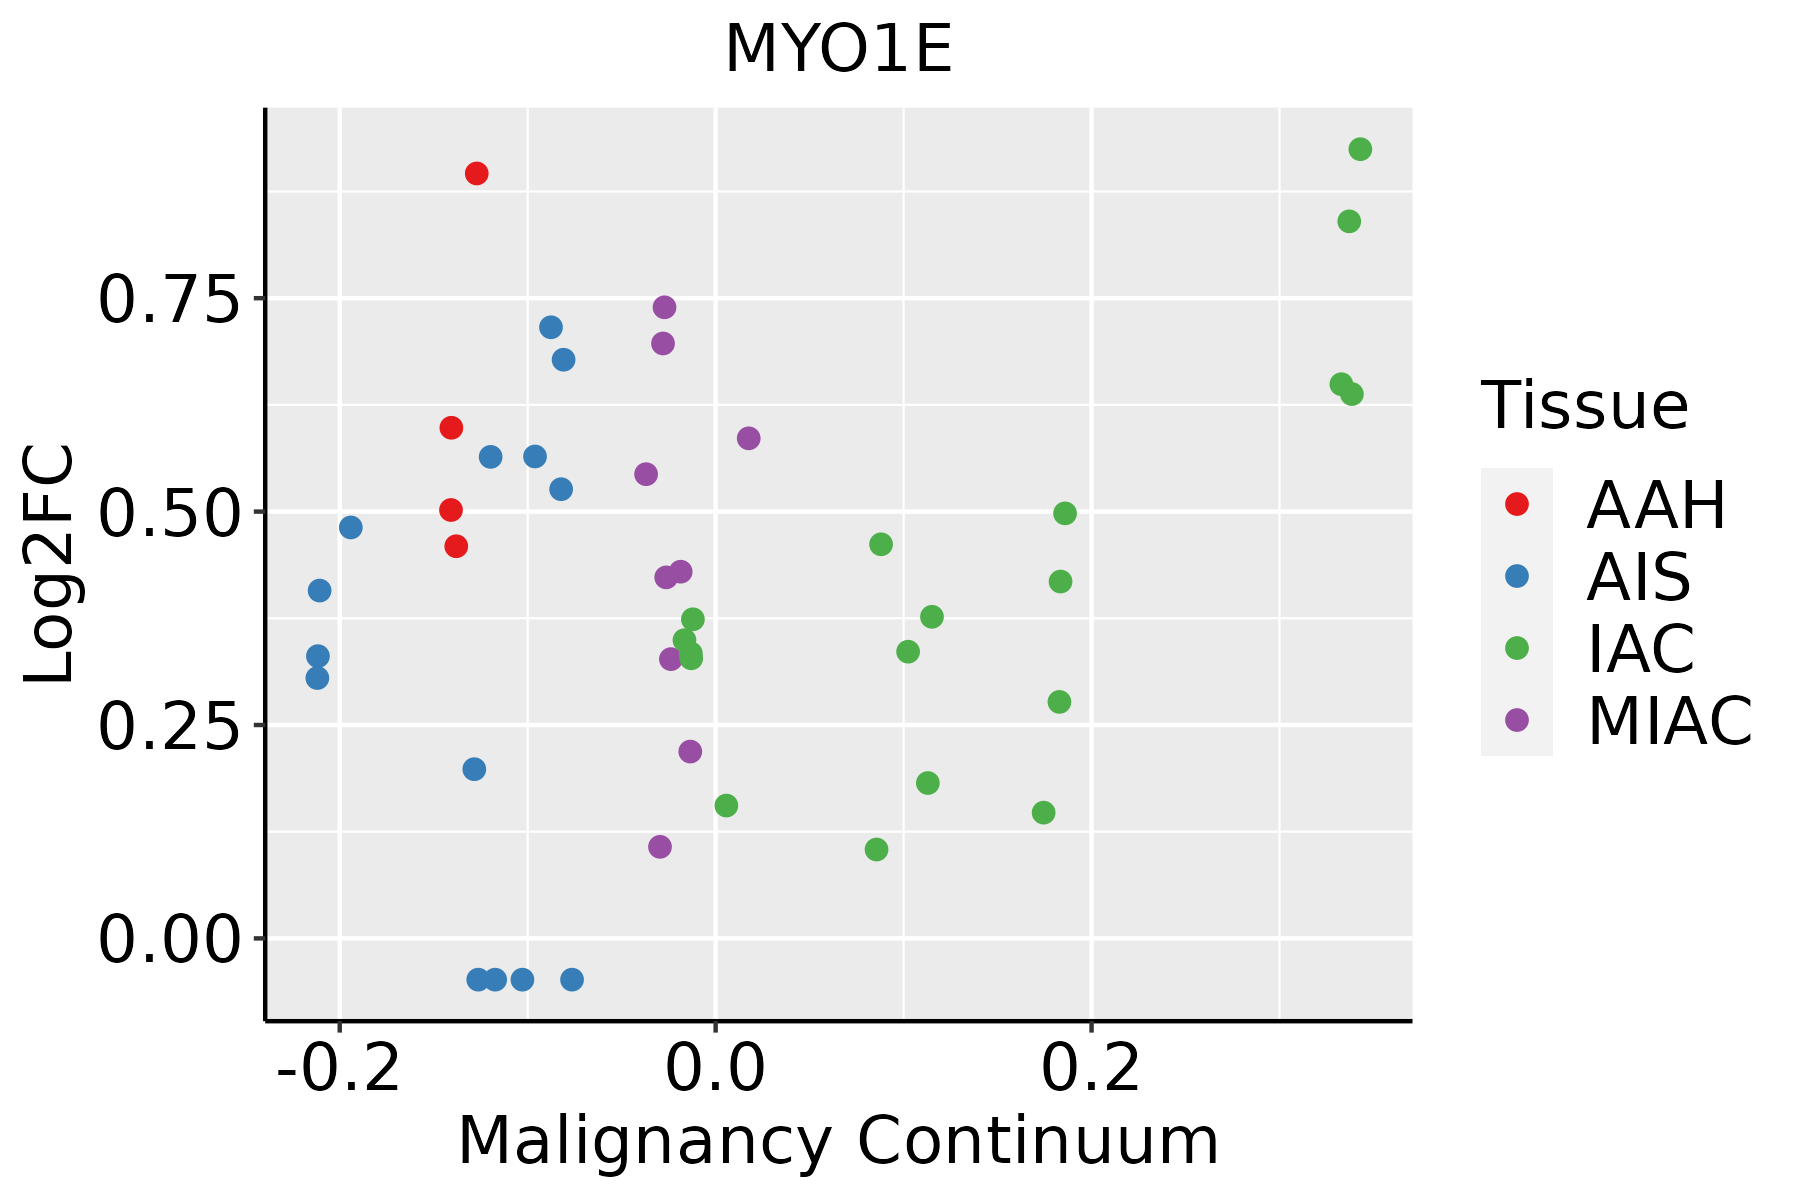 | AAH: Atypical adenomatous hyperplasia |
| AIS: Adenocarcinoma in situ |
| IAC: Invasive lung adenocarcinoma |
| MIA: Minimally invasive adenocarcinoma |
| Oral Cavity | 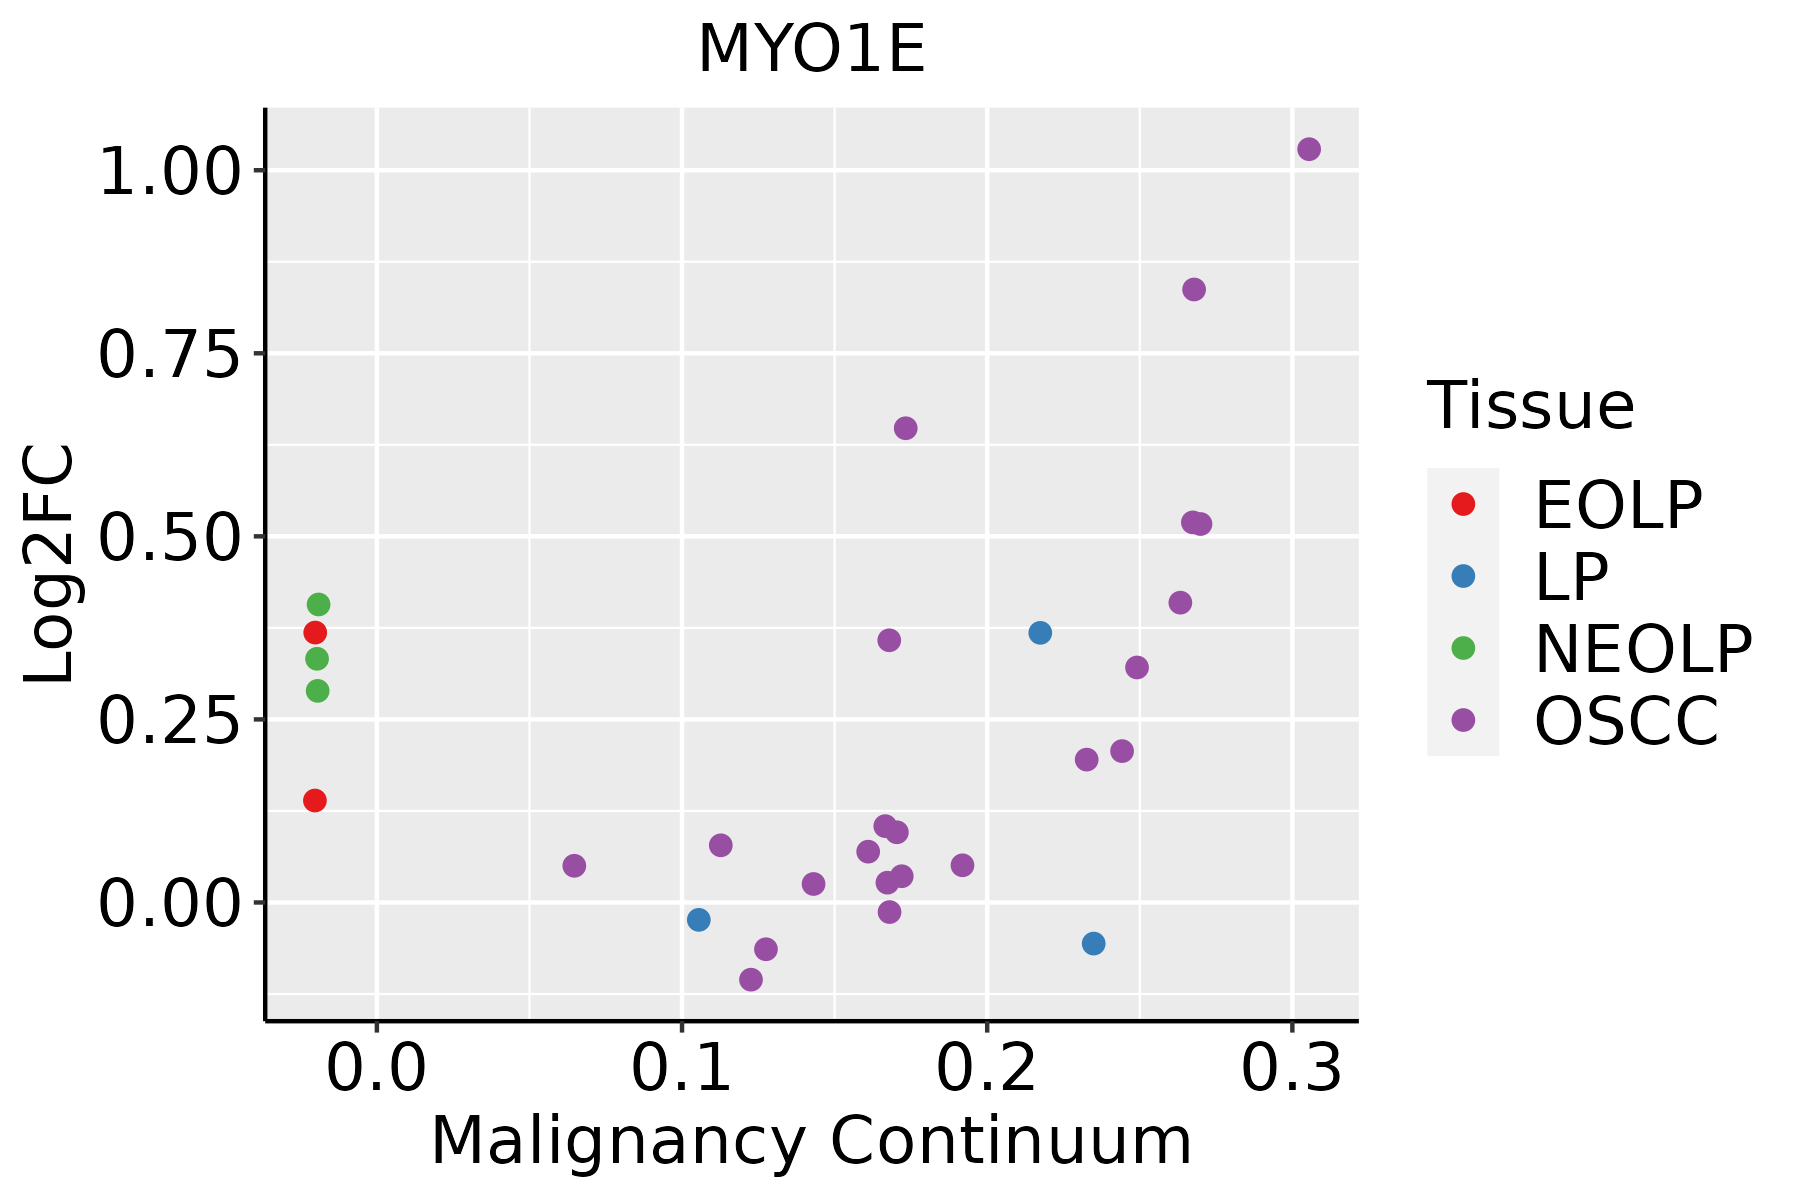 | EOLP: Erosive Oral lichen planus |
| LP: leukoplakia |
| NEOLP: Non-erosive oral lichen planus |
| OSCC: Oral squamous cell carcinoma |
| Prostate | 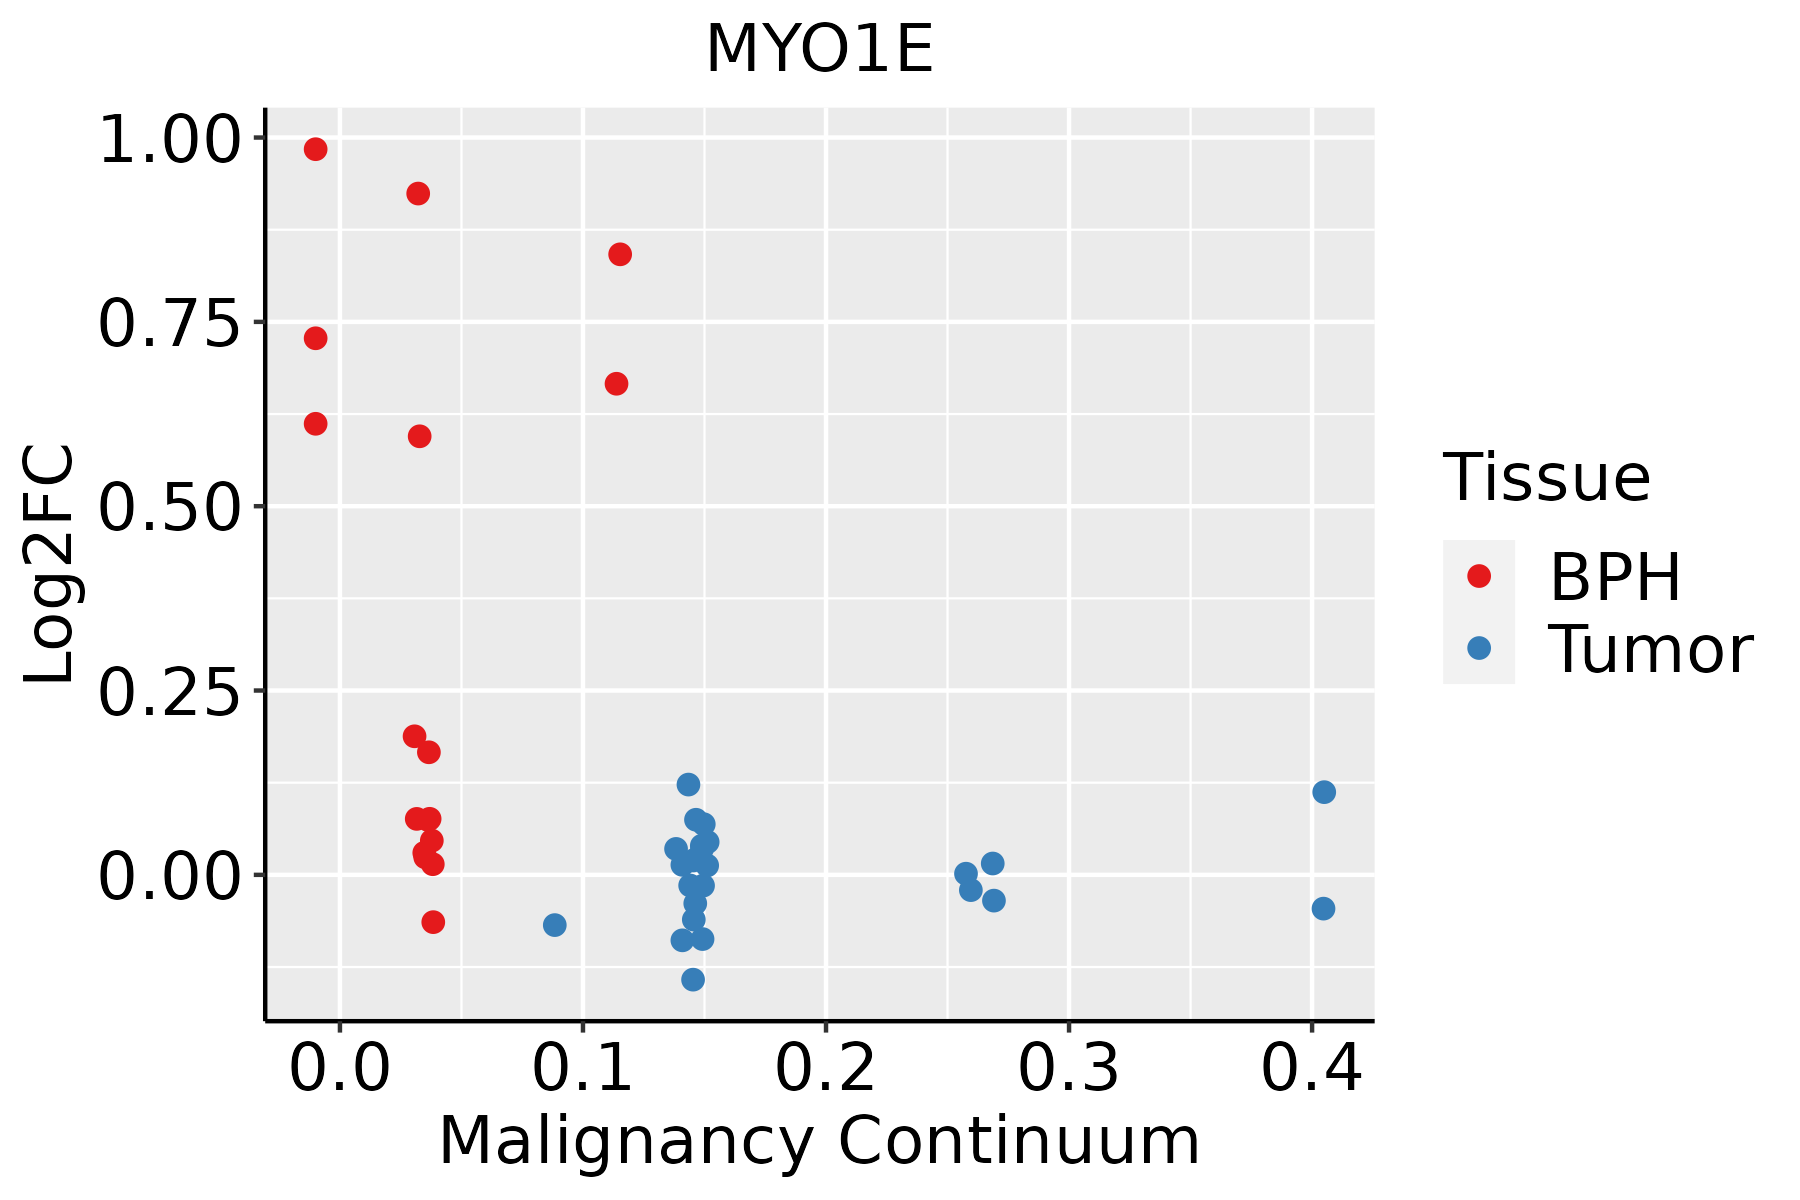 | BPH: Benign Prostatic Hyperplasia |
| Skin | 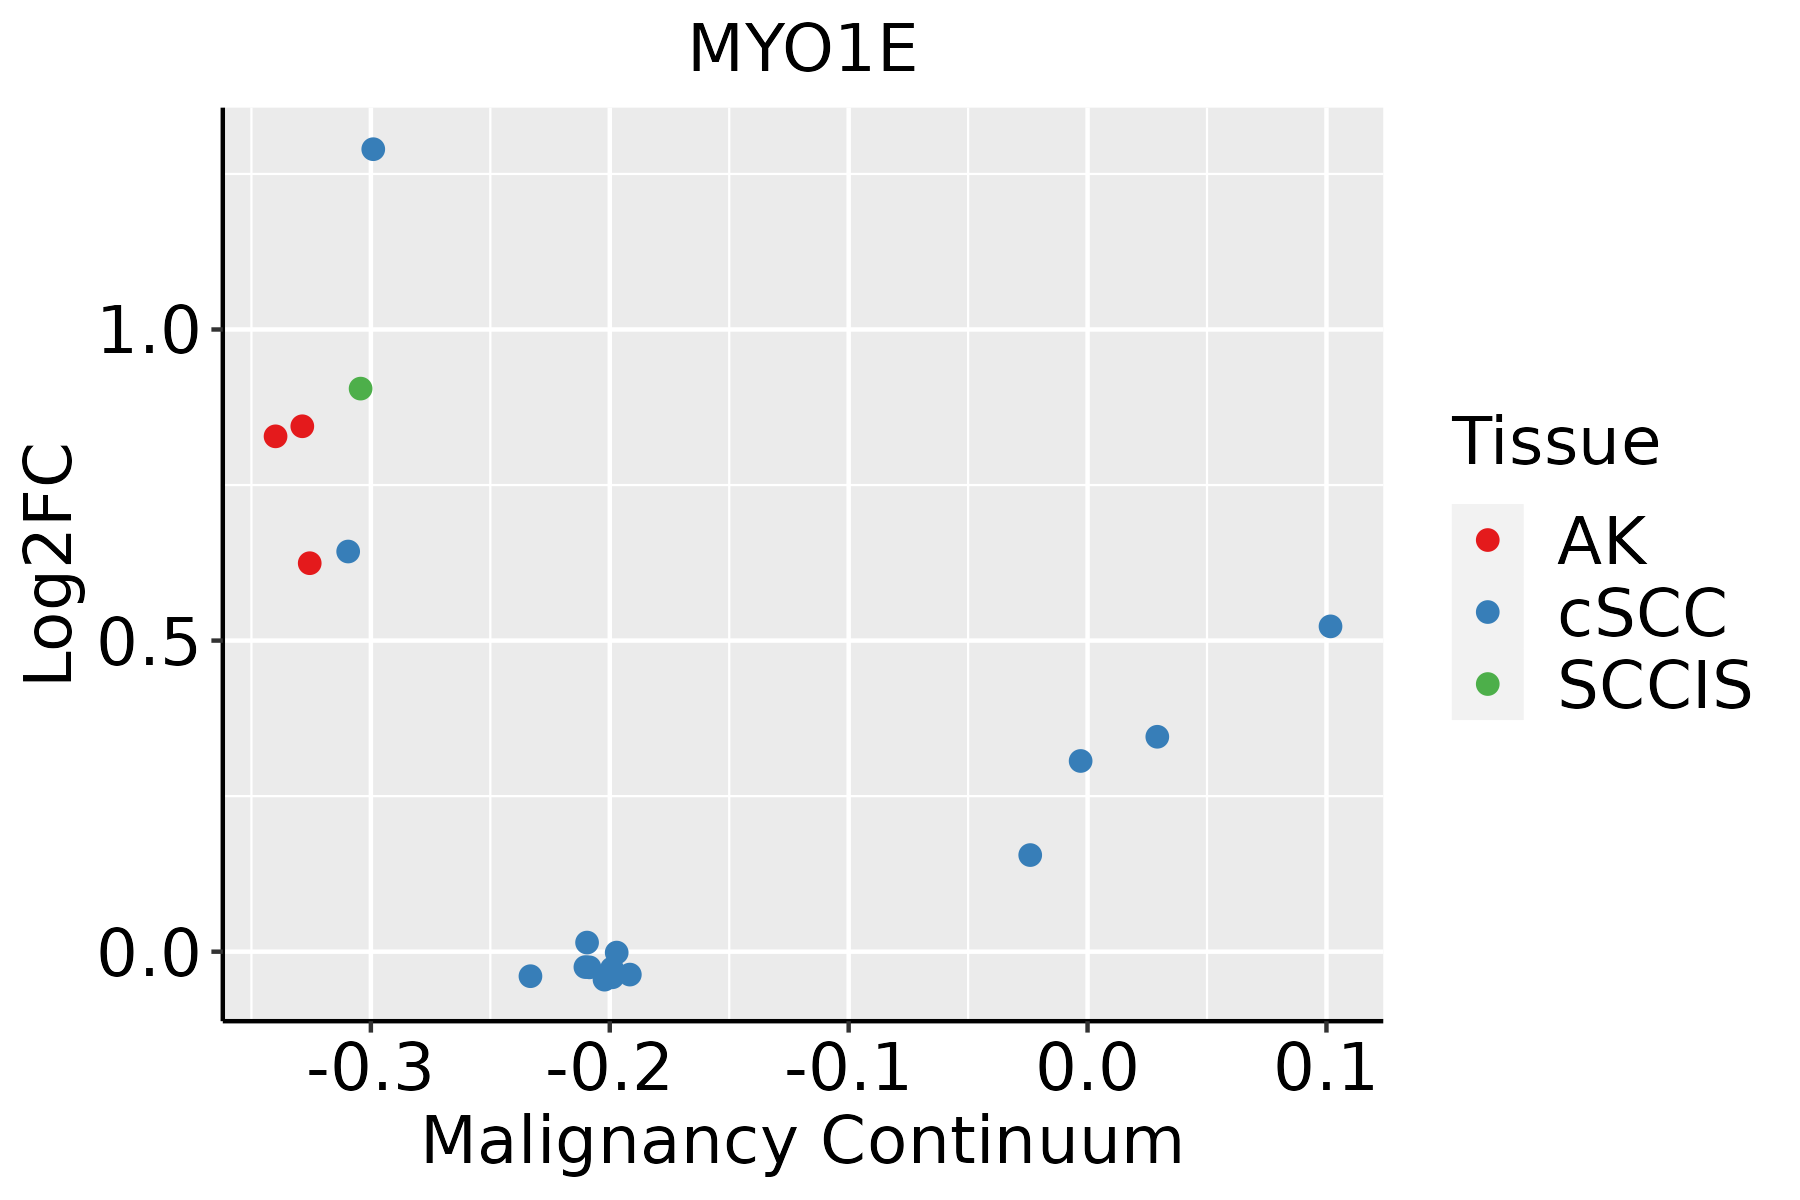 | AK: Actinic keratosis |
| cSCC: Cutaneous squamous cell carcinoma |
| SCCIS:squamous cell carcinoma in situ |
| Thyroid |  | ATC: Anaplastic thyroid cancer |
| HT: Hashimoto's thyroiditis |
| PTC: Papillary thyroid cancer |
| GO ID | Tissue | Disease Stage | Description | Gene Ratio | Bg Ratio | pvalue | p.adjust | Count |
| GO:000701510 | Cervix | CC | actin filament organization | 109/2311 | 442/18723 | 4.92e-13 | 2.45e-10 | 109 |
| GO:00516567 | Cervix | CC | establishment of organelle localization | 76/2311 | 390/18723 | 3.17e-05 | 5.21e-04 | 76 |
| GO:00017018 | Cervix | CC | in utero embryonic development | 71/2311 | 367/18723 | 7.21e-05 | 1.00e-03 | 71 |
| GO:00015704 | Cervix | CC | vasculogenesis | 22/2311 | 80/18723 | 1.97e-04 | 2.26e-03 | 22 |
| GO:000206410 | Cervix | CC | epithelial cell development | 45/2311 | 220/18723 | 4.14e-04 | 4.21e-03 | 45 |
| GO:00300487 | Cervix | CC | actin filament-based movement | 29/2311 | 127/18723 | 6.91e-04 | 6.33e-03 | 29 |
| GO:00307057 | Cervix | CC | cytoskeleton-dependent intracellular transport | 40/2311 | 195/18723 | 7.92e-04 | 6.99e-03 | 40 |
| GO:00097915 | Cervix | CC | post-embryonic development | 20/2311 | 80/18723 | 1.40e-03 | 1.10e-02 | 20 |
| GO:00995157 | Cervix | CC | actin filament-based transport | 8/2311 | 21/18723 | 2.44e-03 | 1.71e-02 | 8 |
| GO:00300507 | Cervix | CC | vesicle transport along actin filament | 7/2311 | 19/18723 | 5.65e-03 | 3.25e-02 | 7 |
| GO:00480084 | Cervix | CC | platelet-derived growth factor receptor signaling pathway | 14/2311 | 56/18723 | 6.93e-03 | 3.74e-02 | 14 |
| GO:0030198 | Cervix | CC | extracellular matrix organization | 52/2311 | 301/18723 | 7.43e-03 | 3.98e-02 | 52 |
| GO:0043062 | Cervix | CC | extracellular structure organization | 52/2311 | 302/18723 | 7.92e-03 | 4.17e-02 | 52 |
| GO:0045229 | Cervix | CC | external encapsulating structure organization | 52/2311 | 304/18723 | 9.00e-03 | 4.57e-02 | 52 |
| GO:000701515 | Cervix | HSIL_HPV | actin filament organization | 43/737 | 442/18723 | 4.77e-08 | 3.59e-06 | 43 |
| GO:00030943 | Cervix | HSIL_HPV | glomerular filtration | 6/737 | 25/18723 | 3.40e-04 | 5.39e-03 | 6 |
| GO:00972054 | Cervix | HSIL_HPV | renal filtration | 6/737 | 26/18723 | 4.27e-04 | 6.41e-03 | 6 |
| GO:003004813 | Cervix | HSIL_HPV | actin filament-based movement | 12/737 | 127/18723 | 4.37e-03 | 3.68e-02 | 12 |
| GO:0007015 | Colorectum | AD | actin filament organization | 167/3918 | 442/18723 | 1.65e-16 | 7.94e-14 | 167 |
| GO:0002064 | Colorectum | AD | epithelial cell development | 89/3918 | 220/18723 | 2.98e-11 | 3.52e-09 | 89 |
| Pathway ID | Tissue | Disease Stage | Description | Gene Ratio | Bg Ratio | pvalue | p.adjust | qvalue | Count |
| hsa0513020 | Cervix | CC | Pathogenic Escherichia coli infection | 63/1267 | 197/8465 | 9.28e-10 | 2.00e-08 | 1.19e-08 | 63 |
| hsa05130110 | Cervix | CC | Pathogenic Escherichia coli infection | 63/1267 | 197/8465 | 9.28e-10 | 2.00e-08 | 1.19e-08 | 63 |
| hsa0513025 | Cervix | HSIL_HPV | Pathogenic Escherichia coli infection | 28/459 | 197/8465 | 2.36e-06 | 4.61e-05 | 3.73e-05 | 28 |
| hsa0513035 | Cervix | HSIL_HPV | Pathogenic Escherichia coli infection | 28/459 | 197/8465 | 2.36e-06 | 4.61e-05 | 3.73e-05 | 28 |
| hsa05130 | Colorectum | AD | Pathogenic Escherichia coli infection | 79/2092 | 197/8465 | 1.05e-06 | 1.36e-05 | 8.65e-06 | 79 |
| hsa051301 | Colorectum | AD | Pathogenic Escherichia coli infection | 79/2092 | 197/8465 | 1.05e-06 | 1.36e-05 | 8.65e-06 | 79 |
| hsa051302 | Colorectum | SER | Pathogenic Escherichia coli infection | 60/1580 | 197/8465 | 3.63e-05 | 4.31e-04 | 3.13e-04 | 60 |
| hsa051303 | Colorectum | SER | Pathogenic Escherichia coli infection | 60/1580 | 197/8465 | 3.63e-05 | 4.31e-04 | 3.13e-04 | 60 |
| hsa051304 | Colorectum | MSS | Pathogenic Escherichia coli infection | 73/1875 | 197/8465 | 1.10e-06 | 1.48e-05 | 9.06e-06 | 73 |
| hsa051305 | Colorectum | MSS | Pathogenic Escherichia coli infection | 73/1875 | 197/8465 | 1.10e-06 | 1.48e-05 | 9.06e-06 | 73 |
| hsa051308 | Colorectum | FAP | Pathogenic Escherichia coli infection | 62/1404 | 197/8465 | 1.37e-07 | 3.08e-06 | 1.87e-06 | 62 |
| hsa051309 | Colorectum | FAP | Pathogenic Escherichia coli infection | 62/1404 | 197/8465 | 1.37e-07 | 3.08e-06 | 1.87e-06 | 62 |
| hsa0513010 | Colorectum | CRC | Pathogenic Escherichia coli infection | 47/1091 | 197/8465 | 1.49e-05 | 3.84e-04 | 2.60e-04 | 47 |
| hsa0513011 | Colorectum | CRC | Pathogenic Escherichia coli infection | 47/1091 | 197/8465 | 1.49e-05 | 3.84e-04 | 2.60e-04 | 47 |
| hsa0513026 | Endometrium | AEH | Pathogenic Escherichia coli infection | 50/1197 | 197/8465 | 1.72e-05 | 1.86e-04 | 1.36e-04 | 50 |
| hsa048144 | Endometrium | AEH | Motor proteins | 42/1197 | 193/8465 | 2.41e-03 | 1.42e-02 | 1.04e-02 | 42 |
| hsa05130112 | Endometrium | AEH | Pathogenic Escherichia coli infection | 50/1197 | 197/8465 | 1.72e-05 | 1.86e-04 | 1.36e-04 | 50 |
| hsa0481411 | Endometrium | AEH | Motor proteins | 42/1197 | 193/8465 | 2.41e-03 | 1.42e-02 | 1.04e-02 | 42 |
| hsa0513027 | Endometrium | EEC | Pathogenic Escherichia coli infection | 51/1237 | 197/8465 | 1.98e-05 | 2.28e-04 | 1.70e-04 | 51 |
| hsa048142 | Endometrium | EEC | Motor proteins | 42/1237 | 193/8465 | 4.43e-03 | 2.39e-02 | 1.78e-02 | 42 |
| Hugo Symbol | Variant Class | Variant Classification | dbSNP RS | HGVSc | HGVSp | HGVSp Short | SWISSPROT | BIOTYPE | SIFT | PolyPhen | Tumor Sample Barcode | Tissue | Histology | Sex | Age | Stage | Therapy Types | Drugs | Outcome |
| MYO1E | SNV | Missense_Mutation | rs773856184 | c.3088N>G | p.Arg1030Gly | p.R1030G | Q12965 | protein_coding | deleterious(0.03) | benign(0.367) | TCGA-A8-A06X-01 | Breast | breast invasive carcinoma | Female | >=65 | I/II | Unknown | Unknown | SD |
| MYO1E | SNV | Missense_Mutation | | c.1961G>T | p.Gly654Val | p.G654V | Q12965 | protein_coding | deleterious(0) | probably_damaging(0.989) | TCGA-A8-A085-01 | Breast | breast invasive carcinoma | Male | <65 | I/II | Hormone Therapy | tamoxiphen | SD |
| MYO1E | SNV | Missense_Mutation | novel | c.247N>C | p.Glu83Gln | p.E83Q | Q12965 | protein_coding | deleterious(0) | probably_damaging(0.999) | TCGA-AO-A0J3-01 | Breast | breast invasive carcinoma | Female | >=65 | I/II | Chemotherapy | cyclophosphamide | SD |
| MYO1E | SNV | Missense_Mutation | | c.1343N>G | p.Asp448Gly | p.D448G | Q12965 | protein_coding | deleterious(0) | probably_damaging(0.986) | TCGA-AO-A128-01 | Breast | breast invasive carcinoma | Female | <65 | I/II | Chemotherapy | doxorubicin | SD |
| MYO1E | SNV | Missense_Mutation | | c.907G>C | p.Glu303Gln | p.E303Q | Q12965 | protein_coding | tolerated(0.21) | benign(0.01) | TCGA-C8-A1HM-01 | Breast | breast invasive carcinoma | Female | >=65 | I/II | Chemotherapy | doxorubicin | CR |
| MYO1E | SNV | Missense_Mutation | rs546799247 | c.971C>A | p.Thr324Lys | p.T324K | Q12965 | protein_coding | deleterious(0.01) | probably_damaging(0.994) | TCGA-D8-A1Y1-01 | Breast | breast invasive carcinoma | Female | >=65 | III/IV | Hormone Therapy | tamoxiphen | PD |
| MYO1E | SNV | Missense_Mutation | | c.470N>T | p.Gly157Val | p.G157V | Q12965 | protein_coding | deleterious(0) | probably_damaging(1) | TCGA-E2-A1LB-01 | Breast | breast invasive carcinoma | Female | <65 | I/II | Chemotherapy | cytoxan | SD |
| MYO1E | SNV | Missense_Mutation | novel | c.1669C>T | p.Arg557Cys | p.R557C | Q12965 | protein_coding | deleterious(0) | probably_damaging(0.998) | TCGA-E2-A9RU-01 | Breast | breast invasive carcinoma | Female | >=65 | III/IV | Hormone Therapy | arimidex | SD |
| MYO1E | insertion | Frame_Shift_Ins | novel | c.3085_3086insACCTTGAATATCCATTATTAAAGCAGTCCAT | p.Arg1029AsnfsTer45 | p.R1029Nfs*45 | Q12965 | protein_coding | | | TCGA-A8-A06X-01 | Breast | breast invasive carcinoma | Female | >=65 | I/II | Unknown | Unknown | SD |
| MYO1E | insertion | Nonsense_Mutation | novel | c.245_246insACCCCATC | p.Tyr82Ter | p.Y82* | Q12965 | protein_coding | | | TCGA-AO-A0J3-01 | Breast | breast invasive carcinoma | Female | >=65 | I/II | Chemotherapy | cyclophosphamide | SD |


