
|
|||||
|
 | |
| |
| |
| |
| |
| |
|
Gene: MYO1C |
Gene summary for MYO1C |
| Gene information | Species | Human | Gene symbol | MYO1C | Gene ID | 4641 |
| Gene name | myosin IC | |
| Gene Alias | MMI-beta | |
| Cytomap | 17p13.3 | |
| Gene Type | protein-coding | GO ID | GO:0002376 | UniProtAcc | O00159 |
Top |
Malignant transformation analysis |
| Identification of the aberrant gene expression in precancerous and cancerous lesions by comparing the gene expression of stem-like cells in diseased tissues with normal stem cells |
| Entrez ID | Symbol | Replicates | Species | Organ | Tissue | Adj P-value | Log2FC | Malignancy |
| 4641 | MYO1C | HTA11_2487_2000001011 | Human | Colorectum | SER | 3.10e-23 | 1.13e+00 | -0.1808 |
| 4641 | MYO1C | HTA11_1938_2000001011 | Human | Colorectum | AD | 2.03e-16 | 9.20e-01 | -0.0811 |
| 4641 | MYO1C | HTA11_78_2000001011 | Human | Colorectum | AD | 1.71e-06 | 6.18e-01 | -0.1088 |
| 4641 | MYO1C | HTA11_347_2000001011 | Human | Colorectum | AD | 7.76e-25 | 8.53e-01 | -0.1954 |
| 4641 | MYO1C | HTA11_411_2000001011 | Human | Colorectum | SER | 2.95e-09 | 1.43e+00 | -0.2602 |
| 4641 | MYO1C | HTA11_2112_2000001011 | Human | Colorectum | SER | 2.02e-12 | 1.34e+00 | -0.2196 |
| 4641 | MYO1C | HTA11_3361_2000001011 | Human | Colorectum | AD | 8.06e-11 | 7.36e-01 | -0.1207 |
| 4641 | MYO1C | HTA11_83_2000001011 | Human | Colorectum | SER | 5.68e-06 | 6.90e-01 | -0.1526 |
| 4641 | MYO1C | HTA11_696_2000001011 | Human | Colorectum | AD | 6.80e-36 | 9.50e-01 | -0.1464 |
| 4641 | MYO1C | HTA11_866_2000001011 | Human | Colorectum | AD | 3.82e-13 | 6.73e-01 | -0.1001 |
| 4641 | MYO1C | HTA11_1391_2000001011 | Human | Colorectum | AD | 2.92e-18 | 8.96e-01 | -0.059 |
| 4641 | MYO1C | HTA11_5212_2000001011 | Human | Colorectum | AD | 1.37e-05 | 7.19e-01 | -0.2061 |
| 4641 | MYO1C | HTA11_546_2000001011 | Human | Colorectum | AD | 1.12e-03 | 5.61e-01 | -0.0842 |
| 4641 | MYO1C | HTA11_866_3004761011 | Human | Colorectum | AD | 1.30e-03 | 3.04e-01 | 0.096 |
| 4641 | MYO1C | HTA11_9408_2000001011 | Human | Colorectum | AD | 2.37e-04 | 8.96e-01 | 0.0451 |
| 4641 | MYO1C | HTA11_8622_2000001021 | Human | Colorectum | SER | 9.54e-03 | 5.02e-01 | 0.0528 |
| 4641 | MYO1C | HTA11_7663_2000001011 | Human | Colorectum | SER | 6.17e-04 | 7.35e-01 | 0.0131 |
| 4641 | MYO1C | HTA11_10623_2000001011 | Human | Colorectum | AD | 3.05e-03 | 5.98e-01 | -0.0177 |
| 4641 | MYO1C | HTA11_10711_2000001011 | Human | Colorectum | AD | 2.03e-05 | 5.19e-01 | 0.0338 |
| 4641 | MYO1C | HTA11_7696_3000711011 | Human | Colorectum | AD | 4.70e-16 | 7.25e-01 | 0.0674 |
| Page: 1 2 3 4 5 6 7 8 9 |
| Tissue | Expression Dynamics | Abbreviation |
| Colorectum (GSE201348) | 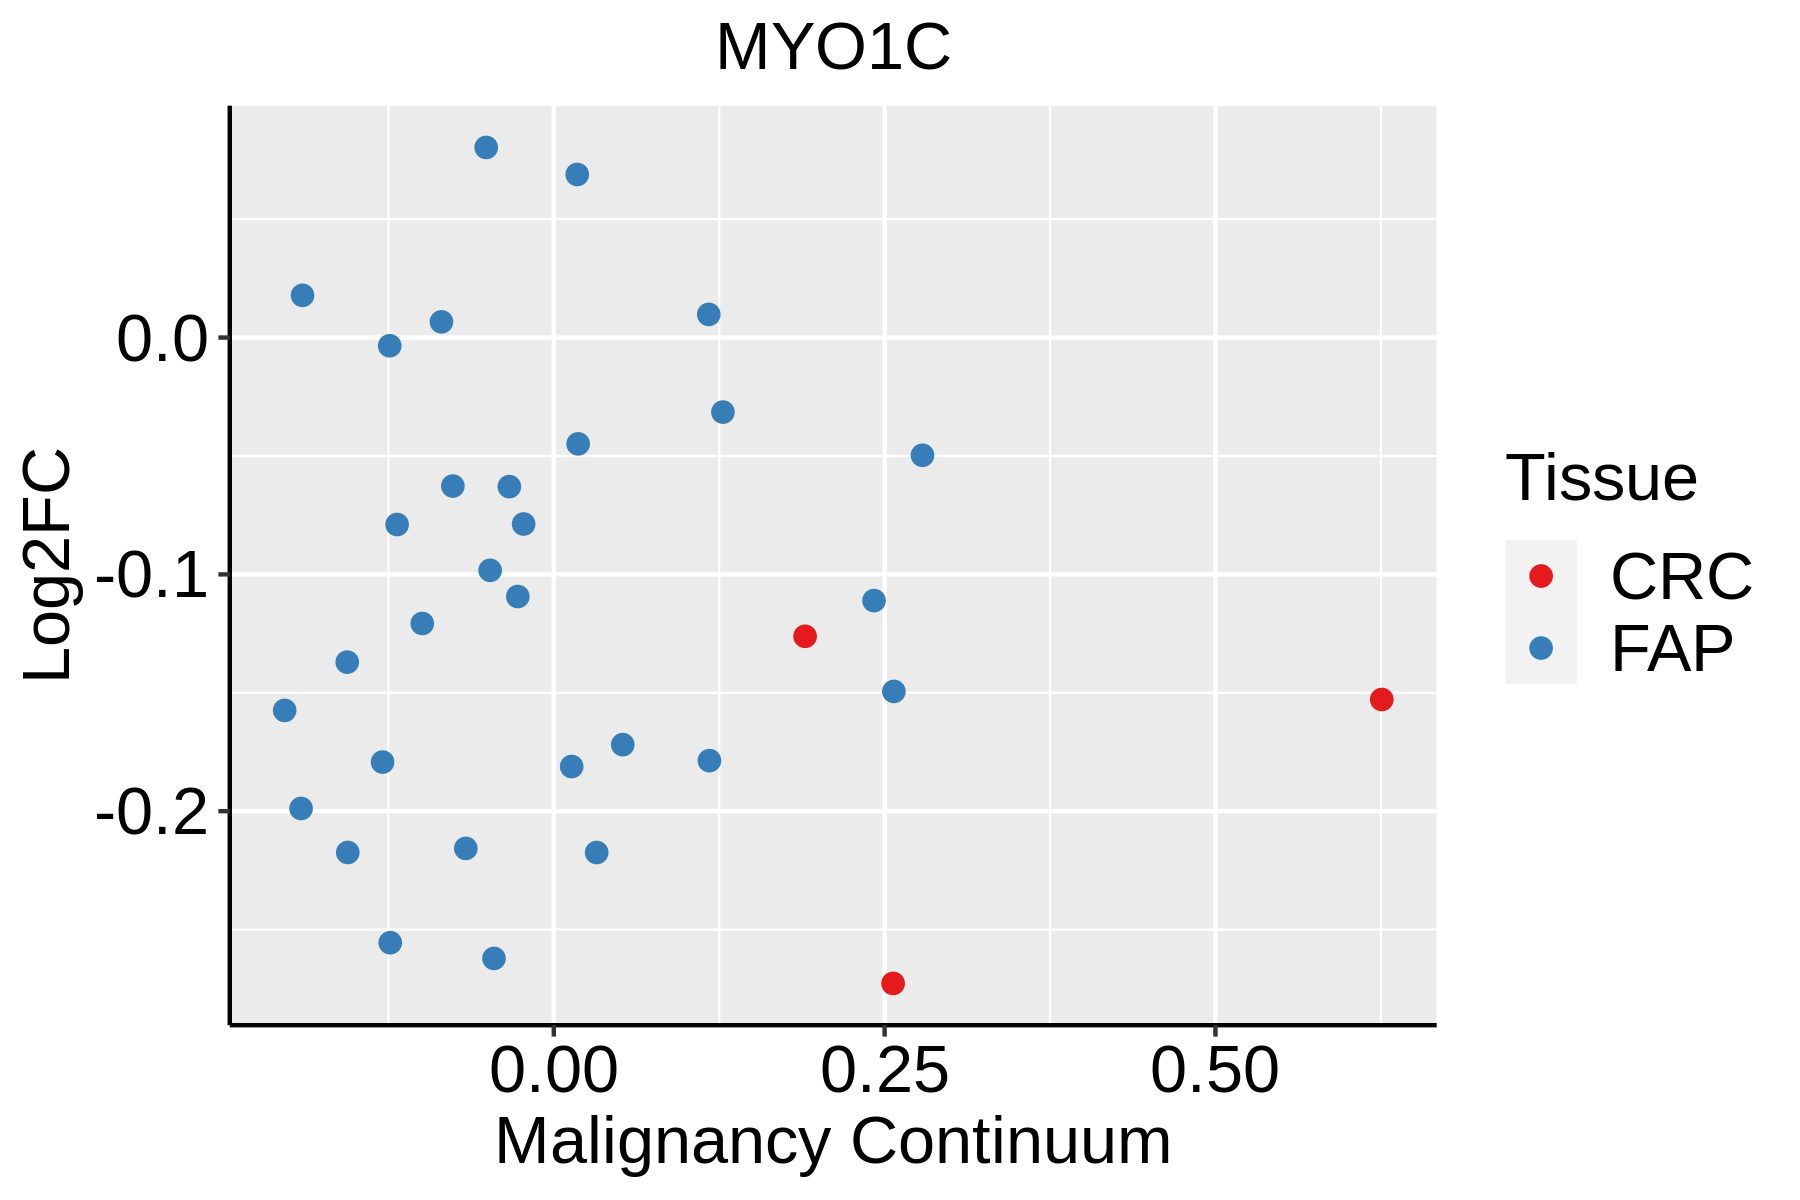 | FAP: Familial adenomatous polyposis |
| CRC: Colorectal cancer | ||
| Colorectum (HTA11) |  | AD: Adenomas |
| SER: Sessile serrated lesions | ||
| MSI-H: Microsatellite-high colorectal cancer | ||
| MSS: Microsatellite stable colorectal cancer | ||
| Esophagus | 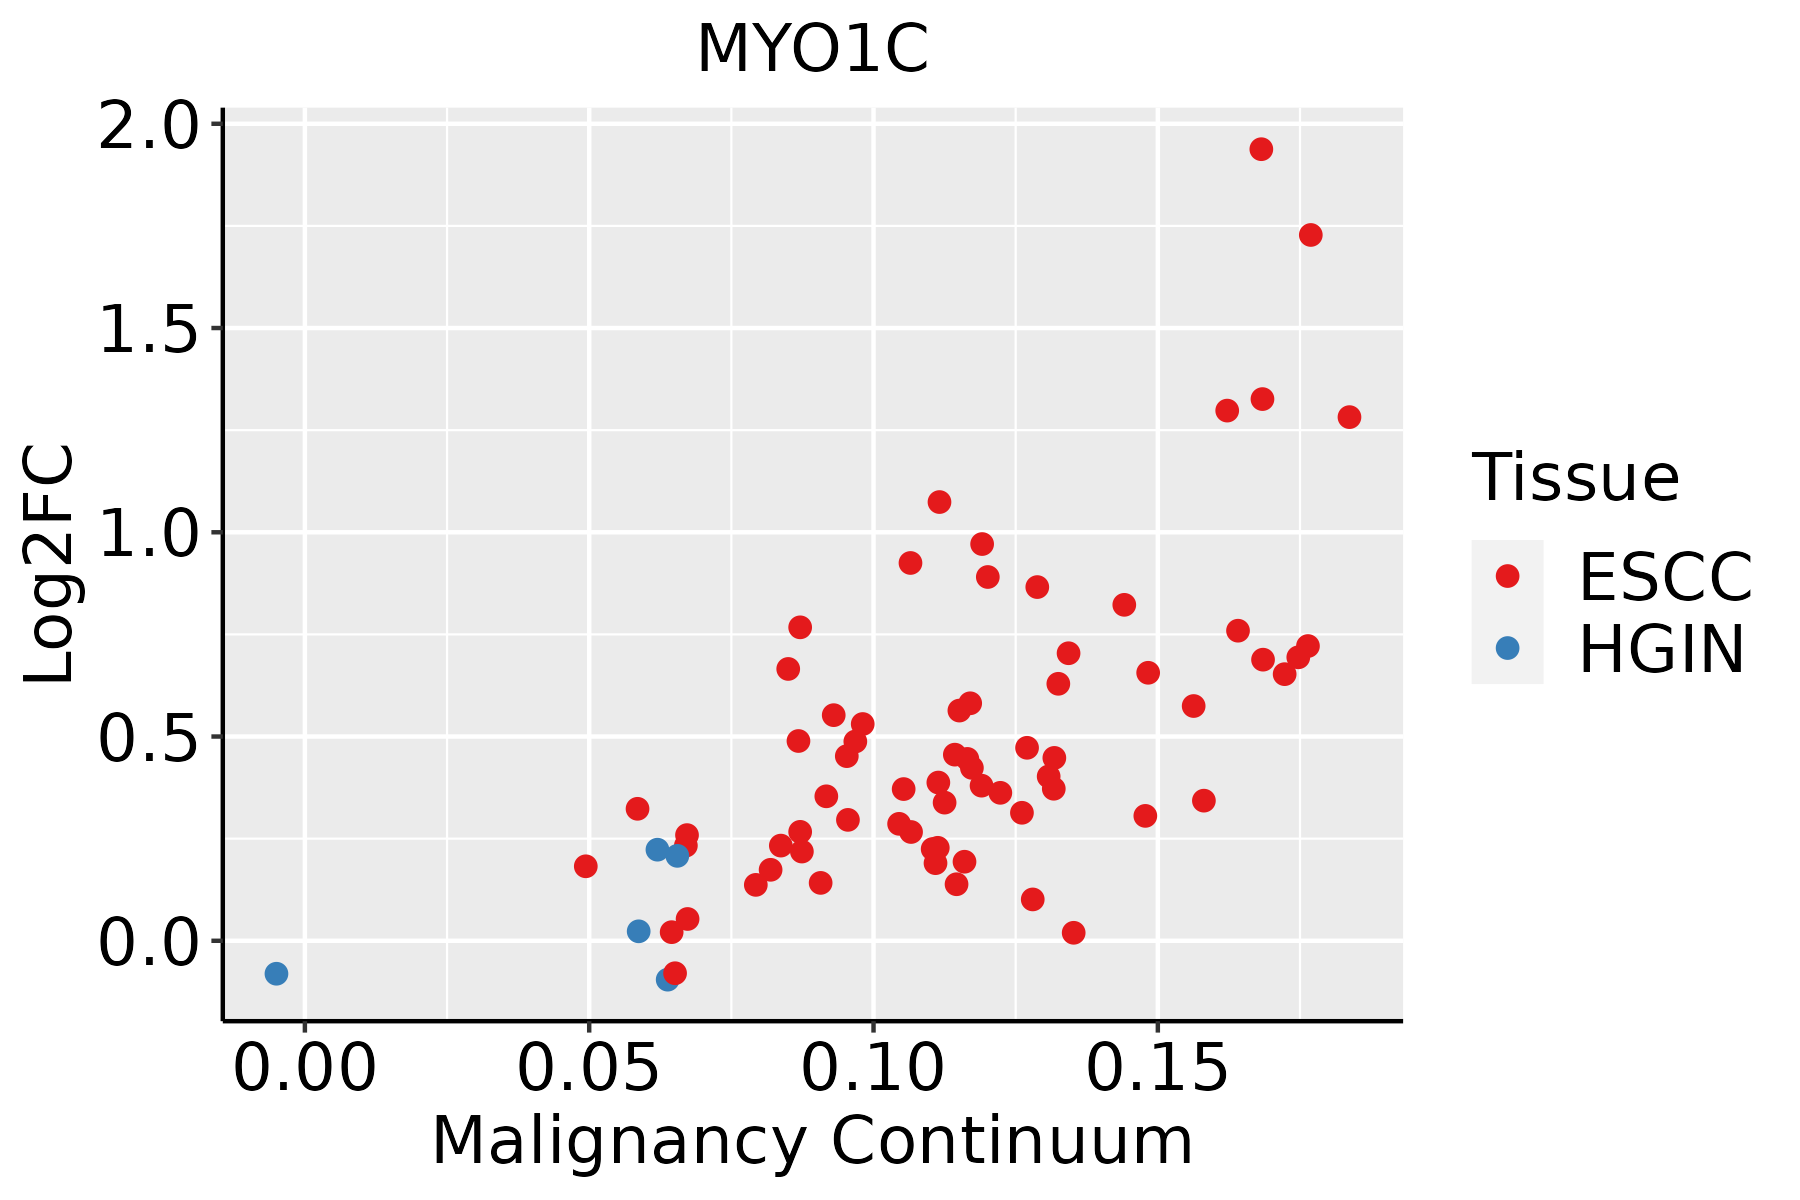 | ESCC: Esophageal squamous cell carcinoma |
| HGIN: High-grade intraepithelial neoplasias | ||
| LGIN: Low-grade intraepithelial neoplasias | ||
| Liver |  | HCC: Hepatocellular carcinoma |
| NAFLD: Non-alcoholic fatty liver disease | ||
| Oral Cavity | 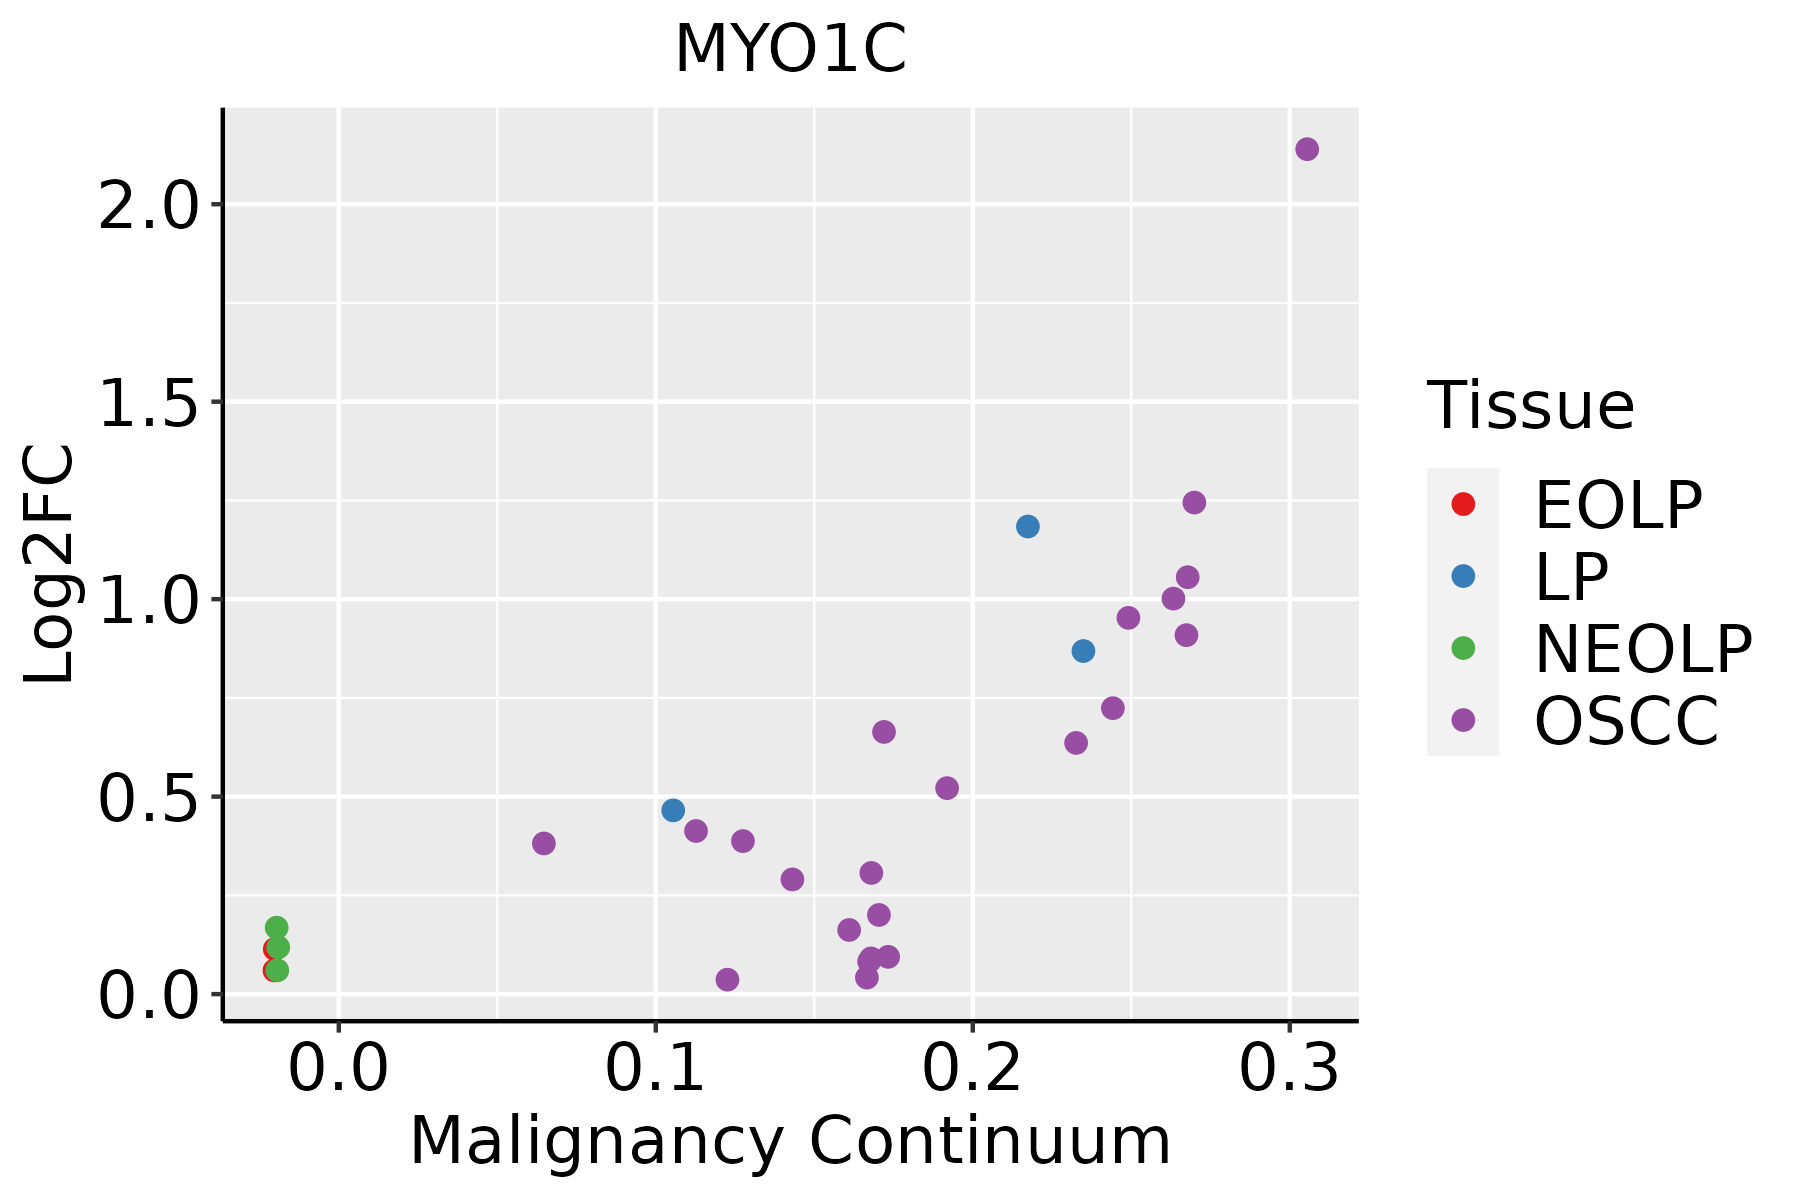 | EOLP: Erosive Oral lichen planus |
| LP: leukoplakia | ||
| NEOLP: Non-erosive oral lichen planus | ||
| OSCC: Oral squamous cell carcinoma | ||
| Prostate |  | BPH: Benign Prostatic Hyperplasia |
| Skin | 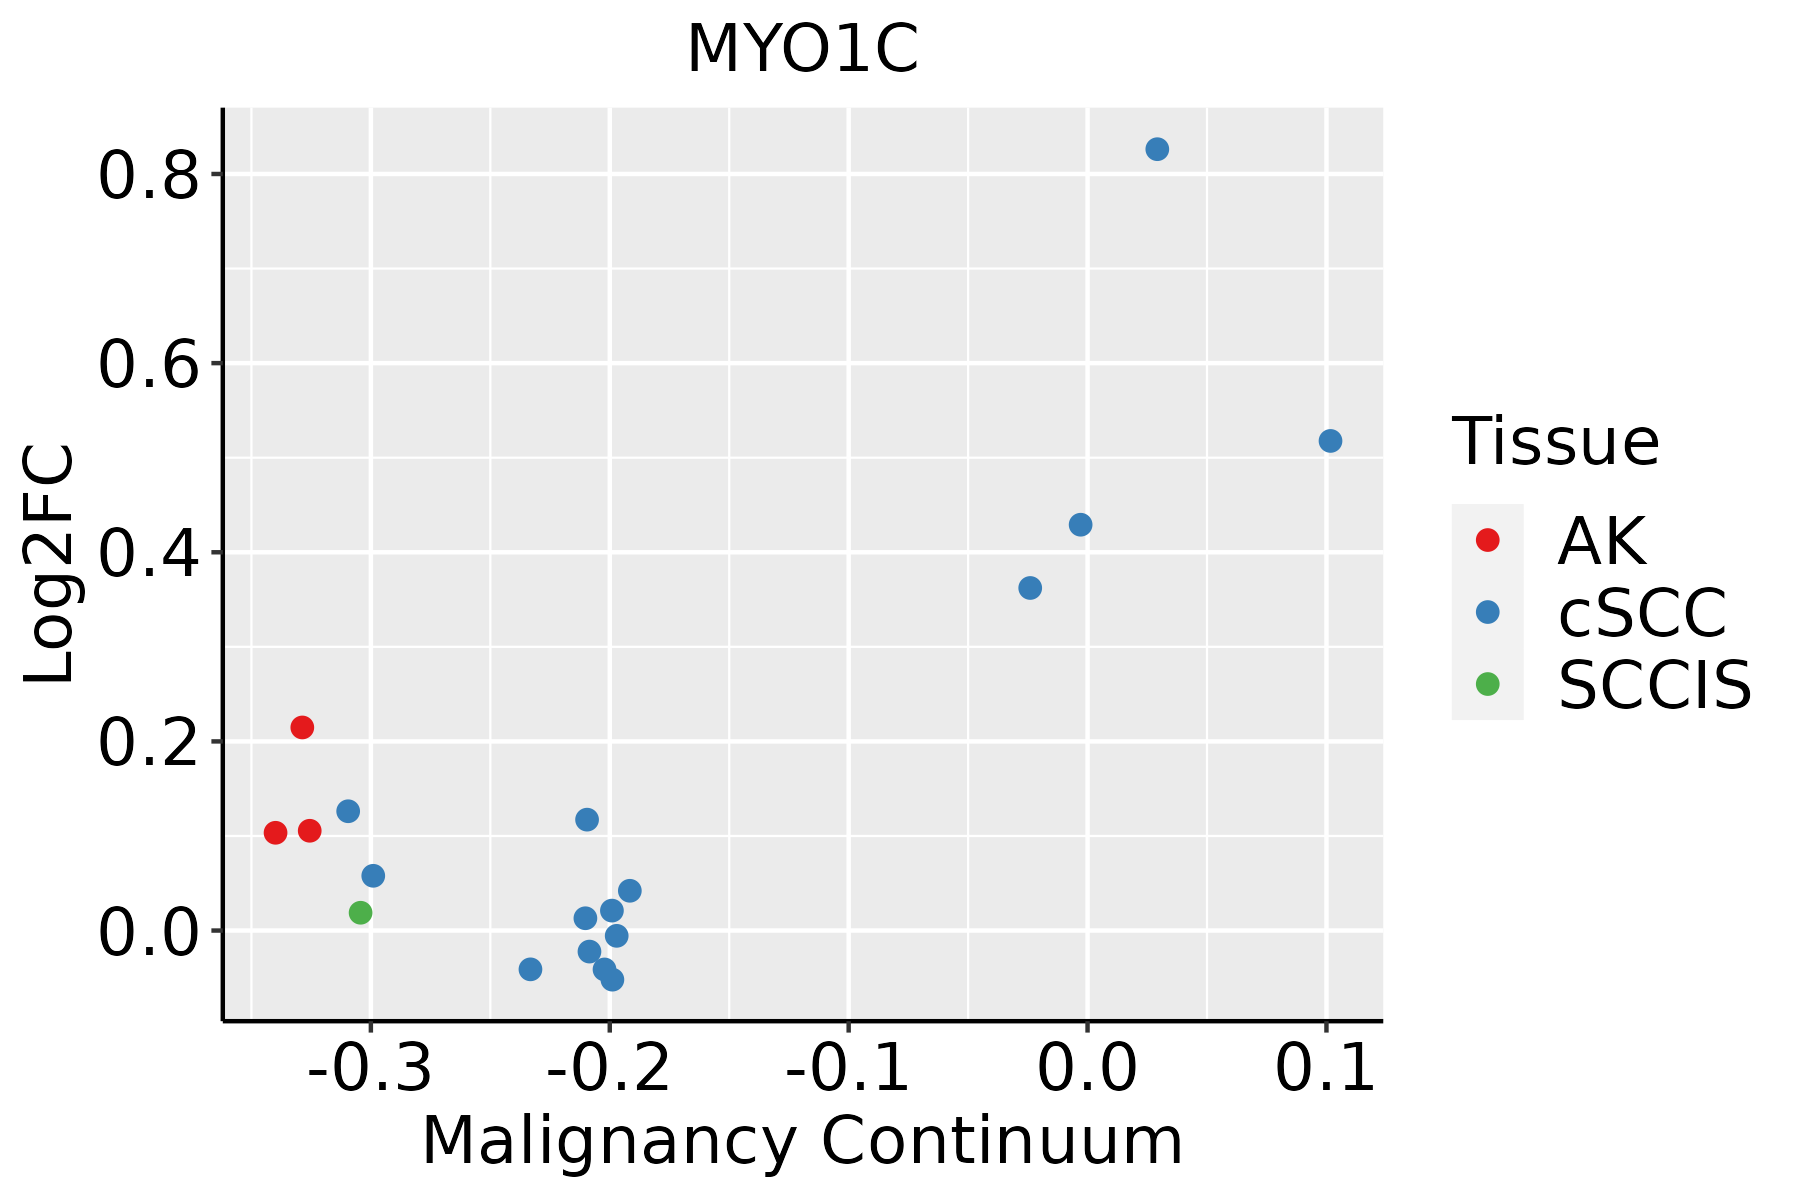 | AK: Actinic keratosis |
| cSCC: Cutaneous squamous cell carcinoma | ||
| SCCIS:squamous cell carcinoma in situ | ||
| Thyroid | 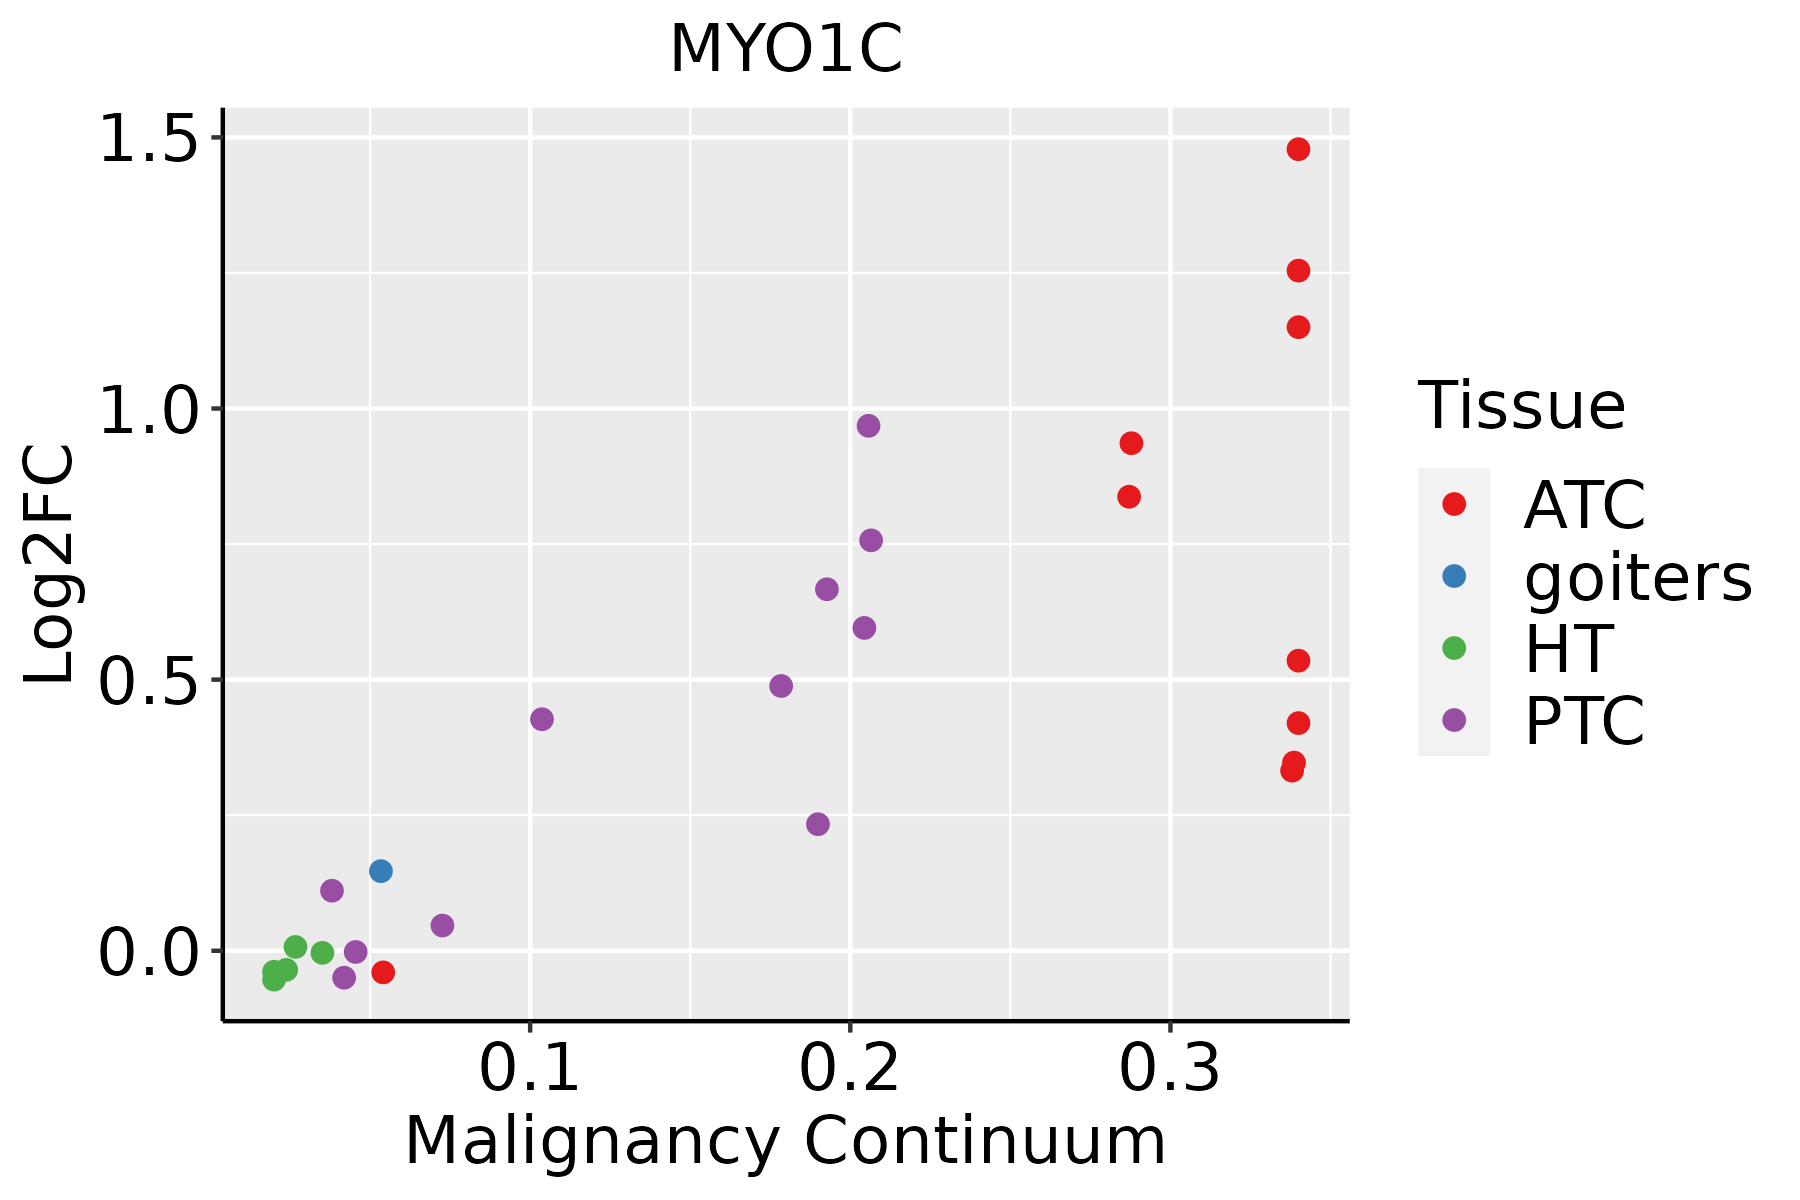 | ATC: Anaplastic thyroid cancer |
| HT: Hashimoto's thyroiditis | ||
| PTC: Papillary thyroid cancer |
| ∗log2FC in expression of this searched gene in stem-like cells from each diseased tissue sample relative to stem-like cells in normal samples in each tissue plotted against the malignancy continuum. Samples are colored based on if they are from different disease stage. |
Top |
Malignant transformation related pathway analysis |
| Find out the enriched GO biological processes and KEGG pathways involved in transition from healthy to precancer to cancer |
| Tissue | Disease Stage | Enriched GO biological Processes |
| Colorectum | AD |  |
| Colorectum | SER |  |
| Colorectum | MSS |  |
| Colorectum | MSI-H |  |
| Colorectum | FAP |  |
| ∗Top 15 enriched GO BP terms are showed in the bar plot of each disease state in each tissue. Each row represents a significant GO biological process which is colored according to the -log10(p.adjust). |
| Page: 1 2 3 4 5 6 7 8 9 |
| GO ID | Tissue | Disease Stage | Description | Gene Ratio | Bg Ratio | pvalue | p.adjust | Count |
| GO:0007015 | Colorectum | AD | actin filament organization | 167/3918 | 442/18723 | 1.65e-16 | 7.94e-14 | 167 |
| GO:0032535 | Colorectum | AD | regulation of cellular component size | 142/3918 | 383/18723 | 1.74e-13 | 3.41e-11 | 142 |
| GO:1903829 | Colorectum | AD | positive regulation of cellular protein localization | 110/3918 | 276/18723 | 4.58e-13 | 8.44e-11 | 110 |
| GO:1902903 | Colorectum | AD | regulation of supramolecular fiber organization | 139/3918 | 383/18723 | 2.01e-12 | 3.19e-10 | 139 |
| GO:0032970 | Colorectum | AD | regulation of actin filament-based process | 142/3918 | 397/18723 | 4.05e-12 | 5.90e-10 | 142 |
| GO:0110053 | Colorectum | AD | regulation of actin filament organization | 108/3918 | 278/18723 | 5.02e-12 | 6.98e-10 | 108 |
| GO:0008154 | Colorectum | AD | actin polymerization or depolymerization | 90/3918 | 218/18723 | 6.14e-12 | 8.23e-10 | 90 |
| GO:0032271 | Colorectum | AD | regulation of protein polymerization | 94/3918 | 233/18723 | 1.01e-11 | 1.29e-09 | 94 |
| GO:0030041 | Colorectum | AD | actin filament polymerization | 81/3918 | 191/18723 | 1.35e-11 | 1.69e-09 | 81 |
| GO:0051258 | Colorectum | AD | protein polymerization | 112/3918 | 297/18723 | 1.85e-11 | 2.27e-09 | 112 |
| GO:0043254 | Colorectum | AD | regulation of protein-containing complex assembly | 148/3918 | 428/18723 | 2.64e-11 | 3.18e-09 | 148 |
| GO:0008064 | Colorectum | AD | regulation of actin polymerization or depolymerization | 79/3918 | 188/18723 | 4.17e-11 | 4.74e-09 | 79 |
| GO:0030833 | Colorectum | AD | regulation of actin filament polymerization | 74/3918 | 172/18723 | 4.50e-11 | 5.03e-09 | 74 |
| GO:0030832 | Colorectum | AD | regulation of actin filament length | 79/3918 | 189/18723 | 5.71e-11 | 6.27e-09 | 79 |
| GO:1902905 | Colorectum | AD | positive regulation of supramolecular fiber organization | 85/3918 | 209/18723 | 5.95e-11 | 6.33e-09 | 85 |
| GO:0090150 | Colorectum | AD | establishment of protein localization to membrane | 100/3918 | 260/18723 | 6.01e-11 | 6.33e-09 | 100 |
| GO:0032956 | Colorectum | AD | regulation of actin cytoskeleton organization | 127/3918 | 358/18723 | 1.03e-10 | 1.04e-08 | 127 |
| GO:0051495 | Colorectum | AD | positive regulation of cytoskeleton organization | 89/3918 | 226/18723 | 1.61e-10 | 1.56e-08 | 89 |
| GO:0032273 | Colorectum | AD | positive regulation of protein polymerization | 62/3918 | 138/18723 | 1.94e-10 | 1.76e-08 | 62 |
| GO:1905475 | Colorectum | AD | regulation of protein localization to membrane | 73/3918 | 175/18723 | 3.37e-10 | 2.93e-08 | 73 |
| Page: 1 2 3 4 5 6 7 8 9 10 11 12 13 14 15 16 17 18 19 20 21 22 23 24 25 26 27 28 29 30 31 32 33 34 35 36 37 38 39 40 41 42 43 44 |
| Pathway ID | Tissue | Disease Stage | Description | Gene Ratio | Bg Ratio | pvalue | p.adjust | qvalue | Count |
| hsa05130 | Colorectum | AD | Pathogenic Escherichia coli infection | 79/2092 | 197/8465 | 1.05e-06 | 1.36e-05 | 8.65e-06 | 79 |
| hsa051301 | Colorectum | AD | Pathogenic Escherichia coli infection | 79/2092 | 197/8465 | 1.05e-06 | 1.36e-05 | 8.65e-06 | 79 |
| hsa051302 | Colorectum | SER | Pathogenic Escherichia coli infection | 60/1580 | 197/8465 | 3.63e-05 | 4.31e-04 | 3.13e-04 | 60 |
| hsa051303 | Colorectum | SER | Pathogenic Escherichia coli infection | 60/1580 | 197/8465 | 3.63e-05 | 4.31e-04 | 3.13e-04 | 60 |
| hsa051308 | Colorectum | FAP | Pathogenic Escherichia coli infection | 62/1404 | 197/8465 | 1.37e-07 | 3.08e-06 | 1.87e-06 | 62 |
| hsa051309 | Colorectum | FAP | Pathogenic Escherichia coli infection | 62/1404 | 197/8465 | 1.37e-07 | 3.08e-06 | 1.87e-06 | 62 |
| hsa0513010 | Colorectum | CRC | Pathogenic Escherichia coli infection | 47/1091 | 197/8465 | 1.49e-05 | 3.84e-04 | 2.60e-04 | 47 |
| hsa0513011 | Colorectum | CRC | Pathogenic Escherichia coli infection | 47/1091 | 197/8465 | 1.49e-05 | 3.84e-04 | 2.60e-04 | 47 |
| hsa0513039 | Esophagus | HGIN | Pathogenic Escherichia coli infection | 54/1383 | 197/8465 | 4.91e-05 | 6.15e-04 | 4.89e-04 | 54 |
| hsa05130115 | Esophagus | HGIN | Pathogenic Escherichia coli infection | 54/1383 | 197/8465 | 4.91e-05 | 6.15e-04 | 4.89e-04 | 54 |
| hsa05130211 | Esophagus | ESCC | Pathogenic Escherichia coli infection | 142/4205 | 197/8465 | 8.21e-11 | 1.06e-09 | 5.42e-10 | 142 |
| hsa05130310 | Esophagus | ESCC | Pathogenic Escherichia coli infection | 142/4205 | 197/8465 | 8.21e-11 | 1.06e-09 | 5.42e-10 | 142 |
| hsa0513022 | Liver | Cirrhotic | Pathogenic Escherichia coli infection | 88/2530 | 197/8465 | 6.48e-06 | 6.24e-05 | 3.84e-05 | 88 |
| hsa0513032 | Liver | Cirrhotic | Pathogenic Escherichia coli infection | 88/2530 | 197/8465 | 6.48e-06 | 6.24e-05 | 3.84e-05 | 88 |
| hsa0513042 | Liver | HCC | Pathogenic Escherichia coli infection | 129/4020 | 197/8465 | 2.02e-07 | 2.50e-06 | 1.39e-06 | 129 |
| hsa0513052 | Liver | HCC | Pathogenic Escherichia coli infection | 129/4020 | 197/8465 | 2.02e-07 | 2.50e-06 | 1.39e-06 | 129 |
| hsa0513030 | Oral cavity | OSCC | Pathogenic Escherichia coli infection | 129/3704 | 197/8465 | 4.32e-10 | 5.17e-09 | 2.63e-09 | 129 |
| hsa05130114 | Oral cavity | OSCC | Pathogenic Escherichia coli infection | 129/3704 | 197/8465 | 4.32e-10 | 5.17e-09 | 2.63e-09 | 129 |
| hsa05130210 | Oral cavity | LP | Pathogenic Escherichia coli infection | 87/2418 | 197/8465 | 1.71e-06 | 1.78e-05 | 1.15e-05 | 87 |
| hsa0513038 | Oral cavity | LP | Pathogenic Escherichia coli infection | 87/2418 | 197/8465 | 1.71e-06 | 1.78e-05 | 1.15e-05 | 87 |
| Page: 1 2 |
Top |
Cell-cell communication analysis |
| Identification of potential cell-cell interactions between two cell types and their ligand-receptor pairs for different disease states |
| Ligand | Receptor | LRpair | Pathway | Tissue | Disease Stage |
| Page: 1 |
Top |
Single-cell gene regulatory network inference analysis |
| Find out the significant the regulons (TFs) and the target genes of each regulon across cell types for different disease states |
| TF | Cell Type | Tissue | Disease Stage | Target Gene | RSS | Regulon Activity |
| ∗The dot plots of a searched regulon are shown for all cell subpopulations in each disease state of each tissue based on the regulon specific score inferred using pySCENIC and by calculating the average expression. |
| Page: 1 |
Top |
Somatic mutation of malignant transformation related genes |
| Annotation of somatic variants for genes involved in malignant transformation |
| Hugo Symbol | Variant Class | Variant Classification | dbSNP RS | HGVSc | HGVSp | HGVSp Short | SWISSPROT | BIOTYPE | SIFT | PolyPhen | Tumor Sample Barcode | Tissue | Histology | Sex | Age | Stage | Therapy Types | Drugs | Outcome |
| MYO1C | SNV | Missense_Mutation | novel | c.1661G>C | p.Ser554Thr | p.S554T | O00159 | protein_coding | tolerated(0.3) | benign(0.14) | TCGA-A7-A6VV-01 | Breast | breast invasive carcinoma | Female | <65 | I/II | Chemotherapy | cyclophosphamide | CR |
| MYO1C | SNV | Missense_Mutation | c.2903N>T | p.Ser968Phe | p.S968F | O00159 | protein_coding | deleterious(0.02) | probably_damaging(0.981) | TCGA-AC-A23H-01 | Breast | breast invasive carcinoma | Female | >=65 | I/II | Unknown | Unknown | PD | |
| MYO1C | SNV | Missense_Mutation | rs761399446 | c.2065C>T | p.Arg689Trp | p.R689W | O00159 | protein_coding | deleterious(0.01) | possibly_damaging(0.892) | TCGA-D8-A1XM-01 | Breast | breast invasive carcinoma | Female | <65 | I/II | Unknown | Unknown | SD |
| MYO1C | SNV | Missense_Mutation | novel | c.3116C>G | p.Pro1039Arg | p.P1039R | O00159 | protein_coding | tolerated(0.42) | benign(0.007) | TCGA-VS-A9U6-01 | Cervix | cervical & endocervical cancer | Female | <65 | I/II | Chemotherapy | cisplatin | PD |
| MYO1C | SNV | Missense_Mutation | rs770632413 | c.1993N>T | p.Arg665Cys | p.R665C | O00159 | protein_coding | deleterious(0) | probably_damaging(1) | TCGA-AA-3660-01 | Colorectum | colon adenocarcinoma | Female | <65 | I/II | Unknown | Unknown | SD |
| MYO1C | SNV | Missense_Mutation | rs764512419 | c.2842G>A | p.Val948Ile | p.V948I | O00159 | protein_coding | tolerated(0.23) | benign(0.014) | TCGA-AA-3833-01 | Colorectum | colon adenocarcinoma | Female | <65 | I/II | Unknown | Unknown | SD |
| MYO1C | SNV | Missense_Mutation | c.2431N>A | p.His811Asn | p.H811N | O00159 | protein_coding | tolerated(0.3) | benign(0.001) | TCGA-AZ-6598-01 | Colorectum | colon adenocarcinoma | Female | >=65 | I/II | Unknown | Unknown | SD | |
| MYO1C | SNV | Missense_Mutation | c.1727N>A | p.Ser576Asn | p.S576N | O00159 | protein_coding | tolerated(0.34) | benign(0.007) | TCGA-AZ-6598-01 | Colorectum | colon adenocarcinoma | Female | >=65 | I/II | Unknown | Unknown | SD | |
| MYO1C | SNV | Missense_Mutation | c.2174C>T | p.Ala725Val | p.A725V | O00159 | protein_coding | tolerated(0.3) | benign(0.246) | TCGA-CK-4951-01 | Colorectum | colon adenocarcinoma | Female | >=65 | I/II | Unknown | Unknown | PD | |
| MYO1C | SNV | Missense_Mutation | c.1896A>T | p.Lys632Asn | p.K632N | O00159 | protein_coding | deleterious(0) | probably_damaging(0.981) | TCGA-CK-4951-01 | Colorectum | colon adenocarcinoma | Female | >=65 | I/II | Unknown | Unknown | PD |
| Page: 1 2 3 4 5 6 7 8 9 |
Top |
Related drugs of malignant transformation related genes |
| Identification of chemicals and drugs interact with genes involved in malignant transfromation |
| (DGIdb 4.0) |
| Entrez ID | Symbol | Category | Interaction Types | Drug Claim Name | Drug Name | PMIDs |
| Page: 1 |

Copyright 2023-Present -The University of Texas Health Science Center at Houston |