| Tissue | Expression Dynamics | Abbreviation |
| Cervix |  | CC: Cervix cancer |
| HSIL_HPV: HPV-infected high-grade squamous intraepithelial lesions |
| N_HPV: HPV-infected normal cervix |
| Colorectum (GSE201348) |  | FAP: Familial adenomatous polyposis |
| CRC: Colorectal cancer |
| Colorectum (HTA11) |  | AD: Adenomas |
| SER: Sessile serrated lesions |
| MSI-H: Microsatellite-high colorectal cancer |
| MSS: Microsatellite stable colorectal cancer |
| Esophagus |  | ESCC: Esophageal squamous cell carcinoma |
| HGIN: High-grade intraepithelial neoplasias |
| LGIN: Low-grade intraepithelial neoplasias |
| Liver |  | HCC: Hepatocellular carcinoma |
| NAFLD: Non-alcoholic fatty liver disease |
| Lung | 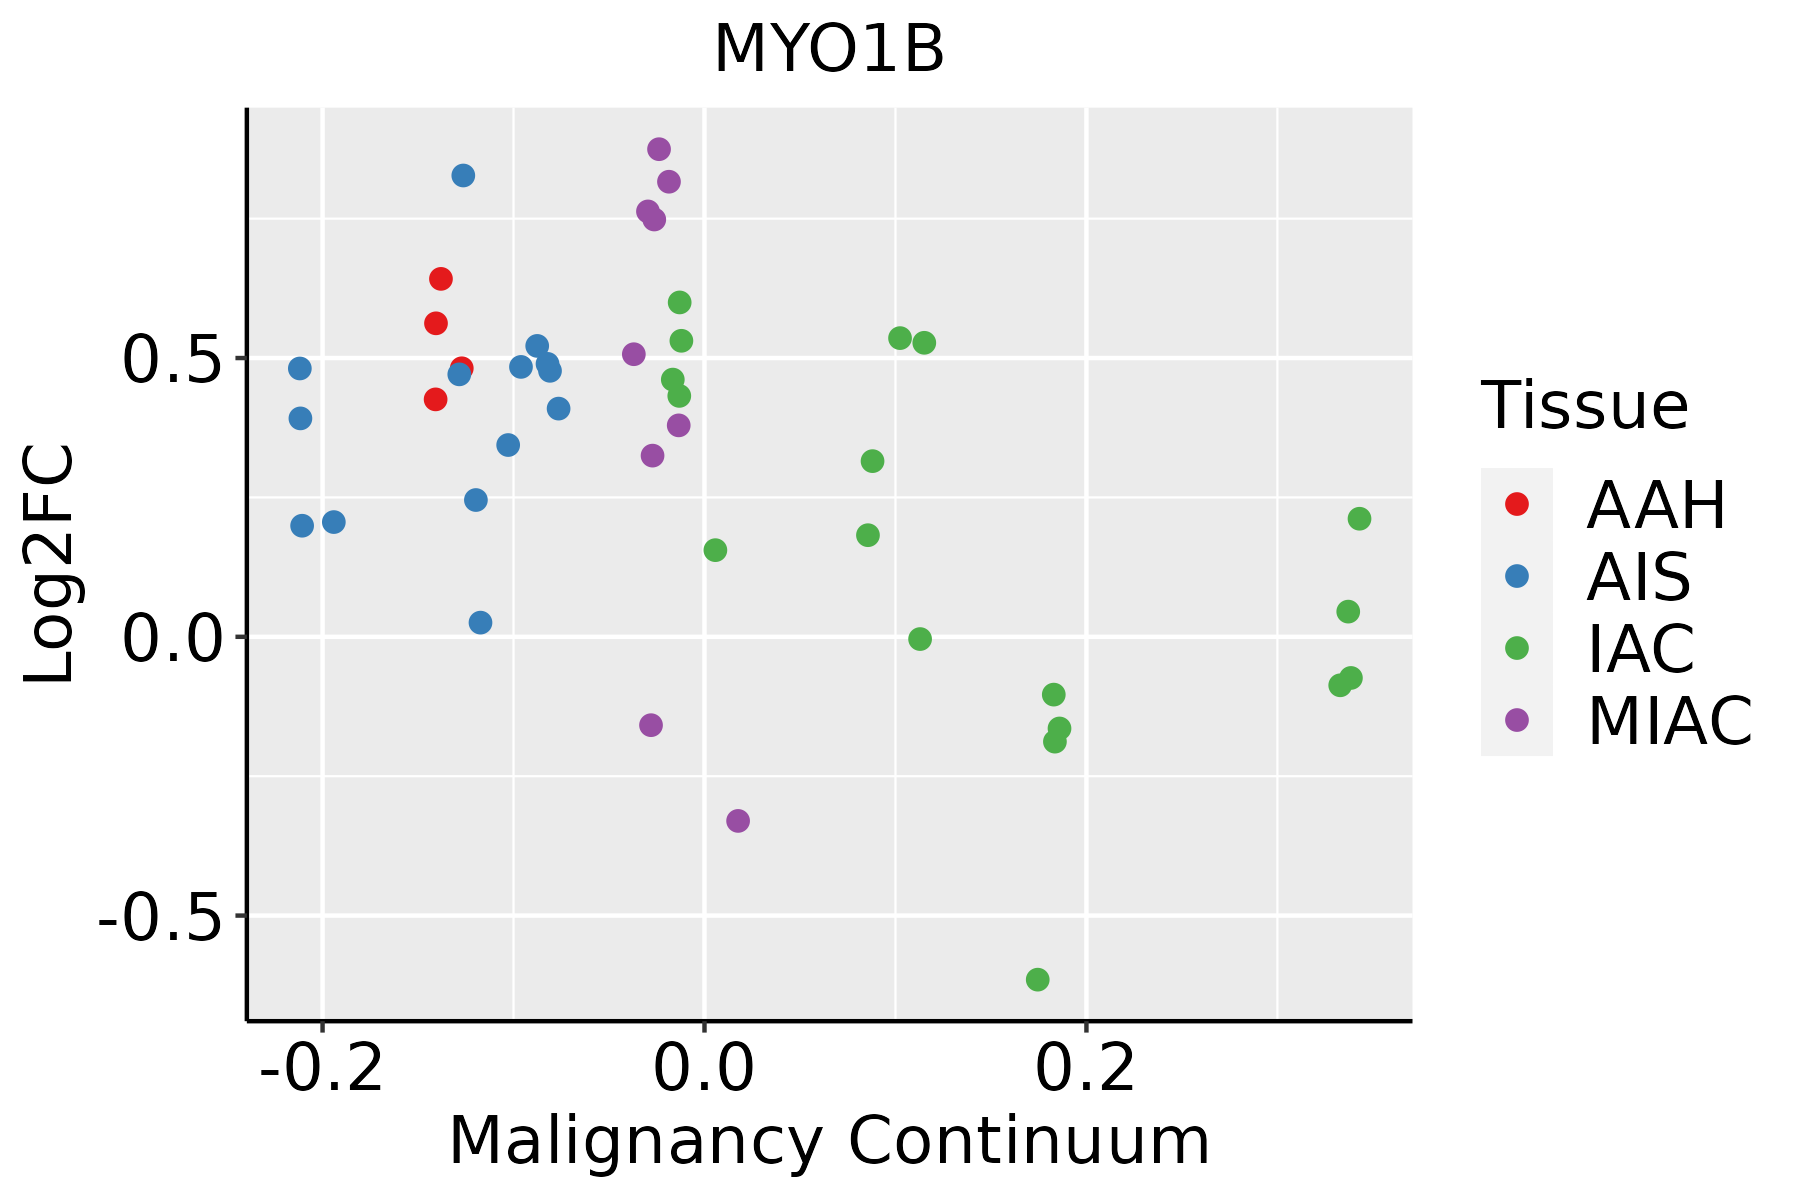 | AAH: Atypical adenomatous hyperplasia |
| AIS: Adenocarcinoma in situ |
| IAC: Invasive lung adenocarcinoma |
| MIA: Minimally invasive adenocarcinoma |
| Oral Cavity |  | EOLP: Erosive Oral lichen planus |
| LP: leukoplakia |
| NEOLP: Non-erosive oral lichen planus |
| OSCC: Oral squamous cell carcinoma |
| Prostate | 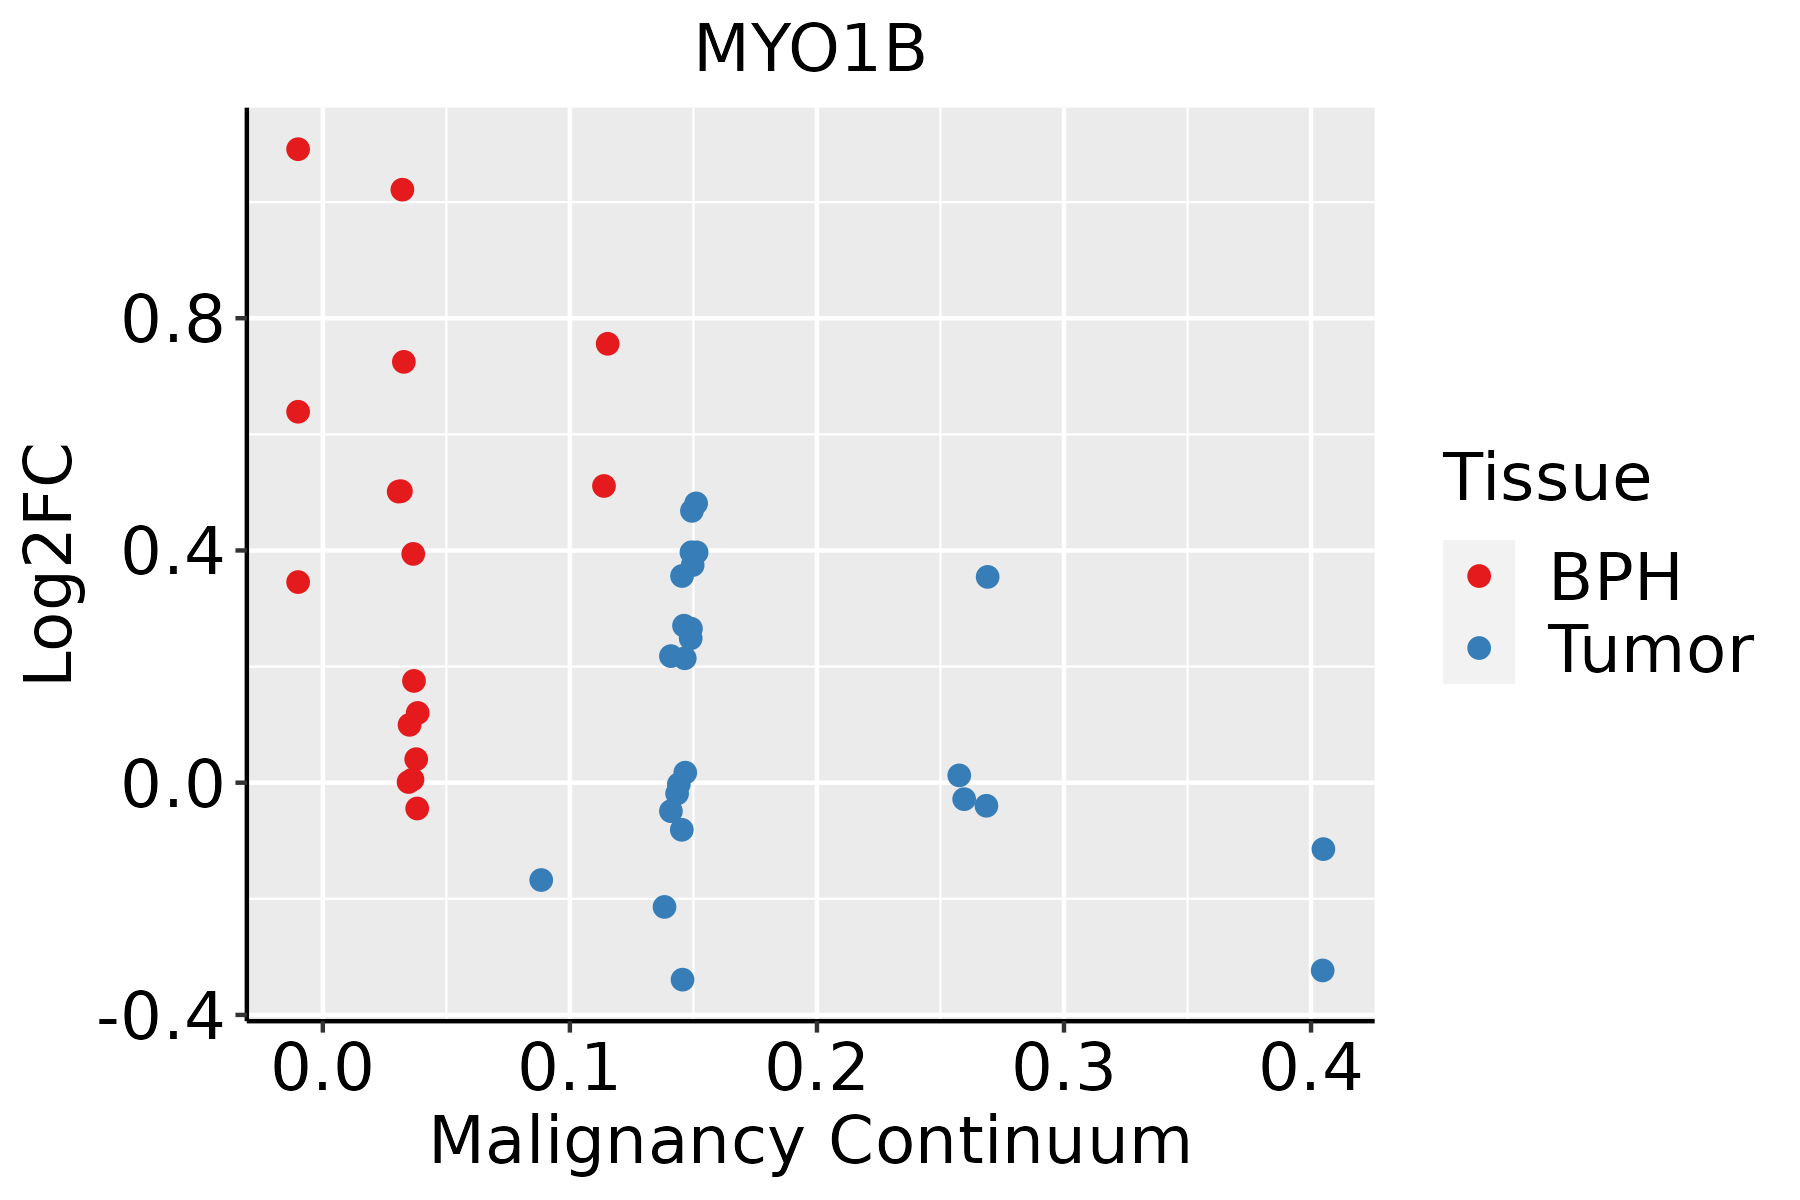 | BPH: Benign Prostatic Hyperplasia |
| Skin |  | AK: Actinic keratosis |
| cSCC: Cutaneous squamous cell carcinoma |
| SCCIS:squamous cell carcinoma in situ |
| Thyroid |  | ATC: Anaplastic thyroid cancer |
| HT: Hashimoto's thyroiditis |
| PTC: Papillary thyroid cancer |
| GO ID | Tissue | Disease Stage | Description | Gene Ratio | Bg Ratio | pvalue | p.adjust | Count |
| GO:000701510 | Cervix | CC | actin filament organization | 109/2311 | 442/18723 | 4.92e-13 | 2.45e-10 | 109 |
| GO:006157210 | Cervix | CC | actin filament bundle organization | 44/2311 | 161/18723 | 2.08e-07 | 9.34e-06 | 44 |
| GO:005101710 | Cervix | CC | actin filament bundle assembly | 43/2311 | 157/18723 | 2.66e-07 | 1.12e-05 | 43 |
| GO:00516567 | Cervix | CC | establishment of organelle localization | 76/2311 | 390/18723 | 3.17e-05 | 5.21e-04 | 76 |
| GO:00068927 | Cervix | CC | post-Golgi vesicle-mediated transport | 28/2311 | 104/18723 | 4.31e-05 | 6.61e-04 | 28 |
| GO:00481938 | Cervix | CC | Golgi vesicle transport | 58/2311 | 296/18723 | 2.24e-04 | 2.54e-03 | 58 |
| GO:00300487 | Cervix | CC | actin filament-based movement | 29/2311 | 127/18723 | 6.91e-04 | 6.33e-03 | 29 |
| GO:00307057 | Cervix | CC | cytoskeleton-dependent intracellular transport | 40/2311 | 195/18723 | 7.92e-04 | 6.99e-03 | 40 |
| GO:00995157 | Cervix | CC | actin filament-based transport | 8/2311 | 21/18723 | 2.44e-03 | 1.71e-02 | 8 |
| GO:00300507 | Cervix | CC | vesicle transport along actin filament | 7/2311 | 19/18723 | 5.65e-03 | 3.25e-02 | 7 |
| GO:0007015 | Colorectum | AD | actin filament organization | 167/3918 | 442/18723 | 1.65e-16 | 7.94e-14 | 167 |
| GO:0048193 | Colorectum | AD | Golgi vesicle transport | 109/3918 | 296/18723 | 1.80e-10 | 1.68e-08 | 109 |
| GO:0051656 | Colorectum | AD | establishment of organelle localization | 131/3918 | 390/18723 | 3.00e-09 | 2.06e-07 | 131 |
| GO:0006892 | Colorectum | AD | post-Golgi vesicle-mediated transport | 45/3918 | 104/18723 | 2.22e-07 | 9.26e-06 | 45 |
| GO:0061572 | Colorectum | AD | actin filament bundle organization | 60/3918 | 161/18723 | 1.33e-06 | 4.23e-05 | 60 |
| GO:0051017 | Colorectum | AD | actin filament bundle assembly | 58/3918 | 157/18723 | 2.74e-06 | 7.89e-05 | 58 |
| GO:0051650 | Colorectum | AD | establishment of vesicle localization | 57/3918 | 161/18723 | 1.47e-05 | 3.15e-04 | 57 |
| GO:0051648 | Colorectum | AD | vesicle localization | 59/3918 | 177/18723 | 7.83e-05 | 1.25e-03 | 59 |
| GO:0030048 | Colorectum | AD | actin filament-based movement | 44/3918 | 127/18723 | 2.31e-04 | 2.99e-03 | 44 |
| GO:0099515 | Colorectum | AD | actin filament-based transport | 12/3918 | 21/18723 | 3.02e-04 | 3.62e-03 | 12 |
| Pathway ID | Tissue | Disease Stage | Description | Gene Ratio | Bg Ratio | pvalue | p.adjust | qvalue | Count |
| hsa0513020 | Cervix | CC | Pathogenic Escherichia coli infection | 63/1267 | 197/8465 | 9.28e-10 | 2.00e-08 | 1.19e-08 | 63 |
| hsa05130110 | Cervix | CC | Pathogenic Escherichia coli infection | 63/1267 | 197/8465 | 9.28e-10 | 2.00e-08 | 1.19e-08 | 63 |
| hsa05130 | Colorectum | AD | Pathogenic Escherichia coli infection | 79/2092 | 197/8465 | 1.05e-06 | 1.36e-05 | 8.65e-06 | 79 |
| hsa051301 | Colorectum | AD | Pathogenic Escherichia coli infection | 79/2092 | 197/8465 | 1.05e-06 | 1.36e-05 | 8.65e-06 | 79 |
| hsa051302 | Colorectum | SER | Pathogenic Escherichia coli infection | 60/1580 | 197/8465 | 3.63e-05 | 4.31e-04 | 3.13e-04 | 60 |
| hsa051303 | Colorectum | SER | Pathogenic Escherichia coli infection | 60/1580 | 197/8465 | 3.63e-05 | 4.31e-04 | 3.13e-04 | 60 |
| hsa051304 | Colorectum | MSS | Pathogenic Escherichia coli infection | 73/1875 | 197/8465 | 1.10e-06 | 1.48e-05 | 9.06e-06 | 73 |
| hsa051305 | Colorectum | MSS | Pathogenic Escherichia coli infection | 73/1875 | 197/8465 | 1.10e-06 | 1.48e-05 | 9.06e-06 | 73 |
| hsa051308 | Colorectum | FAP | Pathogenic Escherichia coli infection | 62/1404 | 197/8465 | 1.37e-07 | 3.08e-06 | 1.87e-06 | 62 |
| hsa051309 | Colorectum | FAP | Pathogenic Escherichia coli infection | 62/1404 | 197/8465 | 1.37e-07 | 3.08e-06 | 1.87e-06 | 62 |
| hsa0513010 | Colorectum | CRC | Pathogenic Escherichia coli infection | 47/1091 | 197/8465 | 1.49e-05 | 3.84e-04 | 2.60e-04 | 47 |
| hsa0513011 | Colorectum | CRC | Pathogenic Escherichia coli infection | 47/1091 | 197/8465 | 1.49e-05 | 3.84e-04 | 2.60e-04 | 47 |
| hsa05130211 | Esophagus | ESCC | Pathogenic Escherichia coli infection | 142/4205 | 197/8465 | 8.21e-11 | 1.06e-09 | 5.42e-10 | 142 |
| hsa05130310 | Esophagus | ESCC | Pathogenic Escherichia coli infection | 142/4205 | 197/8465 | 8.21e-11 | 1.06e-09 | 5.42e-10 | 142 |
| hsa0513014 | Liver | NAFLD | Pathogenic Escherichia coli infection | 45/1043 | 197/8465 | 2.31e-05 | 6.88e-04 | 5.54e-04 | 45 |
| hsa0513015 | Liver | NAFLD | Pathogenic Escherichia coli infection | 45/1043 | 197/8465 | 2.31e-05 | 6.88e-04 | 5.54e-04 | 45 |
| hsa0513022 | Liver | Cirrhotic | Pathogenic Escherichia coli infection | 88/2530 | 197/8465 | 6.48e-06 | 6.24e-05 | 3.84e-05 | 88 |
| hsa0513032 | Liver | Cirrhotic | Pathogenic Escherichia coli infection | 88/2530 | 197/8465 | 6.48e-06 | 6.24e-05 | 3.84e-05 | 88 |
| hsa0513042 | Liver | HCC | Pathogenic Escherichia coli infection | 129/4020 | 197/8465 | 2.02e-07 | 2.50e-06 | 1.39e-06 | 129 |
| hsa0513052 | Liver | HCC | Pathogenic Escherichia coli infection | 129/4020 | 197/8465 | 2.02e-07 | 2.50e-06 | 1.39e-06 | 129 |
| Hugo Symbol | Variant Class | Variant Classification | dbSNP RS | HGVSc | HGVSp | HGVSp Short | SWISSPROT | BIOTYPE | SIFT | PolyPhen | Tumor Sample Barcode | Tissue | Histology | Sex | Age | Stage | Therapy Types | Drugs | Outcome |
| MYO1B | SNV | Missense_Mutation | novel | c.2324N>C | p.His775Pro | p.H775P | O43795 | protein_coding | tolerated(0.08) | benign(0.445) | TCGA-A8-A07R-01 | Breast | breast invasive carcinoma | Female | >=65 | III/IV | Ancillary | zoledronic | SD |
| MYO1B | SNV | Missense_Mutation | | c.1406N>A | p.Thr469Lys | p.T469K | O43795 | protein_coding | tolerated(0.92) | benign(0.001) | TCGA-A8-A09A-01 | Breast | breast invasive carcinoma | Female | <65 | I/II | Hormone Therapy | tamoxiphen | SD |
| MYO1B | SNV | Missense_Mutation | | c.2089N>A | p.Glu697Lys | p.E697K | O43795 | protein_coding | deleterious(0) | probably_damaging(0.967) | TCGA-A8-A09G-01 | Breast | breast invasive carcinoma | Female | >=65 | III/IV | Unknown | Unknown | SD |
| MYO1B | SNV | Missense_Mutation | | c.623T>G | p.Phe208Cys | p.F208C | O43795 | protein_coding | deleterious(0) | probably_damaging(1) | TCGA-BH-A0BL-01 | Breast | breast invasive carcinoma | Female | <65 | I/II | Chemotherapy | adriamycin | CR |
| MYO1B | SNV | Missense_Mutation | | c.1750A>G | p.Asn584Asp | p.N584D | O43795 | protein_coding | tolerated(0.06) | possibly_damaging(0.718) | TCGA-BH-A18G-01 | Breast | breast invasive carcinoma | Female | >=65 | I/II | Unknown | Unknown | SD |
| MYO1B | insertion | Nonsense_Mutation | novel | c.2325_2326insTTCAGAGGGTAGACGCTGGGTCCCGAGTC | p.Gln776PhefsTer4 | p.Q776Ffs*4 | O43795 | protein_coding | | | TCGA-A8-A07R-01 | Breast | breast invasive carcinoma | Female | >=65 | III/IV | Ancillary | zoledronic | SD |
| MYO1B | insertion | In_Frame_Ins | novel | c.802_803insTCTACTTTTGTATATGTTTGACAACAATAACAAAAACTTACATTA | p.Ala268delinsValTyrPheCysIleCysLeuThrThrIleThrLysThrTyrIleThr | p.A268delinsVYFCICLTTITKTYIT | O43795 | protein_coding | | | TCGA-B6-A0IA-01 | Breast | breast invasive carcinoma | Female | <65 | I/II | Unknown | Unknown | SD |
| MYO1B | SNV | Missense_Mutation | | c.1288N>A | p.Glu430Lys | p.E430K | O43795 | protein_coding | deleterious(0) | probably_damaging(0.99) | TCGA-JX-A3Q0-01 | Cervix | cervical & endocervical cancer | Female | <65 | III/IV | Unknown | Unknown | SD |
| MYO1B | SNV | Missense_Mutation | | c.1963N>A | p.His655Asn | p.H655N | O43795 | protein_coding | tolerated(0.28) | benign(0.01) | TCGA-MU-A51Y-01 | Cervix | cervical & endocervical cancer | Female | <65 | I/II | Unknown | Unknown | SD |
| MYO1B | SNV | Missense_Mutation | novel | c.2216N>T | p.Arg739Met | p.R739M | O43795 | protein_coding | deleterious(0) | probably_damaging(0.95) | TCGA-VS-A9U6-01 | Cervix | cervical & endocervical cancer | Female | <65 | I/II | Chemotherapy | cisplatin | PD |


