
|
|||||
|
 | |
| |
| |
| |
| |
| |
|
Gene: MYO15B |
Gene summary for MYO15B |
| Gene information | Species | Human | Gene symbol | MYO15B | Gene ID | 80022 |
| Gene name | myosin XVB | |
| Gene Alias | MYO15BP | |
| Cytomap | 17q25.1 | |
| Gene Type | protein-coding | GO ID | NA | UniProtAcc | Q96JP2 |
Top |
Malignant transformation analysis |
| Identification of the aberrant gene expression in precancerous and cancerous lesions by comparing the gene expression of stem-like cells in diseased tissues with normal stem cells |
| Entrez ID | Symbol | Replicates | Species | Organ | Tissue | Adj P-value | Log2FC | Malignancy |
| 80022 | MYO15B | HTA11_2487_2000001011 | Human | Colorectum | SER | 3.06e-07 | 5.66e-01 | -0.1808 |
| 80022 | MYO15B | HTA11_696_2000001011 | Human | Colorectum | AD | 2.94e-03 | 1.03e-01 | -0.1464 |
| 80022 | MYO15B | HTA11_866_2000001011 | Human | Colorectum | AD | 1.03e-07 | 2.44e-01 | -0.1001 |
| 80022 | MYO15B | HTA11_866_3004761011 | Human | Colorectum | AD | 1.05e-03 | 2.38e-01 | 0.096 |
| 80022 | MYO15B | HTA11_7696_3000711011 | Human | Colorectum | AD | 3.43e-04 | 1.80e-01 | 0.0674 |
| 80022 | MYO15B | HTA11_6818_2000001011 | Human | Colorectum | AD | 2.34e-03 | 2.77e-01 | 0.0112 |
| 80022 | MYO15B | HTA11_99999970781_79442 | Human | Colorectum | MSS | 1.78e-03 | 1.24e-01 | 0.294 |
| 80022 | MYO15B | HTA11_99999971662_82457 | Human | Colorectum | MSS | 4.92e-03 | 2.12e-01 | 0.3859 |
| 80022 | MYO15B | HTA11_99999973899_84307 | Human | Colorectum | MSS | 5.35e-03 | 3.39e-01 | 0.2585 |
| 80022 | MYO15B | HTA11_99999974143_84620 | Human | Colorectum | MSS | 1.22e-06 | 2.00e-01 | 0.3005 |
| 80022 | MYO15B | A002-C-021 | Human | Colorectum | FAP | 5.43e-03 | 1.98e-01 | 0.1171 |
| 80022 | MYO15B | HCC2 | Human | Liver | HCC | 6.35e-05 | 1.57e+00 | 0.5341 |
| 80022 | MYO15B | S027 | Human | Liver | HCC | 3.62e-11 | 9.53e-01 | 0.2446 |
| 80022 | MYO15B | S028 | Human | Liver | HCC | 1.81e-27 | 9.32e-01 | 0.2503 |
| 80022 | MYO15B | S029 | Human | Liver | HCC | 4.41e-23 | 9.15e-01 | 0.2581 |
| 80022 | MYO15B | Pat01-B | Human | Stomach | GC | 6.71e-56 | 9.77e-01 | 0.5754 |
| 80022 | MYO15B | Pat02-B | Human | Stomach | GC | 1.24e-15 | 3.22e-01 | 0.0368 |
| 80022 | MYO15B | Pat03-B | Human | Stomach | GC | 7.68e-36 | 7.83e-01 | 0.3693 |
| 80022 | MYO15B | Pat06-B | Human | Stomach | GC | 2.41e-07 | 1.15e-01 | -0.1961 |
| 80022 | MYO15B | Pat12-B | Human | Stomach | GC | 8.70e-15 | 3.70e-01 | 0.0325 |
| Page: 1 2 |
| Tissue | Expression Dynamics | Abbreviation |
| Colorectum (GSE201348) |  | FAP: Familial adenomatous polyposis |
| CRC: Colorectal cancer | ||
| Colorectum (HTA11) |  | AD: Adenomas |
| SER: Sessile serrated lesions | ||
| MSI-H: Microsatellite-high colorectal cancer | ||
| MSS: Microsatellite stable colorectal cancer | ||
| GC |  | CAG: Chronic atrophic gastritis |
| CAG with IM: Chronic atrophic gastritis with intestinal metaplasia | ||
| CSG: Chronic superficial gastritis | ||
| GC: Gastric cancer | ||
| SIM: Severe intestinal metaplasia | ||
| WIM: Wild intestinal metaplasia | ||
| Liver | 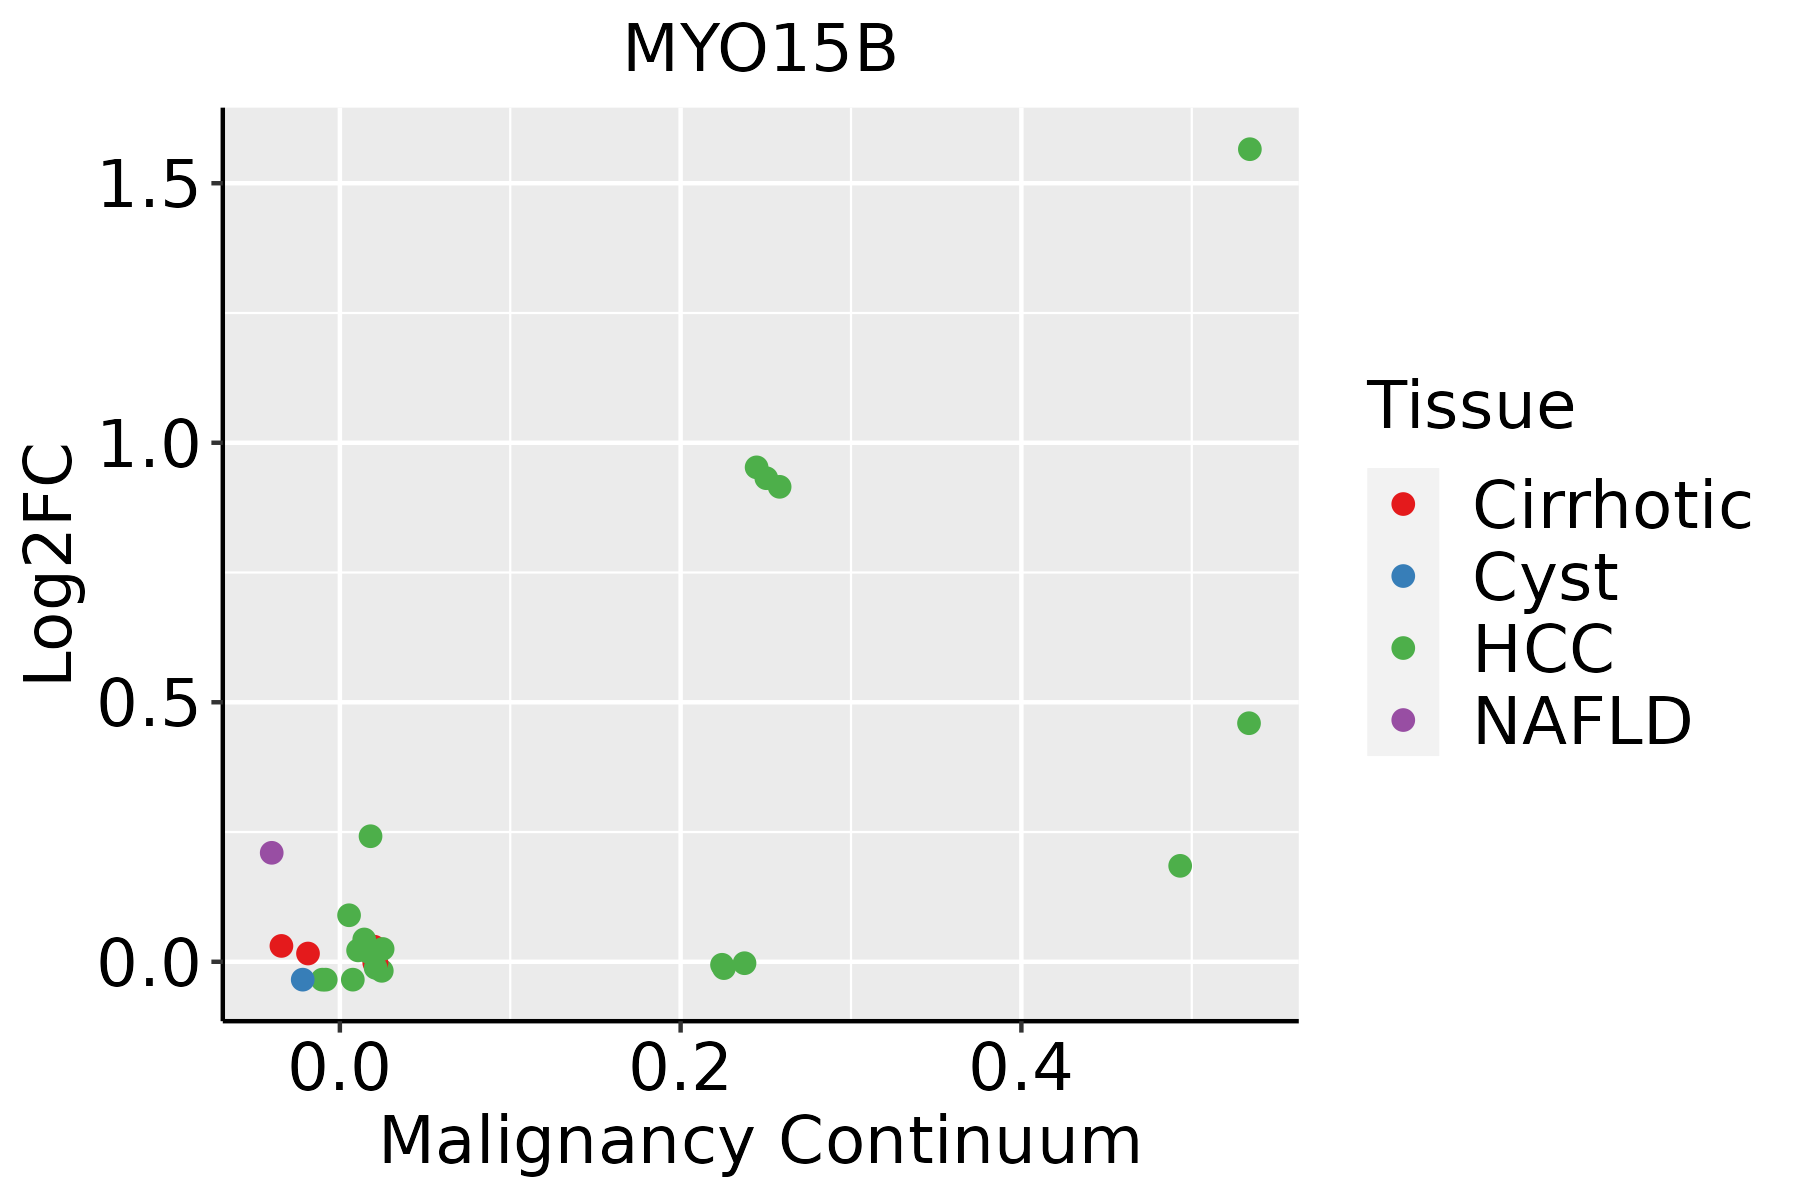 | HCC: Hepatocellular carcinoma |
| NAFLD: Non-alcoholic fatty liver disease |
| ∗log2FC in expression of this searched gene in stem-like cells from each diseased tissue sample relative to stem-like cells in normal samples in each tissue plotted against the malignancy continuum. Samples are colored based on if they are from different disease stage. |
Top |
Malignant transformation related pathway analysis |
| Find out the enriched GO biological processes and KEGG pathways involved in transition from healthy to precancer to cancer |
| Tissue | Disease Stage | Enriched GO biological Processes |
| Colorectum | AD |  |
| Colorectum | SER |  |
| Colorectum | MSS |  |
| Colorectum | MSI-H |  |
| Colorectum | FAP |  |
| ∗Top 15 enriched GO BP terms are showed in the bar plot of each disease state in each tissue. Each row represents a significant GO biological process which is colored according to the -log10(p.adjust). |
| Page: 1 2 3 4 5 6 7 8 9 |
| GO ID | Tissue | Disease Stage | Description | Gene Ratio | Bg Ratio | pvalue | p.adjust | Count |
| Page: 1 |
| Pathway ID | Tissue | Disease Stage | Description | Gene Ratio | Bg Ratio | pvalue | p.adjust | qvalue | Count |
| Page: 1 |
Top |
Cell-cell communication analysis |
| Identification of potential cell-cell interactions between two cell types and their ligand-receptor pairs for different disease states |
| Ligand | Receptor | LRpair | Pathway | Tissue | Disease Stage |
| Page: 1 |
Top |
Single-cell gene regulatory network inference analysis |
| Find out the significant the regulons (TFs) and the target genes of each regulon across cell types for different disease states |
| TF | Cell Type | Tissue | Disease Stage | Target Gene | RSS | Regulon Activity |
| ∗The dot plots of a searched regulon are shown for all cell subpopulations in each disease state of each tissue based on the regulon specific score inferred using pySCENIC and by calculating the average expression. |
| Page: 1 |
Top |
Somatic mutation of malignant transformation related genes |
| Annotation of somatic variants for genes involved in malignant transformation |
| Hugo Symbol | Variant Class | Variant Classification | dbSNP RS | HGVSc | HGVSp | HGVSp Short | SWISSPROT | BIOTYPE | SIFT | PolyPhen | Tumor Sample Barcode | Tissue | Histology | Sex | Age | Stage | Therapy Types | Drugs | Outcome |
| MYO15B | SNV | Missense_Mutation | novel | c.4406N>T | p.Arg1469Leu | p.R1469L | protein_coding | tolerated(0.53) | benign(0.129) | TCGA-5T-A9QA-01 | Breast | breast invasive carcinoma | Female | <65 | I/II | Chemotherapy | taxol | SD | |
| MYO15B | SNV | Missense_Mutation | novel | c.3919N>A | p.Val1307Ile | p.V1307I | protein_coding | tolerated(1) | benign(0.003) | TCGA-A7-A3J0-01 | Breast | breast invasive carcinoma | Female | <65 | I/II | Hormone Therapy | anastrazole | SD | |
| MYO15B | SNV | Missense_Mutation | rs141546083 | c.8839G>A | p.Ala2947Thr | p.A2947T | protein_coding | possibly_damaging(0.691) | TCGA-E9-A6HE-01 | Breast | breast invasive carcinoma | Female | <65 | III/IV | Chemotherapy | adriamycin | CR | ||
| MYO15B | SNV | Missense_Mutation | novel | c.4490N>A | p.Cys1497Tyr | p.C1497Y | protein_coding | deleterious(0.03) | possibly_damaging(0.715) | TCGA-GM-A3XL-01 | Breast | breast invasive carcinoma | Female | <65 | I/II | Chemotherapy | fluorouracil | CR | |
| MYO15B | SNV | Missense_Mutation | novel | c.6139N>G | p.Arg2047Gly | p.R2047G | protein_coding | tolerated(0.25) | benign(0.001) | TCGA-2W-A8YY-01 | Cervix | cervical & endocervical cancer | Female | <65 | I/II | Chemotherapy | cisplatin | CR | |
| MYO15B | SNV | Missense_Mutation | novel | c.7017N>T | p.Lys2339Asn | p.K2339N | protein_coding | deleterious(0) | probably_damaging(0.982) | TCGA-2W-A8YY-01 | Cervix | cervical & endocervical cancer | Female | <65 | I/II | Chemotherapy | cisplatin | CR | |
| MYO15B | SNV | Missense_Mutation | novel | c.4118N>A | p.Arg1373His | p.R1373H | protein_coding | deleterious(0.02) | probably_damaging(0.993) | TCGA-DG-A2KJ-01 | Cervix | cervical & endocervical cancer | Female | <65 | III/IV | Chemotherapy | cisplatin | SD | |
| MYO15B | SNV | Missense_Mutation | novel | c.593C>T | p.Pro198Leu | p.P198L | protein_coding | tolerated_low_confidence(0.23) | unknown(0) | TCGA-EK-A3GK-01 | Cervix | cervical & endocervical cancer | Female | <65 | I/II | Unknown | Unknown | SD | |
| MYO15B | SNV | Missense_Mutation | c.8479N>A | p.Asp2827Asn | p.D2827N | protein_coding | tolerated(0.12) | probably_damaging(0.97) | TCGA-FU-A3HZ-01 | Cervix | cervical & endocervical cancer | Female | <65 | I/II | Chemotherapy | cisplatin | CR | ||
| MYO15B | SNV | Missense_Mutation | rs763965624 | c.8566G>A | p.Ala2856Thr | p.A2856T | protein_coding | tolerated(0.27) | benign(0.007) | TCGA-IR-A3LB-01 | Cervix | cervical & endocervical cancer | Female | <65 | I/II | Chemotherapy | cisplatin | PD |
| Page: 1 2 3 4 5 6 7 8 |
Top |
Related drugs of malignant transformation related genes |
| Identification of chemicals and drugs interact with genes involved in malignant transfromation |
| (DGIdb 4.0) |
| Entrez ID | Symbol | Category | Interaction Types | Drug Claim Name | Drug Name | PMIDs |
| Page: 1 |

Copyright 2023-Present -The University of Texas Health Science Center at Houston |