
|
|||||
|
 | |
| |
| |
| |
| |
| |
|
Gene: MYNN |
Gene summary for MYNN |
| Gene information | Species | Human | Gene symbol | MYNN | Gene ID | 55892 |
| Gene name | myoneurin | |
| Gene Alias | OSZF | |
| Cytomap | 3q26.2 | |
| Gene Type | protein-coding | GO ID | GO:0006139 | UniProtAcc | Q9NPC7 |
Top |
Malignant transformation analysis |
| Identification of the aberrant gene expression in precancerous and cancerous lesions by comparing the gene expression of stem-like cells in diseased tissues with normal stem cells |
| Entrez ID | Symbol | Replicates | Species | Organ | Tissue | Adj P-value | Log2FC | Malignancy |
| 55892 | MYNN | LZE2T | Human | Esophagus | ESCC | 2.96e-02 | 5.11e-01 | 0.082 |
| 55892 | MYNN | LZE4T | Human | Esophagus | ESCC | 1.26e-17 | 4.74e-01 | 0.0811 |
| 55892 | MYNN | LZE5T | Human | Esophagus | ESCC | 1.40e-04 | 2.22e-01 | 0.0514 |
| 55892 | MYNN | LZE7T | Human | Esophagus | ESCC | 4.59e-09 | 5.45e-01 | 0.0667 |
| 55892 | MYNN | LZE8T | Human | Esophagus | ESCC | 2.80e-07 | 3.57e-01 | 0.067 |
| 55892 | MYNN | LZE22D1 | Human | Esophagus | HGIN | 1.92e-02 | 5.98e-02 | 0.0595 |
| 55892 | MYNN | LZE24T | Human | Esophagus | ESCC | 8.67e-21 | 6.24e-01 | 0.0596 |
| 55892 | MYNN | LZE21T | Human | Esophagus | ESCC | 1.18e-02 | 4.62e-01 | 0.0655 |
| 55892 | MYNN | LZE6T | Human | Esophagus | ESCC | 9.60e-05 | 1.99e-01 | 0.0845 |
| 55892 | MYNN | P1T-E | Human | Esophagus | ESCC | 8.34e-06 | 4.29e-01 | 0.0875 |
| 55892 | MYNN | P2T-E | Human | Esophagus | ESCC | 1.52e-59 | 1.31e+00 | 0.1177 |
| 55892 | MYNN | P4T-E | Human | Esophagus | ESCC | 2.10e-24 | 6.49e-01 | 0.1323 |
| 55892 | MYNN | P5T-E | Human | Esophagus | ESCC | 1.26e-17 | 3.82e-01 | 0.1327 |
| 55892 | MYNN | P8T-E | Human | Esophagus | ESCC | 4.03e-23 | 3.99e-01 | 0.0889 |
| 55892 | MYNN | P9T-E | Human | Esophagus | ESCC | 2.66e-15 | 2.95e-01 | 0.1131 |
| 55892 | MYNN | P10T-E | Human | Esophagus | ESCC | 4.53e-36 | 6.55e-01 | 0.116 |
| 55892 | MYNN | P11T-E | Human | Esophagus | ESCC | 2.32e-18 | 7.71e-01 | 0.1426 |
| 55892 | MYNN | P12T-E | Human | Esophagus | ESCC | 7.11e-23 | 5.11e-01 | 0.1122 |
| 55892 | MYNN | P15T-E | Human | Esophagus | ESCC | 2.04e-27 | 5.65e-01 | 0.1149 |
| 55892 | MYNN | P16T-E | Human | Esophagus | ESCC | 1.85e-30 | 5.99e-01 | 0.1153 |
| Page: 1 2 3 4 5 |
| Tissue | Expression Dynamics | Abbreviation |
| Esophagus | 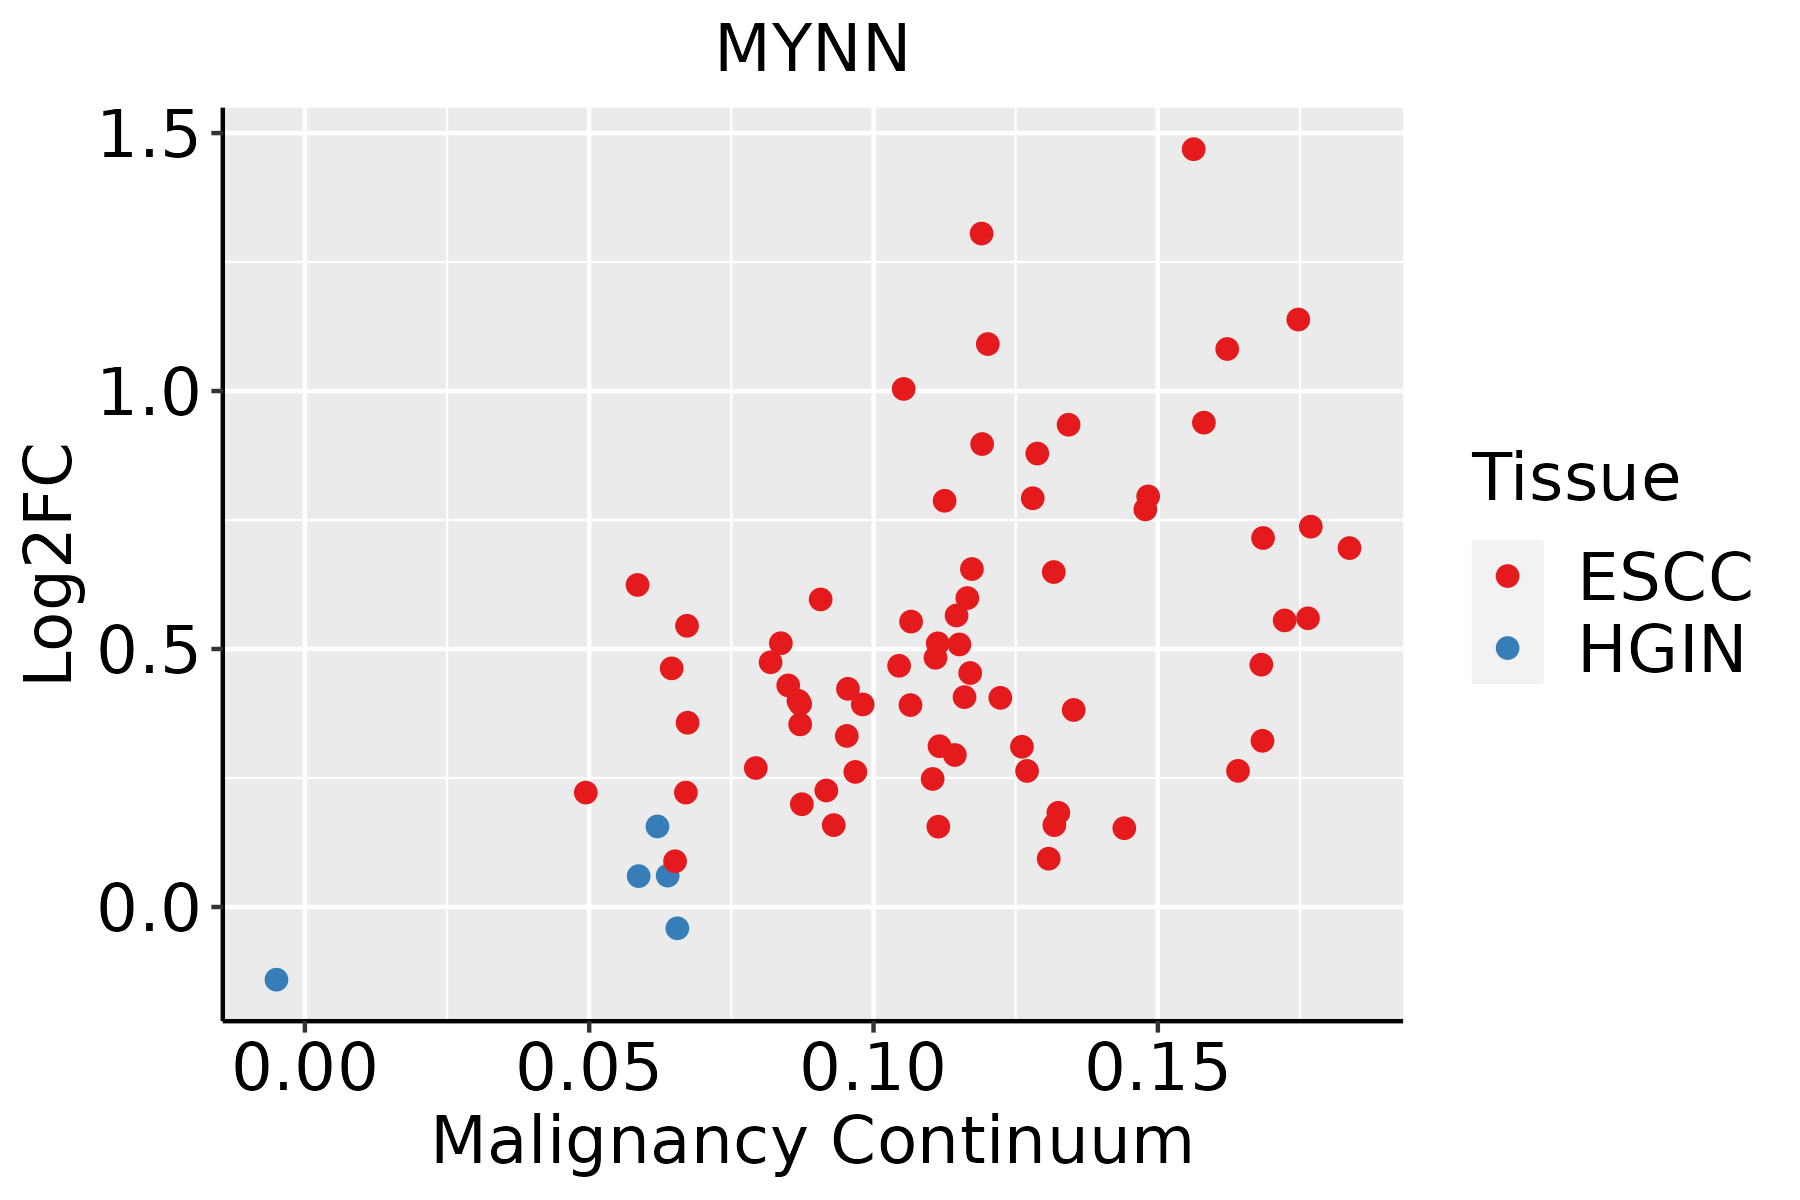 | ESCC: Esophageal squamous cell carcinoma |
| HGIN: High-grade intraepithelial neoplasias | ||
| LGIN: Low-grade intraepithelial neoplasias | ||
| Liver |  | HCC: Hepatocellular carcinoma |
| NAFLD: Non-alcoholic fatty liver disease | ||
| Oral Cavity |  | EOLP: Erosive Oral lichen planus |
| LP: leukoplakia | ||
| NEOLP: Non-erosive oral lichen planus | ||
| OSCC: Oral squamous cell carcinoma |
| ∗log2FC in expression of this searched gene in stem-like cells from each diseased tissue sample relative to stem-like cells in normal samples in each tissue plotted against the malignancy continuum. Samples are colored based on if they are from different disease stage. |
Top |
Malignant transformation related pathway analysis |
| Find out the enriched GO biological processes and KEGG pathways involved in transition from healthy to precancer to cancer |
| Tissue | Disease Stage | Enriched GO biological Processes |
| Colorectum | AD |  |
| Colorectum | SER |  |
| Colorectum | MSS |  |
| Colorectum | MSI-H |  |
| Colorectum | FAP |  |
| ∗Top 15 enriched GO BP terms are showed in the bar plot of each disease state in each tissue. Each row represents a significant GO biological process which is colored according to the -log10(p.adjust). |
| Page: 1 2 3 4 5 6 7 8 9 |
| GO ID | Tissue | Disease Stage | Description | Gene Ratio | Bg Ratio | pvalue | p.adjust | Count |
| GO:19908308 | Esophagus | HGIN | cellular response to leukemia inhibitory factor | 23/2587 | 94/18723 | 3.92e-03 | 3.54e-02 | 23 |
| GO:19908238 | Esophagus | HGIN | response to leukemia inhibitory factor | 23/2587 | 95/18723 | 4.51e-03 | 3.93e-02 | 23 |
| GO:199082316 | Esophagus | ESCC | response to leukemia inhibitory factor | 60/8552 | 95/18723 | 4.41e-04 | 2.48e-03 | 60 |
| GO:199083015 | Esophagus | ESCC | cellular response to leukemia inhibitory factor | 59/8552 | 94/18723 | 6.19e-04 | 3.32e-03 | 59 |
| GO:19908237 | Oral cavity | OSCC | response to leukemia inhibitory factor | 58/7305 | 95/18723 | 1.10e-05 | 1.14e-04 | 58 |
| GO:19908307 | Oral cavity | OSCC | cellular response to leukemia inhibitory factor | 57/7305 | 94/18723 | 1.75e-05 | 1.71e-04 | 57 |
| Page: 1 |
| Pathway ID | Tissue | Disease Stage | Description | Gene Ratio | Bg Ratio | pvalue | p.adjust | qvalue | Count |
| Page: 1 |
Top |
Cell-cell communication analysis |
| Identification of potential cell-cell interactions between two cell types and their ligand-receptor pairs for different disease states |
| Ligand | Receptor | LRpair | Pathway | Tissue | Disease Stage |
| Page: 1 |
Top |
Single-cell gene regulatory network inference analysis |
| Find out the significant the regulons (TFs) and the target genes of each regulon across cell types for different disease states |
| TF | Cell Type | Tissue | Disease Stage | Target Gene | RSS | Regulon Activity |
| ∗The dot plots of a searched regulon are shown for all cell subpopulations in each disease state of each tissue based on the regulon specific score inferred using pySCENIC and by calculating the average expression. |
| Page: 1 |
Top |
Somatic mutation of malignant transformation related genes |
| Annotation of somatic variants for genes involved in malignant transformation |
| Hugo Symbol | Variant Class | Variant Classification | dbSNP RS | HGVSc | HGVSp | HGVSp Short | SWISSPROT | BIOTYPE | SIFT | PolyPhen | Tumor Sample Barcode | Tissue | Histology | Sex | Age | Stage | Therapy Types | Drugs | Outcome |
| MYNN | SNV | Missense_Mutation | novel | c.94G>A | p.Glu32Lys | p.E32K | Q9NPC7 | protein_coding | tolerated(0.15) | benign(0.179) | TCGA-5L-AAT1-01 | Breast | breast invasive carcinoma | Female | <65 | III/IV | Hormone Therapy | letrozol | SD |
| MYNN | SNV | Missense_Mutation | c.190G>T | p.Asp64Tyr | p.D64Y | Q9NPC7 | protein_coding | deleterious(0) | probably_damaging(0.999) | TCGA-A8-A099-01 | Breast | breast invasive carcinoma | Female | >=65 | III/IV | Hormone Therapy | exemestane | SD | |
| MYNN | SNV | Missense_Mutation | c.1453N>C | p.Glu485Gln | p.E485Q | Q9NPC7 | protein_coding | tolerated(0.14) | probably_damaging(0.996) | TCGA-AC-A23H-01 | Breast | breast invasive carcinoma | Female | >=65 | I/II | Unknown | Unknown | PD | |
| MYNN | SNV | Missense_Mutation | c.1324C>T | p.Pro442Ser | p.P442S | Q9NPC7 | protein_coding | deleterious(0) | probably_damaging(0.997) | TCGA-AN-A04D-01 | Breast | breast invasive carcinoma | Female | <65 | I/II | Unknown | Unknown | SD | |
| MYNN | SNV | Missense_Mutation | c.1395N>A | p.His465Gln | p.H465Q | Q9NPC7 | protein_coding | deleterious(0) | probably_damaging(0.992) | TCGA-D8-A1XK-01 | Breast | breast invasive carcinoma | Female | <65 | I/II | Chemotherapy | doxorubicine+cyclophosphamide | SD | |
| MYNN | SNV | Missense_Mutation | novel | c.1614N>C | p.Leu538Phe | p.L538F | Q9NPC7 | protein_coding | tolerated_low_confidence(1) | benign(0.048) | TCGA-PE-A5DE-01 | Breast | breast invasive carcinoma | Female | <65 | I/II | Chemotherapy | taxotere | CR |
| MYNN | insertion | Frame_Shift_Ins | novel | c.541_542insAT | p.Lys181AsnfsTer25 | p.K181Nfs*25 | Q9NPC7 | protein_coding | TCGA-AC-A3QQ-01 | Breast | breast invasive carcinoma | Female | <65 | I/II | Unknown | Unknown | SD | ||
| MYNN | insertion | Frame_Shift_Ins | novel | c.543_544insATTTATA | p.Lys182IlefsTer16 | p.K182Ifs*16 | Q9NPC7 | protein_coding | TCGA-AC-A3QQ-01 | Breast | breast invasive carcinoma | Female | <65 | I/II | Unknown | Unknown | SD | ||
| MYNN | deletion | Frame_Shift_Del | novel | c.1119delN | p.Val374SerfsTer57 | p.V374Sfs*57 | Q9NPC7 | protein_coding | TCGA-D8-A27V-01 | Breast | breast invasive carcinoma | Female | <65 | I/II | Hormone Therapy | tamoxiphen | SD | ||
| MYNN | SNV | Missense_Mutation | novel | c.439N>G | p.Leu147Val | p.L147V | Q9NPC7 | protein_coding | tolerated(0.33) | possibly_damaging(0.899) | TCGA-JX-A3Q0-01 | Cervix | cervical & endocervical cancer | Female | <65 | III/IV | Unknown | Unknown | SD |
| Page: 1 2 3 4 5 6 |
Top |
Related drugs of malignant transformation related genes |
| Identification of chemicals and drugs interact with genes involved in malignant transfromation |
| (DGIdb 4.0) |
| Entrez ID | Symbol | Category | Interaction Types | Drug Claim Name | Drug Name | PMIDs |
| Page: 1 |

Copyright 2023-Present -The University of Texas Health Science Center at Houston |