
|
|||||
|
 | |
| |
| |
| |
| |
| |
|
Gene: MYLK3 |
Gene summary for MYLK3 |
| Gene information | Species | Human | Gene symbol | MYLK3 | Gene ID | 91807 |
| Gene name | myosin light chain kinase 3 | |
| Gene Alias | MLCK | |
| Cytomap | 16q11.2 | |
| Gene Type | protein-coding | GO ID | GO:0002526 | UniProtAcc | Q32MK0 |
Top |
Malignant transformation analysis |
| Identification of the aberrant gene expression in precancerous and cancerous lesions by comparing the gene expression of stem-like cells in diseased tissues with normal stem cells |
| Entrez ID | Symbol | Replicates | Species | Organ | Tissue | Adj P-value | Log2FC | Malignancy |
| 91807 | MYLK3 | HCC1 | Human | Liver | HCC | 3.73e-08 | 7.27e-01 | 0.5336 |
| 91807 | MYLK3 | HCC2 | Human | Liver | HCC | 2.85e-15 | 1.32e+00 | 0.5341 |
| 91807 | MYLK3 | HCC5 | Human | Liver | HCC | 6.59e-16 | 9.50e-01 | 0.4932 |
| Page: 1 |
| Tissue | Expression Dynamics | Abbreviation |
| Liver | 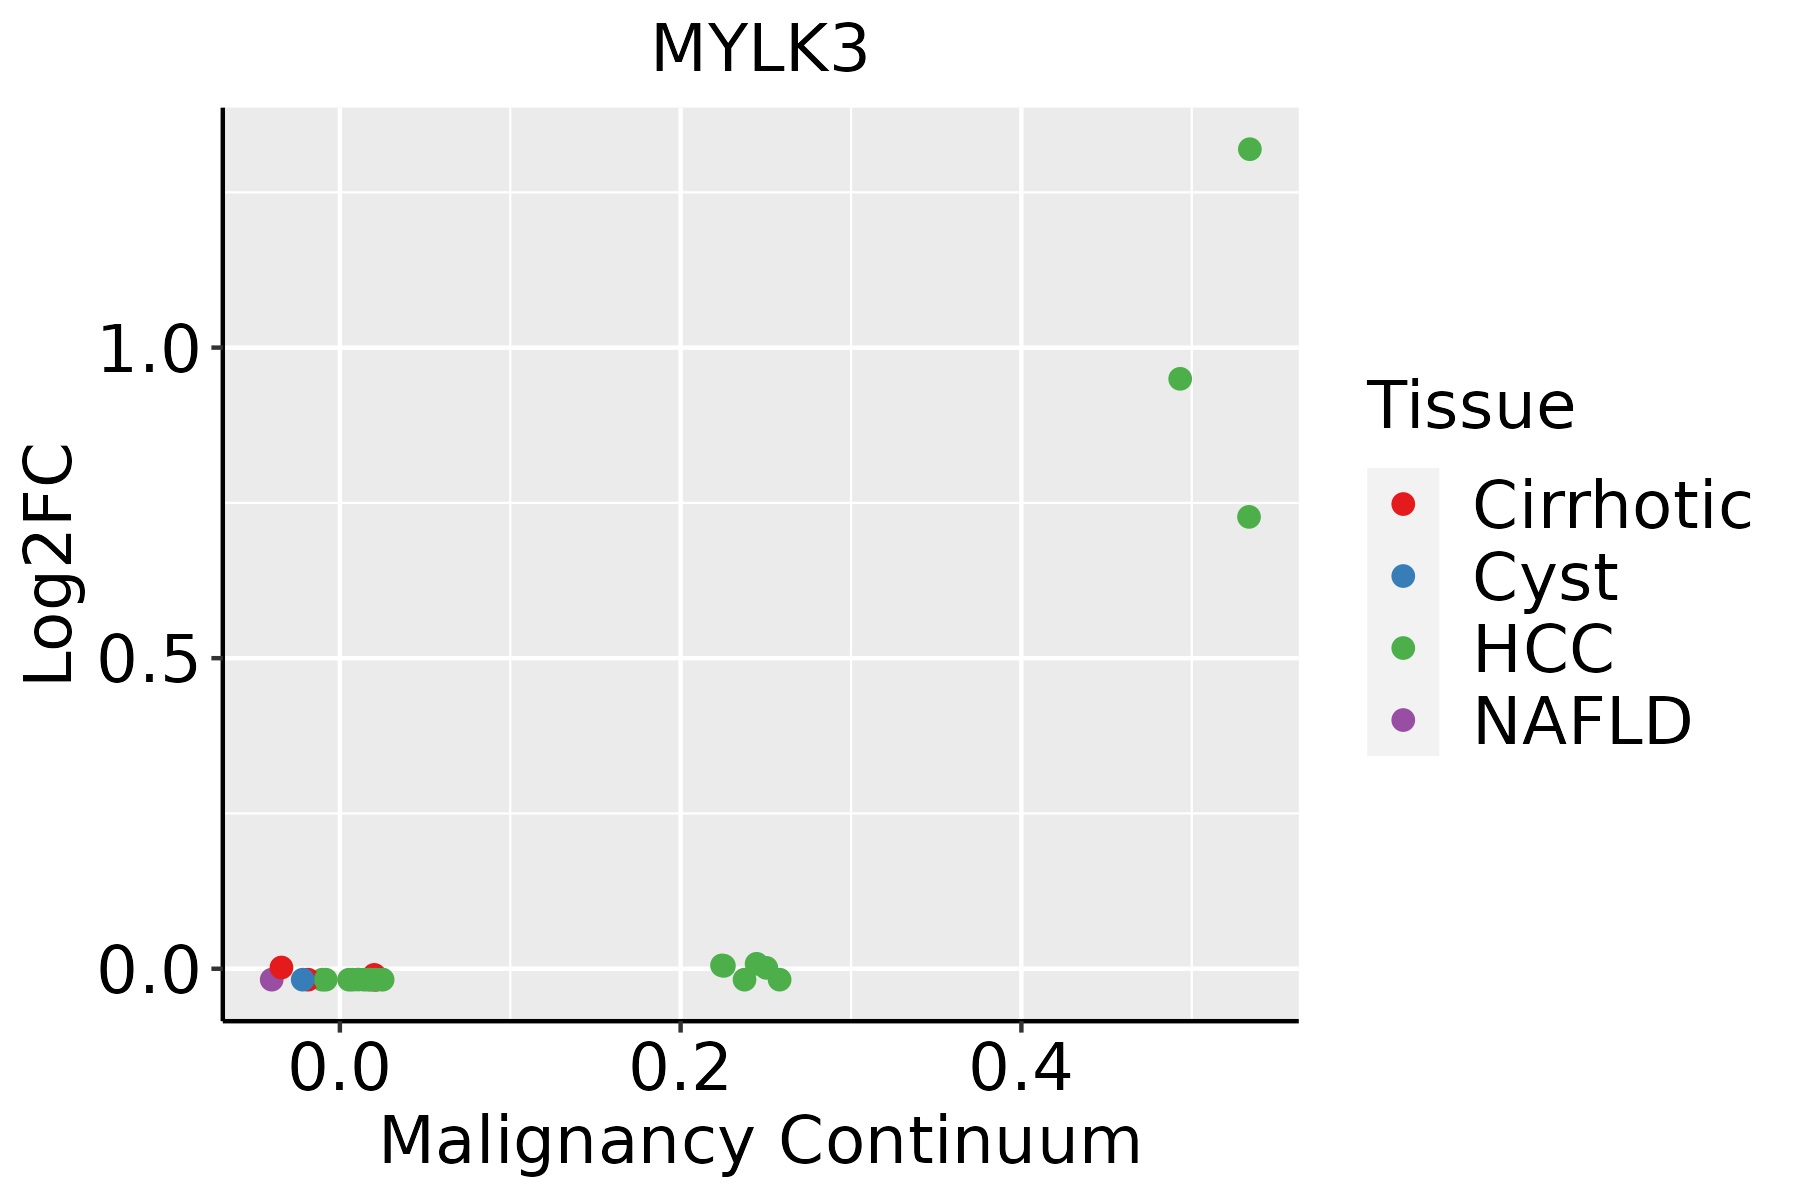 | HCC: Hepatocellular carcinoma |
| NAFLD: Non-alcoholic fatty liver disease |
| ∗log2FC in expression of this searched gene in stem-like cells from each diseased tissue sample relative to stem-like cells in normal samples in each tissue plotted against the malignancy continuum. Samples are colored based on if they are from different disease stage. |
Top |
Malignant transformation related pathway analysis |
| Find out the enriched GO biological processes and KEGG pathways involved in transition from healthy to precancer to cancer |
| Tissue | Disease Stage | Enriched GO biological Processes |
| Colorectum | AD |  |
| Colorectum | SER |  |
| Colorectum | MSS |  |
| Colorectum | MSI-H |  |
| Colorectum | FAP |  |
| ∗Top 15 enriched GO BP terms are showed in the bar plot of each disease state in each tissue. Each row represents a significant GO biological process which is colored according to the -log10(p.adjust). |
| Page: 1 2 3 4 5 6 7 8 9 |
| GO ID | Tissue | Disease Stage | Description | Gene Ratio | Bg Ratio | pvalue | p.adjust | Count |
| GO:190290322 | Liver | HCC | regulation of supramolecular fiber organization | 224/7958 | 383/18723 | 1.54e-10 | 5.33e-09 | 224 |
| GO:190290522 | Liver | HCC | positive regulation of supramolecular fiber organization | 131/7958 | 209/18723 | 2.85e-09 | 7.69e-08 | 131 |
| GO:005149522 | Liver | HCC | positive regulation of cytoskeleton organization | 138/7958 | 226/18723 | 1.26e-08 | 3.12e-07 | 138 |
| GO:003297022 | Liver | HCC | regulation of actin filament-based process | 222/7958 | 397/18723 | 3.81e-08 | 8.30e-07 | 222 |
| GO:003295622 | Liver | HCC | regulation of actin cytoskeleton organization | 202/7958 | 358/18723 | 6.18e-08 | 1.29e-06 | 202 |
| GO:003103222 | Liver | HCC | actomyosin structure organization | 109/7958 | 196/18723 | 1.39e-04 | 1.13e-03 | 109 |
| GO:00705551 | Liver | HCC | response to interleukin-1 | 80/7958 | 143/18723 | 7.95e-04 | 4.77e-03 | 80 |
| GO:00025262 | Liver | HCC | acute inflammatory response | 62/7958 | 112/18723 | 4.06e-03 | 1.77e-02 | 62 |
| GO:00713471 | Liver | HCC | cellular response to interleukin-1 | 61/7958 | 113/18723 | 8.98e-03 | 3.46e-02 | 61 |
| GO:011002022 | Liver | HCC | regulation of actomyosin structure organization | 54/7958 | 100/18723 | 1.33e-02 | 4.76e-02 | 54 |
| Page: 1 |
| Pathway ID | Tissue | Disease Stage | Description | Gene Ratio | Bg Ratio | pvalue | p.adjust | qvalue | Count |
| hsa0451041 | Liver | HCC | Focal adhesion | 125/4020 | 203/8465 | 3.12e-05 | 1.88e-04 | 1.04e-04 | 125 |
| hsa0481041 | Liver | HCC | Regulation of actin cytoskeleton | 134/4020 | 229/8465 | 4.48e-04 | 1.94e-03 | 1.08e-03 | 134 |
| hsa046112 | Liver | HCC | Platelet activation | 71/4020 | 124/8465 | 1.77e-02 | 4.15e-02 | 2.31e-02 | 71 |
| hsa0451051 | Liver | HCC | Focal adhesion | 125/4020 | 203/8465 | 3.12e-05 | 1.88e-04 | 1.04e-04 | 125 |
| hsa0481051 | Liver | HCC | Regulation of actin cytoskeleton | 134/4020 | 229/8465 | 4.48e-04 | 1.94e-03 | 1.08e-03 | 134 |
| hsa0461111 | Liver | HCC | Platelet activation | 71/4020 | 124/8465 | 1.77e-02 | 4.15e-02 | 2.31e-02 | 71 |
| Page: 1 |
Top |
Cell-cell communication analysis |
| Identification of potential cell-cell interactions between two cell types and their ligand-receptor pairs for different disease states |
| Ligand | Receptor | LRpair | Pathway | Tissue | Disease Stage |
| Page: 1 |
Top |
Single-cell gene regulatory network inference analysis |
| Find out the significant the regulons (TFs) and the target genes of each regulon across cell types for different disease states |
| TF | Cell Type | Tissue | Disease Stage | Target Gene | RSS | Regulon Activity |
| ∗The dot plots of a searched regulon are shown for all cell subpopulations in each disease state of each tissue based on the regulon specific score inferred using pySCENIC and by calculating the average expression. |
| Page: 1 |
Top |
Somatic mutation of malignant transformation related genes |
| Annotation of somatic variants for genes involved in malignant transformation |
| Hugo Symbol | Variant Class | Variant Classification | dbSNP RS | HGVSc | HGVSp | HGVSp Short | SWISSPROT | BIOTYPE | SIFT | PolyPhen | Tumor Sample Barcode | Tissue | Histology | Sex | Age | Stage | Therapy Types | Drugs | Outcome |
| MYLK3 | SNV | Missense_Mutation | c.1322N>T | p.Gly441Val | p.G441V | Q32MK0 | protein_coding | tolerated(0.19) | benign(0.03) | TCGA-AQ-A04J-01 | Breast | breast invasive carcinoma | Female | <65 | I/II | Chemotherapy | cytoxan | SD | |
| MYLK3 | insertion | In_Frame_Ins | novel | c.1675_1676insTTGAAACTTTTTTTAGAG | p.Asn559delinsIleGluThrPhePheArgAsp | p.N559delinsIETFFRD | Q32MK0 | protein_coding | TCGA-A8-A09X-01 | Breast | breast invasive carcinoma | Female | <65 | III/IV | Unknown | Unknown | SD | ||
| MYLK3 | SNV | Missense_Mutation | novel | c.488G>A | p.Arg163Gln | p.R163Q | Q32MK0 | protein_coding | tolerated(0.28) | benign(0.003) | TCGA-2W-A8YY-01 | Cervix | cervical & endocervical cancer | Female | <65 | I/II | Chemotherapy | cisplatin | CR |
| MYLK3 | SNV | Missense_Mutation | c.2026C>T | p.Pro676Ser | p.P676S | Q32MK0 | protein_coding | deleterious(0) | probably_damaging(1) | TCGA-C5-A1BK-01 | Cervix | cervical & endocervical cancer | Female | <65 | I/II | Unknown | Unknown | SD | |
| MYLK3 | SNV | Missense_Mutation | c.1184N>C | p.Glu395Ala | p.E395A | Q32MK0 | protein_coding | tolerated(0.24) | benign(0.038) | TCGA-FU-A3HZ-01 | Cervix | cervical & endocervical cancer | Female | <65 | I/II | Chemotherapy | cisplatin | CR | |
| MYLK3 | deletion | Frame_Shift_Del | novel | c.2447_2450delCAAC | p.Pro816LeufsTer17 | p.P816Lfs*17 | Q32MK0 | protein_coding | TCGA-VS-A8EJ-01 | Cervix | cervical & endocervical cancer | Female | <65 | I/II | Chemotherapy | cisplatin | PD | ||
| MYLK3 | SNV | Missense_Mutation | c.728N>A | p.Pro243His | p.P243H | Q32MK0 | protein_coding | deleterious(0.02) | possibly_damaging(0.753) | TCGA-4T-AA8H-01 | Colorectum | colon adenocarcinoma | Female | <65 | I/II | Unknown | Unknown | SD | |
| MYLK3 | SNV | Missense_Mutation | novel | c.1624N>A | p.Ala542Thr | p.A542T | Q32MK0 | protein_coding | deleterious(0) | probably_damaging(0.983) | TCGA-A6-2686-01 | Colorectum | colon adenocarcinoma | Female | >=65 | I/II | Unknown | Unknown | SD |
| MYLK3 | SNV | Missense_Mutation | novel | c.14N>T | p.Ser5Phe | p.S5F | Q32MK0 | protein_coding | deleterious_low_confidence(0.01) | possibly_damaging(0.466) | TCGA-AA-3517-01 | Colorectum | colon adenocarcinoma | Male | <65 | I/II | Chemotherapy | folinic | CR |
| MYLK3 | SNV | Missense_Mutation | novel | c.1388N>T | p.Ala463Val | p.A463V | Q32MK0 | protein_coding | tolerated(0.24) | benign(0.084) | TCGA-AA-3939-01 | Colorectum | colon adenocarcinoma | Male | >=65 | I/II | Unknown | Unknown | SD |
| Page: 1 2 3 4 5 6 7 8 9 |
Top |
Related drugs of malignant transformation related genes |
| Identification of chemicals and drugs interact with genes involved in malignant transfromation |
| (DGIdb 4.0) |
| Entrez ID | Symbol | Category | Interaction Types | Drug Claim Name | Drug Name | PMIDs |
| Page: 1 |

Copyright 2023-Present -The University of Texas Health Science Center at Houston |