| Tissue | Expression Dynamics | Abbreviation |
| Breast | 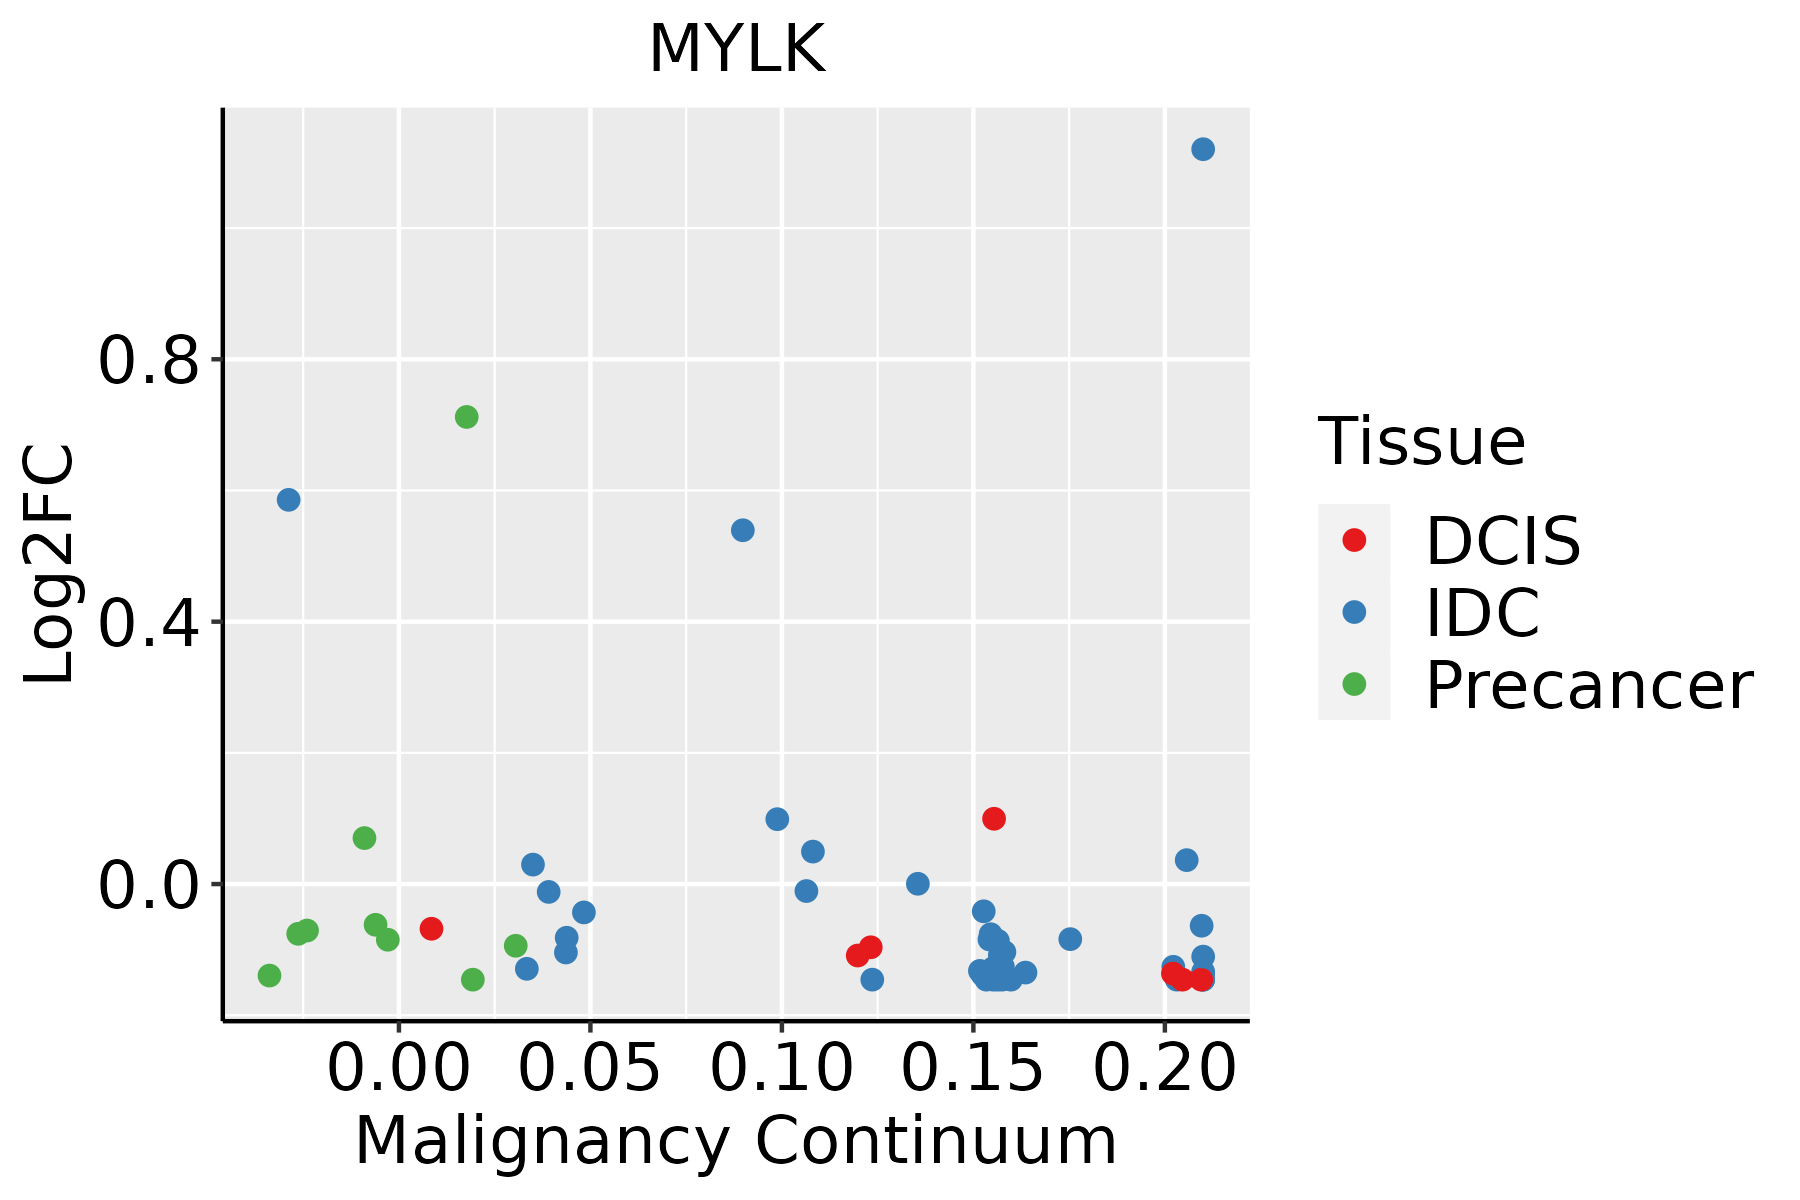 | IDC: Invasive ductal carcinoma |
| DCIS: Ductal carcinoma in situ |
| Precancer(BRCA1-mut): Precancerous lesion from BRCA1 mutation carriers |
| Colorectum (GSE201348) |  | FAP: Familial adenomatous polyposis |
| CRC: Colorectal cancer |
| Colorectum (HTA11) |  | AD: Adenomas |
| SER: Sessile serrated lesions |
| MSI-H: Microsatellite-high colorectal cancer |
| MSS: Microsatellite stable colorectal cancer |
| Esophagus | 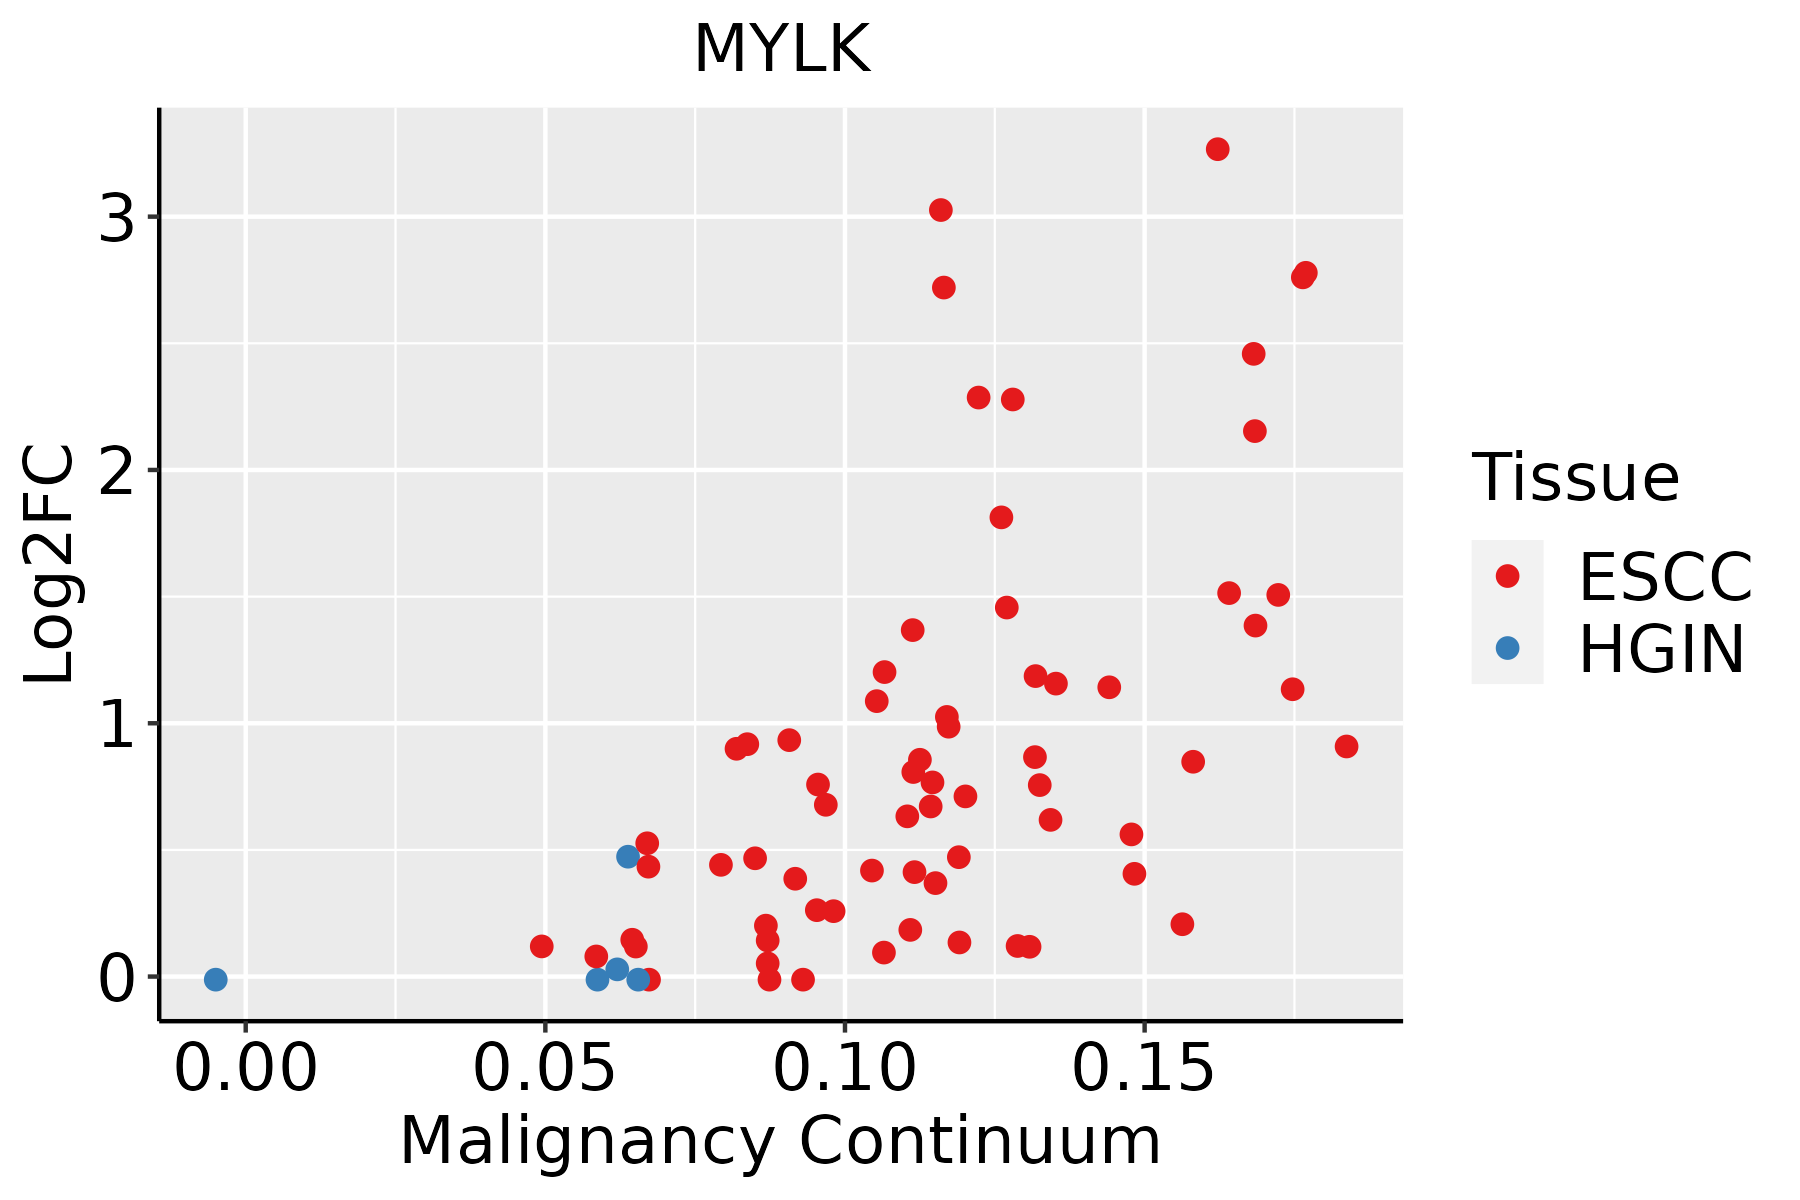 | ESCC: Esophageal squamous cell carcinoma |
| HGIN: High-grade intraepithelial neoplasias |
| LGIN: Low-grade intraepithelial neoplasias |
| Liver | 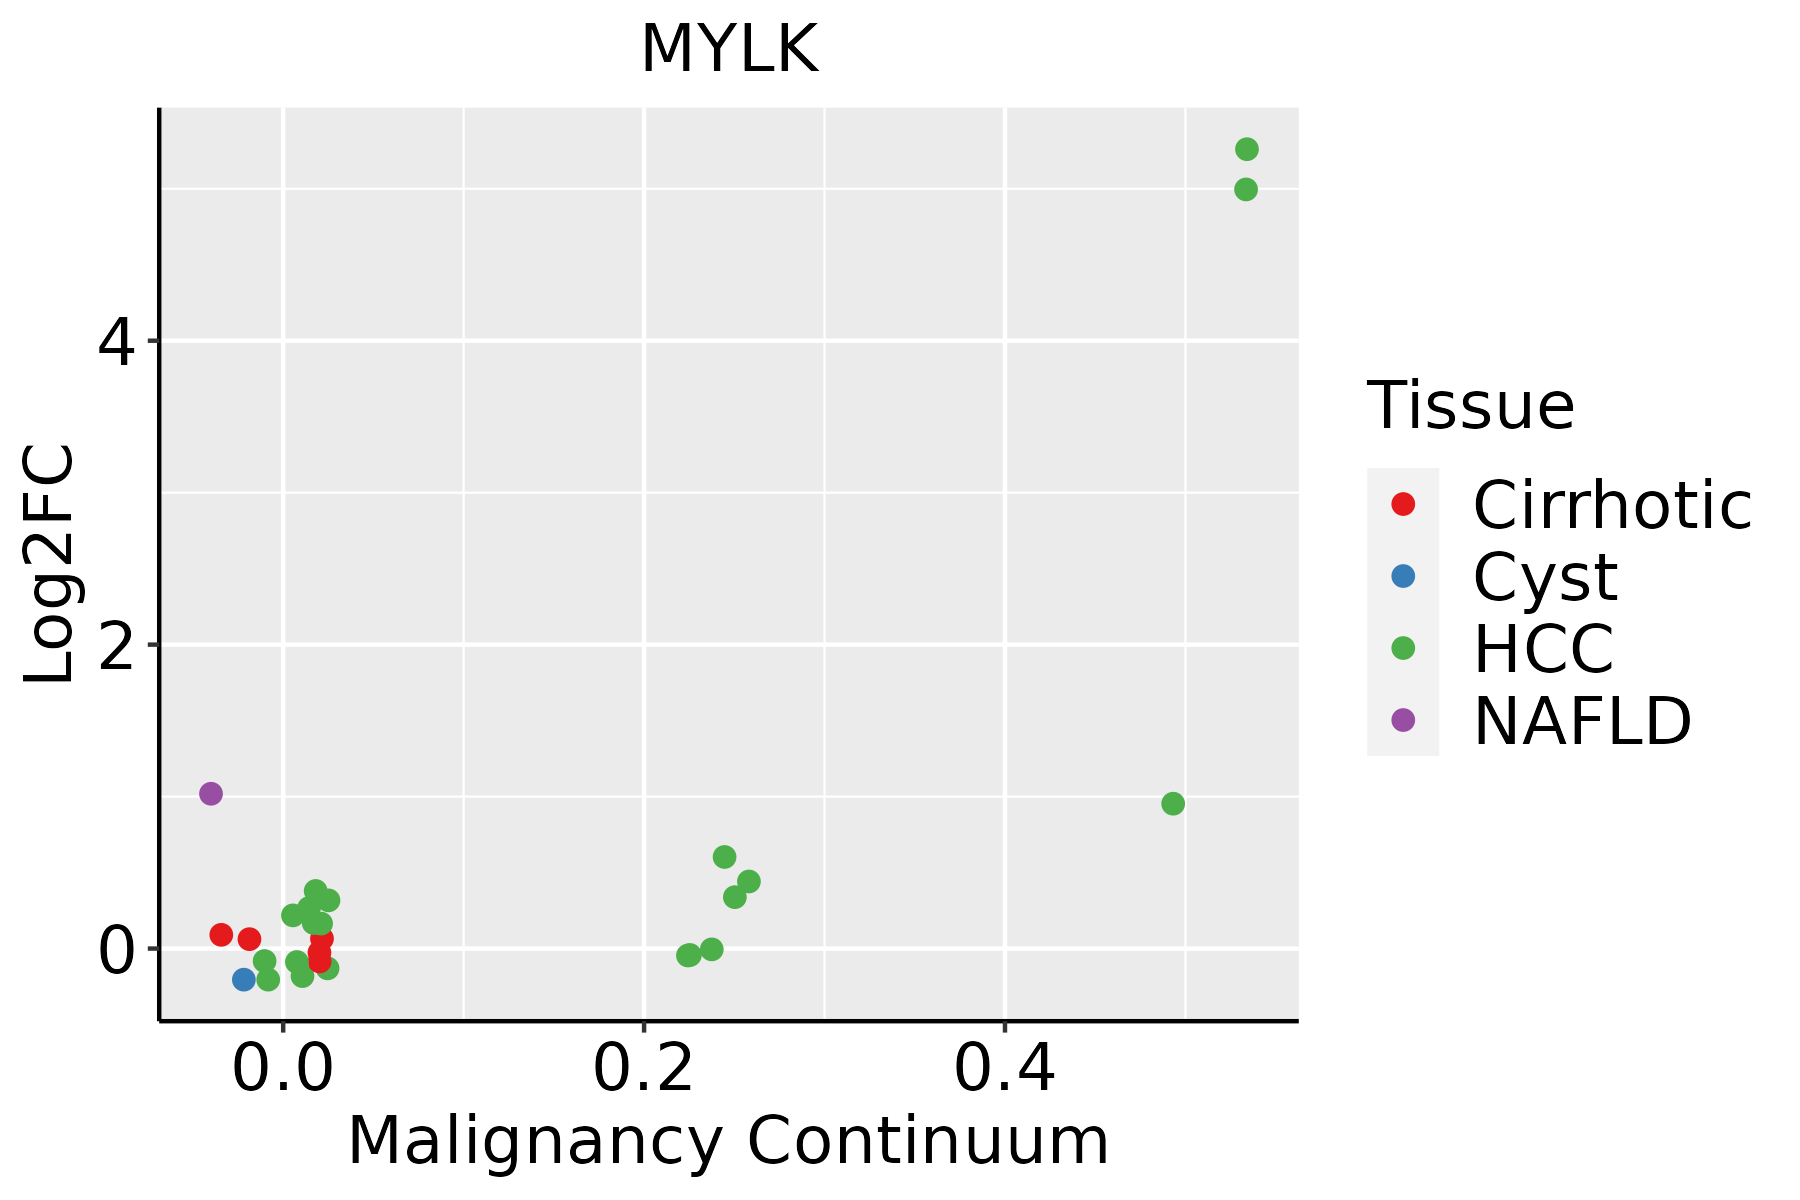 | HCC: Hepatocellular carcinoma |
| NAFLD: Non-alcoholic fatty liver disease |
| Oral Cavity | 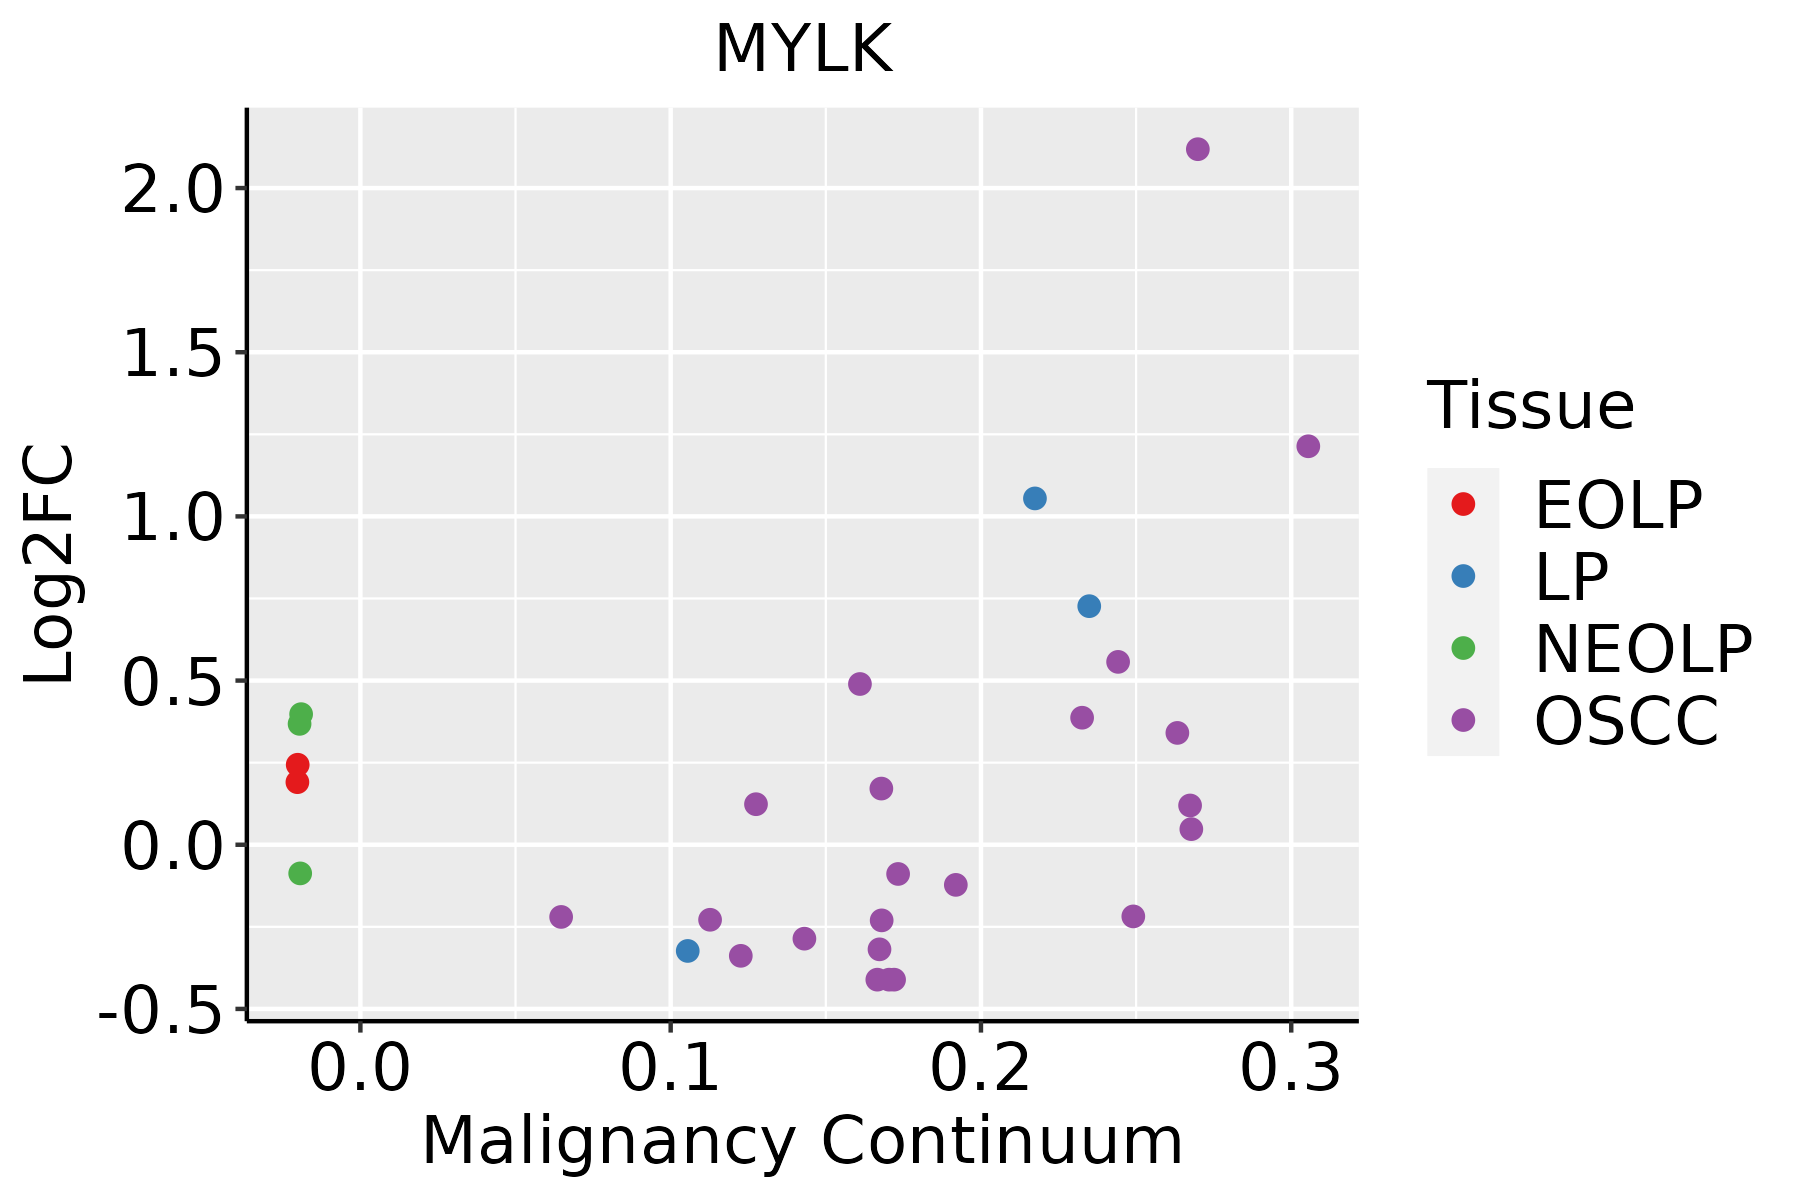 | EOLP: Erosive Oral lichen planus |
| LP: leukoplakia |
| NEOLP: Non-erosive oral lichen planus |
| OSCC: Oral squamous cell carcinoma |
| Prostate |  | BPH: Benign Prostatic Hyperplasia |
| Thyroid | 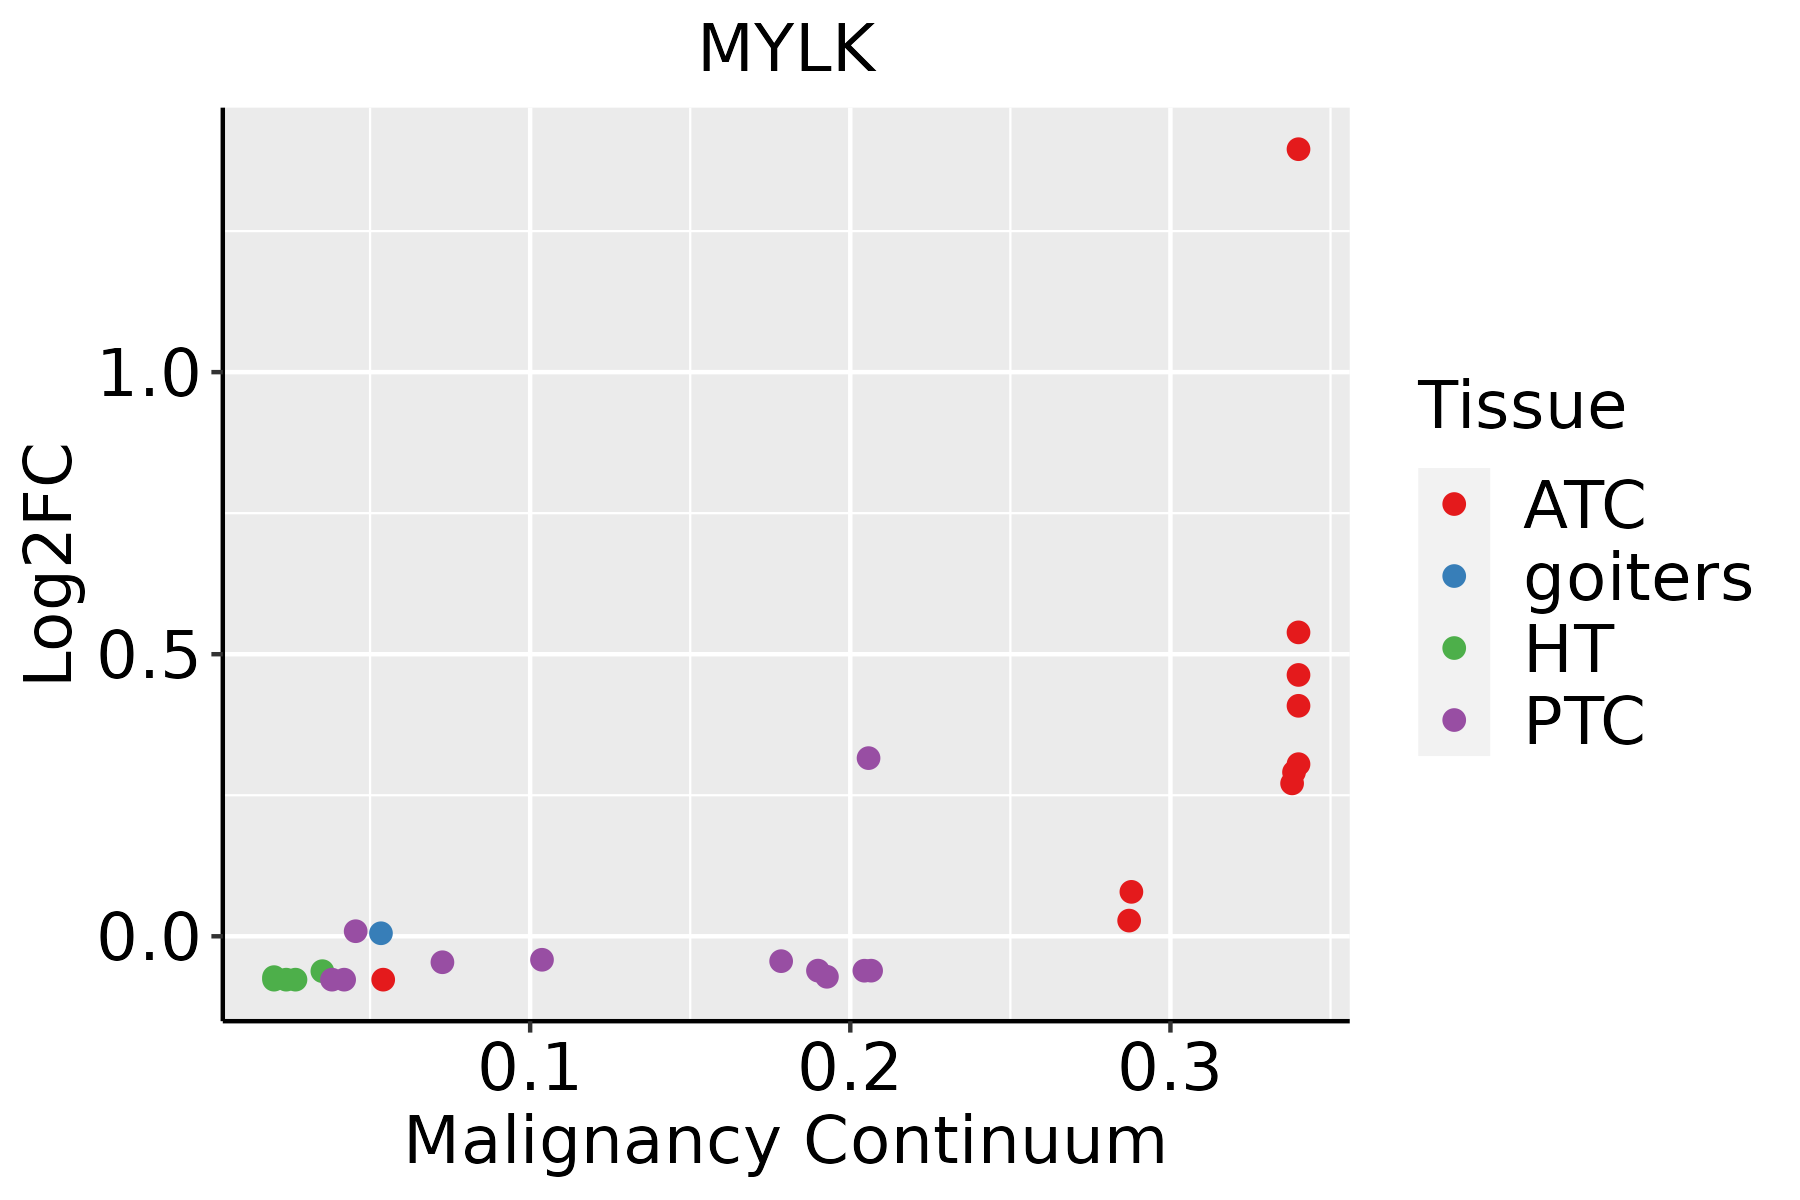 | ATC: Anaplastic thyroid cancer |
| HT: Hashimoto's thyroiditis |
| PTC: Papillary thyroid cancer |
| GO ID | Tissue | Disease Stage | Description | Gene Ratio | Bg Ratio | pvalue | p.adjust | Count |
| GO:006219714 | Breast | IDC | cellular response to chemical stress | 55/1434 | 337/18723 | 7.07e-08 | 4.36e-06 | 55 |
| GO:007121413 | Breast | IDC | cellular response to abiotic stimulus | 48/1434 | 331/18723 | 1.37e-05 | 3.53e-04 | 48 |
| GO:010400413 | Breast | IDC | cellular response to environmental stimulus | 48/1434 | 331/18723 | 1.37e-05 | 3.53e-04 | 48 |
| GO:004206014 | Breast | IDC | wound healing | 55/1434 | 422/18723 | 7.27e-05 | 1.45e-03 | 55 |
| GO:001095913 | Breast | IDC | regulation of metal ion transport | 52/1434 | 406/18723 | 1.76e-04 | 2.97e-03 | 52 |
| GO:006053711 | Breast | IDC | muscle tissue development | 50/1434 | 403/18723 | 4.91e-04 | 6.45e-03 | 50 |
| GO:007147011 | Breast | IDC | cellular response to osmotic stress | 10/1434 | 41/18723 | 8.38e-04 | 9.79e-03 | 10 |
| GO:190303612 | Breast | IDC | positive regulation of response to wounding | 14/1434 | 72/18723 | 9.93e-04 | 1.11e-02 | 14 |
| GO:00432703 | Breast | IDC | positive regulation of ion transport | 36/1434 | 275/18723 | 1.11e-03 | 1.22e-02 | 36 |
| GO:190303413 | Breast | IDC | regulation of response to wounding | 24/1434 | 167/18723 | 2.07e-03 | 1.95e-02 | 24 |
| GO:0051924 | Breast | IDC | regulation of calcium ion transport | 32/1434 | 255/18723 | 3.94e-03 | 3.22e-02 | 32 |
| GO:009030312 | Breast | IDC | positive regulation of wound healing | 11/1434 | 59/18723 | 4.70e-03 | 3.61e-02 | 11 |
| GO:0051928 | Breast | IDC | positive regulation of calcium ion transport | 18/1434 | 122/18723 | 5.35e-03 | 3.95e-02 | 18 |
| GO:00030125 | Breast | IDC | muscle system process | 50/1434 | 452/18723 | 5.52e-03 | 4.05e-02 | 50 |
| GO:00075172 | Breast | IDC | muscle organ development | 38/1434 | 327/18723 | 6.63e-03 | 4.62e-02 | 38 |
| GO:006219724 | Breast | DCIS | cellular response to chemical stress | 56/1390 | 337/18723 | 9.64e-09 | 7.38e-07 | 56 |
| GO:007121423 | Breast | DCIS | cellular response to abiotic stimulus | 47/1390 | 331/18723 | 1.32e-05 | 3.31e-04 | 47 |
| GO:010400423 | Breast | DCIS | cellular response to environmental stimulus | 47/1390 | 331/18723 | 1.32e-05 | 3.31e-04 | 47 |
| GO:004206024 | Breast | DCIS | wound healing | 54/1390 | 422/18723 | 6.09e-05 | 1.22e-03 | 54 |
| GO:006053721 | Breast | DCIS | muscle tissue development | 50/1390 | 403/18723 | 2.39e-04 | 3.74e-03 | 50 |
| Pathway ID | Tissue | Disease Stage | Description | Gene Ratio | Bg Ratio | pvalue | p.adjust | qvalue | Count |
| hsa0497122 | Breast | IDC | Gastric acid secretion | 16/867 | 76/8465 | 3.80e-03 | 2.33e-02 | 1.74e-02 | 16 |
| hsa0481014 | Breast | IDC | Regulation of actin cytoskeleton | 36/867 | 229/8465 | 5.79e-03 | 3.13e-02 | 2.34e-02 | 36 |
| hsa045109 | Breast | IDC | Focal adhesion | 32/867 | 203/8465 | 8.60e-03 | 4.23e-02 | 3.17e-02 | 32 |
| hsa0497132 | Breast | IDC | Gastric acid secretion | 16/867 | 76/8465 | 3.80e-03 | 2.33e-02 | 1.74e-02 | 16 |
| hsa0481015 | Breast | IDC | Regulation of actin cytoskeleton | 36/867 | 229/8465 | 5.79e-03 | 3.13e-02 | 2.34e-02 | 36 |
| hsa0451013 | Breast | IDC | Focal adhesion | 32/867 | 203/8465 | 8.60e-03 | 4.23e-02 | 3.17e-02 | 32 |
| hsa0481023 | Breast | DCIS | Regulation of actin cytoskeleton | 35/846 | 229/8465 | 6.89e-03 | 3.37e-02 | 2.48e-02 | 35 |
| hsa0481033 | Breast | DCIS | Regulation of actin cytoskeleton | 35/846 | 229/8465 | 6.89e-03 | 3.37e-02 | 2.48e-02 | 35 |
| hsa04810 | Colorectum | AD | Regulation of actin cytoskeleton | 75/2092 | 229/8465 | 3.36e-03 | 1.76e-02 | 1.12e-02 | 75 |
| hsa04510 | Colorectum | AD | Focal adhesion | 67/2092 | 203/8465 | 4.40e-03 | 2.17e-02 | 1.38e-02 | 67 |
| hsa048101 | Colorectum | AD | Regulation of actin cytoskeleton | 75/2092 | 229/8465 | 3.36e-03 | 1.76e-02 | 1.12e-02 | 75 |
| hsa045101 | Colorectum | AD | Focal adhesion | 67/2092 | 203/8465 | 4.40e-03 | 2.17e-02 | 1.38e-02 | 67 |
| hsa049712 | Colorectum | SER | Gastric acid secretion | 27/1580 | 76/8465 | 3.65e-04 | 3.27e-03 | 2.38e-03 | 27 |
| hsa048102 | Colorectum | SER | Regulation of actin cytoskeleton | 60/1580 | 229/8465 | 2.74e-03 | 2.02e-02 | 1.47e-02 | 60 |
| hsa049713 | Colorectum | SER | Gastric acid secretion | 27/1580 | 76/8465 | 3.65e-04 | 3.27e-03 | 2.38e-03 | 27 |
| hsa048103 | Colorectum | SER | Regulation of actin cytoskeleton | 60/1580 | 229/8465 | 2.74e-03 | 2.02e-02 | 1.47e-02 | 60 |
| hsa045102 | Colorectum | FAP | Focal adhesion | 61/1404 | 203/8465 | 1.03e-06 | 2.15e-05 | 1.31e-05 | 61 |
| hsa048106 | Colorectum | FAP | Regulation of actin cytoskeleton | 65/1404 | 229/8465 | 4.07e-06 | 5.91e-05 | 3.59e-05 | 65 |
| hsa049716 | Colorectum | FAP | Gastric acid secretion | 24/1404 | 76/8465 | 8.95e-04 | 5.20e-03 | 3.16e-03 | 24 |
| hsa040222 | Colorectum | FAP | cGMP-PKG signaling pathway | 42/1404 | 167/8465 | 2.84e-03 | 1.27e-02 | 7.70e-03 | 42 |
| Hugo Symbol | Variant Class | Variant Classification | dbSNP RS | HGVSc | HGVSp | HGVSp Short | SWISSPROT | BIOTYPE | SIFT | PolyPhen | Tumor Sample Barcode | Tissue | Histology | Sex | Age | Stage | Therapy Types | Drugs | Outcome |
| MYLK | SNV | Missense_Mutation | novel | c.363G>C | p.Leu121Phe | p.L121F | Q15746 | protein_coding | deleterious(0) | probably_damaging(1) | TCGA-5L-AAT1-01 | Breast | breast invasive carcinoma | Female | <65 | III/IV | Hormone Therapy | letrozol | SD |
| MYLK | SNV | Missense_Mutation | | c.82N>A | p.Pro28Thr | p.P28T | Q15746 | protein_coding | tolerated_low_confidence(0.06) | benign(0.417) | TCGA-A1-A0SO-01 | Breast | breast invasive carcinoma | Female | >=65 | I/II | Chemotherapy | | SD |
| MYLK | SNV | Missense_Mutation | | c.637A>C | p.Asn213His | p.N213H | Q15746 | protein_coding | deleterious(0.03) | probably_damaging(0.914) | TCGA-A2-A0EY-01 | Breast | breast invasive carcinoma | Female | <65 | I/II | Chemotherapy | adriamycin | SD |
| MYLK | SNV | Missense_Mutation | rs201754358 | c.455N>A | p.Arg152His | p.R152H | Q15746 | protein_coding | deleterious(0.02) | possibly_damaging(0.891) | TCGA-A7-A26F-01 | Breast | breast invasive carcinoma | Female | <65 | I/II | Chemotherapy | taxotere | SD |
| MYLK | SNV | Missense_Mutation | | c.5410N>G | p.Lys1804Glu | p.K1804E | Q15746 | protein_coding | deleterious(0) | possibly_damaging(0.718) | TCGA-AC-A23H-01 | Breast | breast invasive carcinoma | Female | >=65 | I/II | Unknown | Unknown | PD |
| MYLK | SNV | Missense_Mutation | | c.1273N>A | p.Val425Ile | p.V425I | Q15746 | protein_coding | tolerated(0.05) | benign(0.093) | TCGA-AN-A0AK-01 | Breast | breast invasive carcinoma | Female | >=65 | I/II | Unknown | Unknown | SD |
| MYLK | SNV | Missense_Mutation | | c.1540N>T | p.Pro514Ser | p.P514S | Q15746 | protein_coding | deleterious(0) | probably_damaging(0.993) | TCGA-AO-A0JA-01 | Breast | breast invasive carcinoma | Female | <65 | III/IV | Hormone Therapy | leuprolide | SD |
| MYLK | SNV | Missense_Mutation | rs747368032 | c.4709N>T | p.Ser1570Leu | p.S1570L | Q15746 | protein_coding | tolerated(0.32) | benign(0.117) | TCGA-AR-A1AO-01 | Breast | breast invasive carcinoma | Female | <65 | I/II | Chemotherapy | doxorubicin | SD |
| MYLK | SNV | Missense_Mutation | | c.2053G>T | p.Val685Leu | p.V685L | Q15746 | protein_coding | deleterious(0) | probably_damaging(0.944) | TCGA-B6-A0RS-01 | Breast | breast invasive carcinoma | Female | <65 | I/II | Unknown | Unknown | PD |
| MYLK | SNV | Missense_Mutation | | c.5398G>A | p.Val1800Ile | p.V1800I | Q15746 | protein_coding | deleterious(0.01) | possibly_damaging(0.596) | TCGA-B6-A0X1-01 | Breast | breast invasive carcinoma | Female | <65 | I/II | Unknown | Unknown | PD |
| Entrez ID | Symbol | Category | Interaction Types | Drug Claim Name | Drug Name | PMIDs |
| 4638 | MYLK | ENZYME, KINASE, DRUGGABLE GENOME, SERINE THREONINE KINASE | inhibitor | TOZASERTIB | TOZASERTIB | 19035792 |
| 4638 | MYLK | ENZYME, KINASE, DRUGGABLE GENOME, SERINE THREONINE KINASE | activator | 135652052 | | |
| 4638 | MYLK | ENZYME, KINASE, DRUGGABLE GENOME, SERINE THREONINE KINASE | | ME-3407 | | |
| 4638 | MYLK | ENZYME, KINASE, DRUGGABLE GENOME, SERINE THREONINE KINASE | inhibitor | 249565832 | | |


