
|
|||||
|
 | |
| |
| |
| |
| |
| |
|
Gene: MYLIP |
Gene summary for MYLIP |
| Gene information | Species | Human | Gene symbol | MYLIP | Gene ID | 29116 |
| Gene name | myosin regulatory light chain interacting protein | |
| Gene Alias | IDOL | |
| Cytomap | 6p22.3 | |
| Gene Type | protein-coding | GO ID | GO:0006464 | UniProtAcc | Q8WY64 |
Top |
Malignant transformation analysis |
| Identification of the aberrant gene expression in precancerous and cancerous lesions by comparing the gene expression of stem-like cells in diseased tissues with normal stem cells |
| Entrez ID | Symbol | Replicates | Species | Organ | Tissue | Adj P-value | Log2FC | Malignancy |
| 29116 | MYLIP | HTA11_3410_2000001011 | Human | Colorectum | AD | 5.49e-03 | 3.08e-02 | 0.0155 |
| 29116 | MYLIP | HTA11_1938_2000001011 | Human | Colorectum | AD | 6.37e-04 | 2.60e-01 | -0.0811 |
| 29116 | MYLIP | HTA11_866_3004761011 | Human | Colorectum | AD | 5.60e-08 | 3.75e-01 | 0.096 |
| 29116 | MYLIP | HTA11_7696_3000711011 | Human | Colorectum | AD | 1.52e-03 | 2.61e-01 | 0.0674 |
| 29116 | MYLIP | HTA11_99999965104_69814 | Human | Colorectum | MSS | 9.71e-12 | 7.07e-01 | 0.281 |
| 29116 | MYLIP | HTA11_99999971662_82457 | Human | Colorectum | MSS | 4.45e-08 | 5.04e-01 | 0.3859 |
| 29116 | MYLIP | A002-C-205 | Human | Colorectum | FAP | 1.43e-02 | -1.58e-01 | -0.1236 |
| 29116 | MYLIP | A015-C-104 | Human | Colorectum | FAP | 7.32e-04 | -2.15e-01 | -0.1899 |
| 29116 | MYLIP | A002-C-016 | Human | Colorectum | FAP | 9.51e-03 | -1.63e-01 | 0.0521 |
| 29116 | MYLIP | A002-C-116 | Human | Colorectum | FAP | 8.21e-04 | -1.67e-01 | -0.0452 |
| 29116 | MYLIP | A018-E-020 | Human | Colorectum | FAP | 1.74e-02 | -1.76e-01 | -0.2034 |
| 29116 | MYLIP | AEH-subject1 | Human | Endometrium | AEH | 2.19e-03 | 1.81e-01 | -0.3059 |
| 29116 | MYLIP | AEH-subject2 | Human | Endometrium | AEH | 2.61e-05 | 1.53e-03 | -0.2525 |
| 29116 | MYLIP | AEH-subject4 | Human | Endometrium | AEH | 2.86e-02 | 4.96e-02 | -0.2657 |
| 29116 | MYLIP | AEH-subject5 | Human | Endometrium | AEH | 4.62e-05 | -2.47e-01 | -0.2953 |
| 29116 | MYLIP | EEC-subject1 | Human | Endometrium | EEC | 5.02e-04 | -1.83e-02 | -0.2682 |
| 29116 | MYLIP | EEC-subject2 | Human | Endometrium | EEC | 5.42e-09 | -3.14e-01 | -0.2607 |
| 29116 | MYLIP | EEC-subject3 | Human | Endometrium | EEC | 4.47e-19 | -3.52e-01 | -0.2525 |
| 29116 | MYLIP | GSM5276934 | Human | Endometrium | EEC | 2.66e-21 | -4.48e-01 | -0.0913 |
| 29116 | MYLIP | GSM5276935 | Human | Endometrium | EEC | 1.99e-06 | -2.91e-01 | -0.123 |
| Page: 1 2 3 4 5 6 7 8 |
| Tissue | Expression Dynamics | Abbreviation |
| Colorectum (GSE201348) |  | FAP: Familial adenomatous polyposis |
| CRC: Colorectal cancer | ||
| Colorectum (HTA11) |  | AD: Adenomas |
| SER: Sessile serrated lesions | ||
| MSI-H: Microsatellite-high colorectal cancer | ||
| MSS: Microsatellite stable colorectal cancer | ||
| Endometrium | 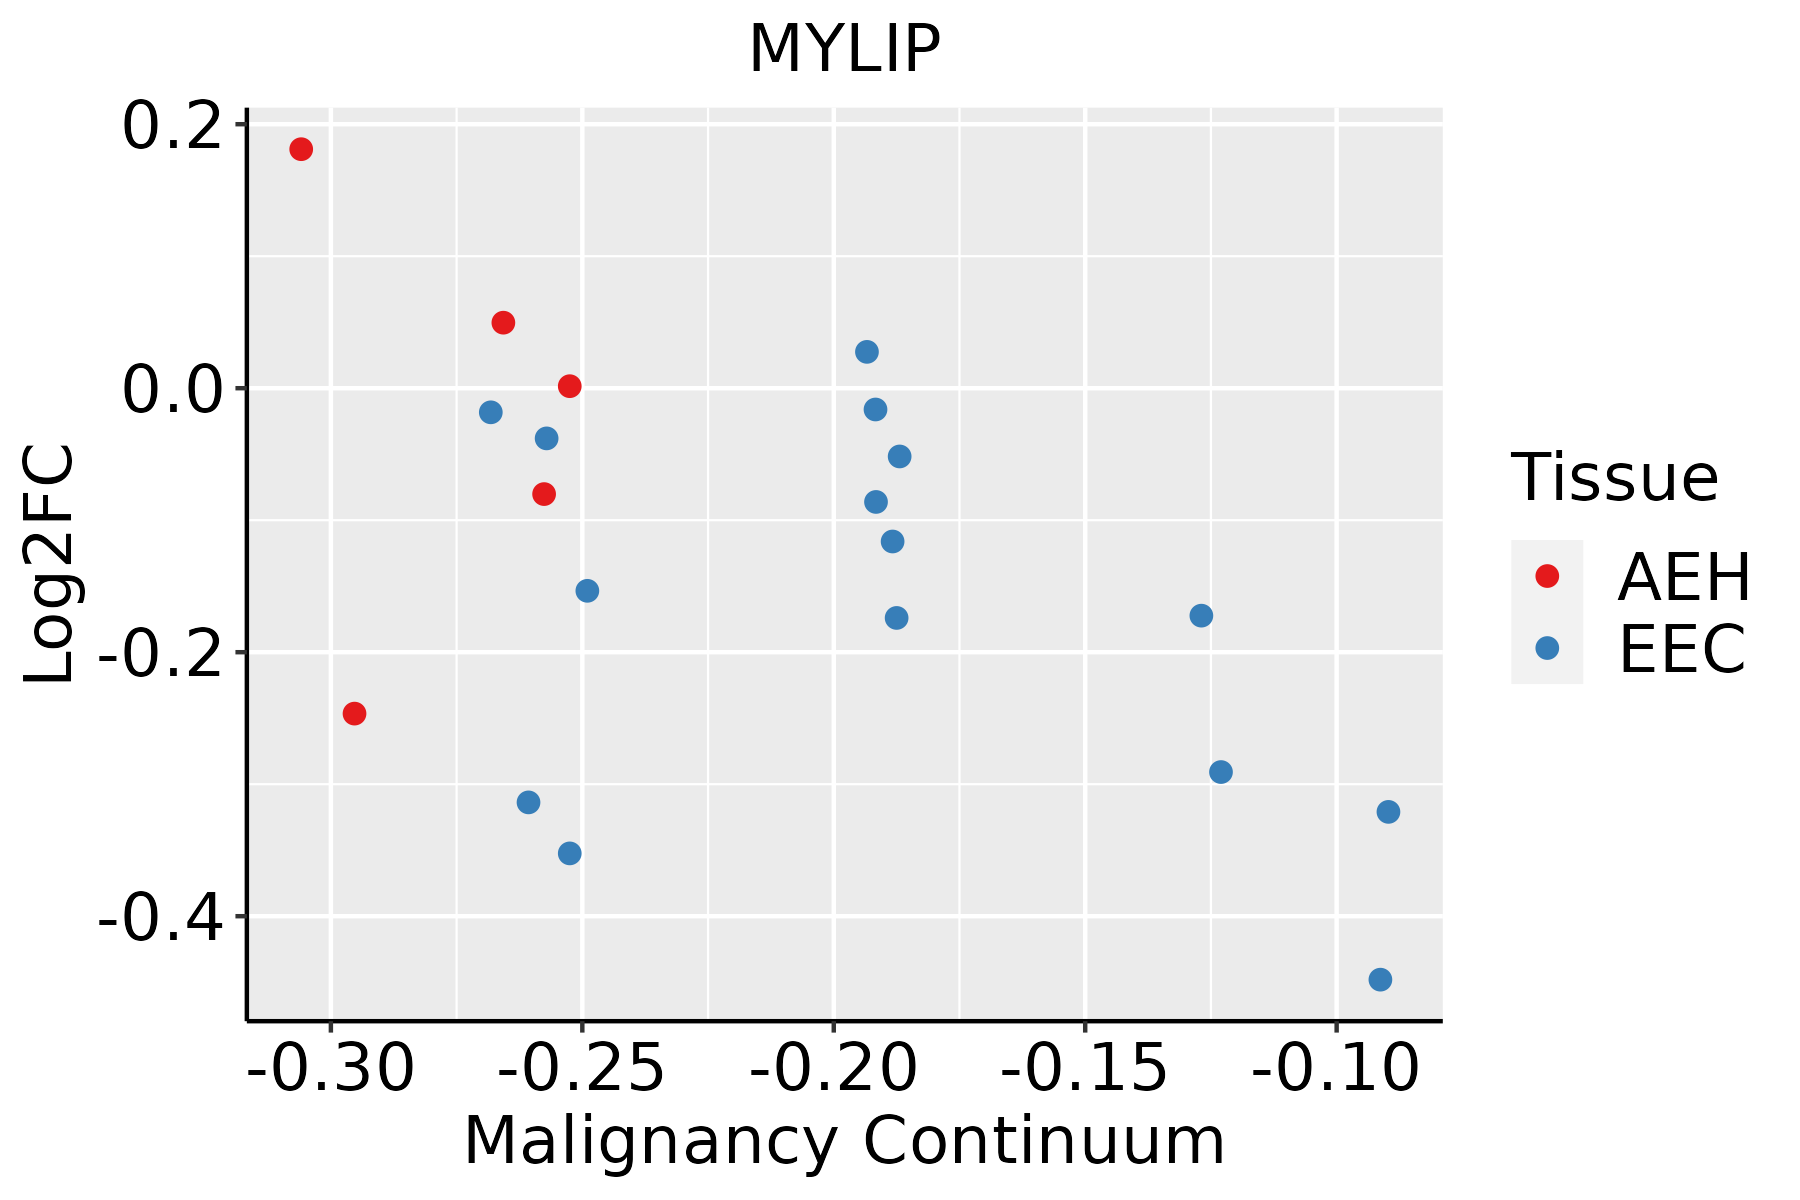 | AEH: Atypical endometrial hyperplasia |
| EEC: Endometrioid Cancer | ||
| Esophagus | 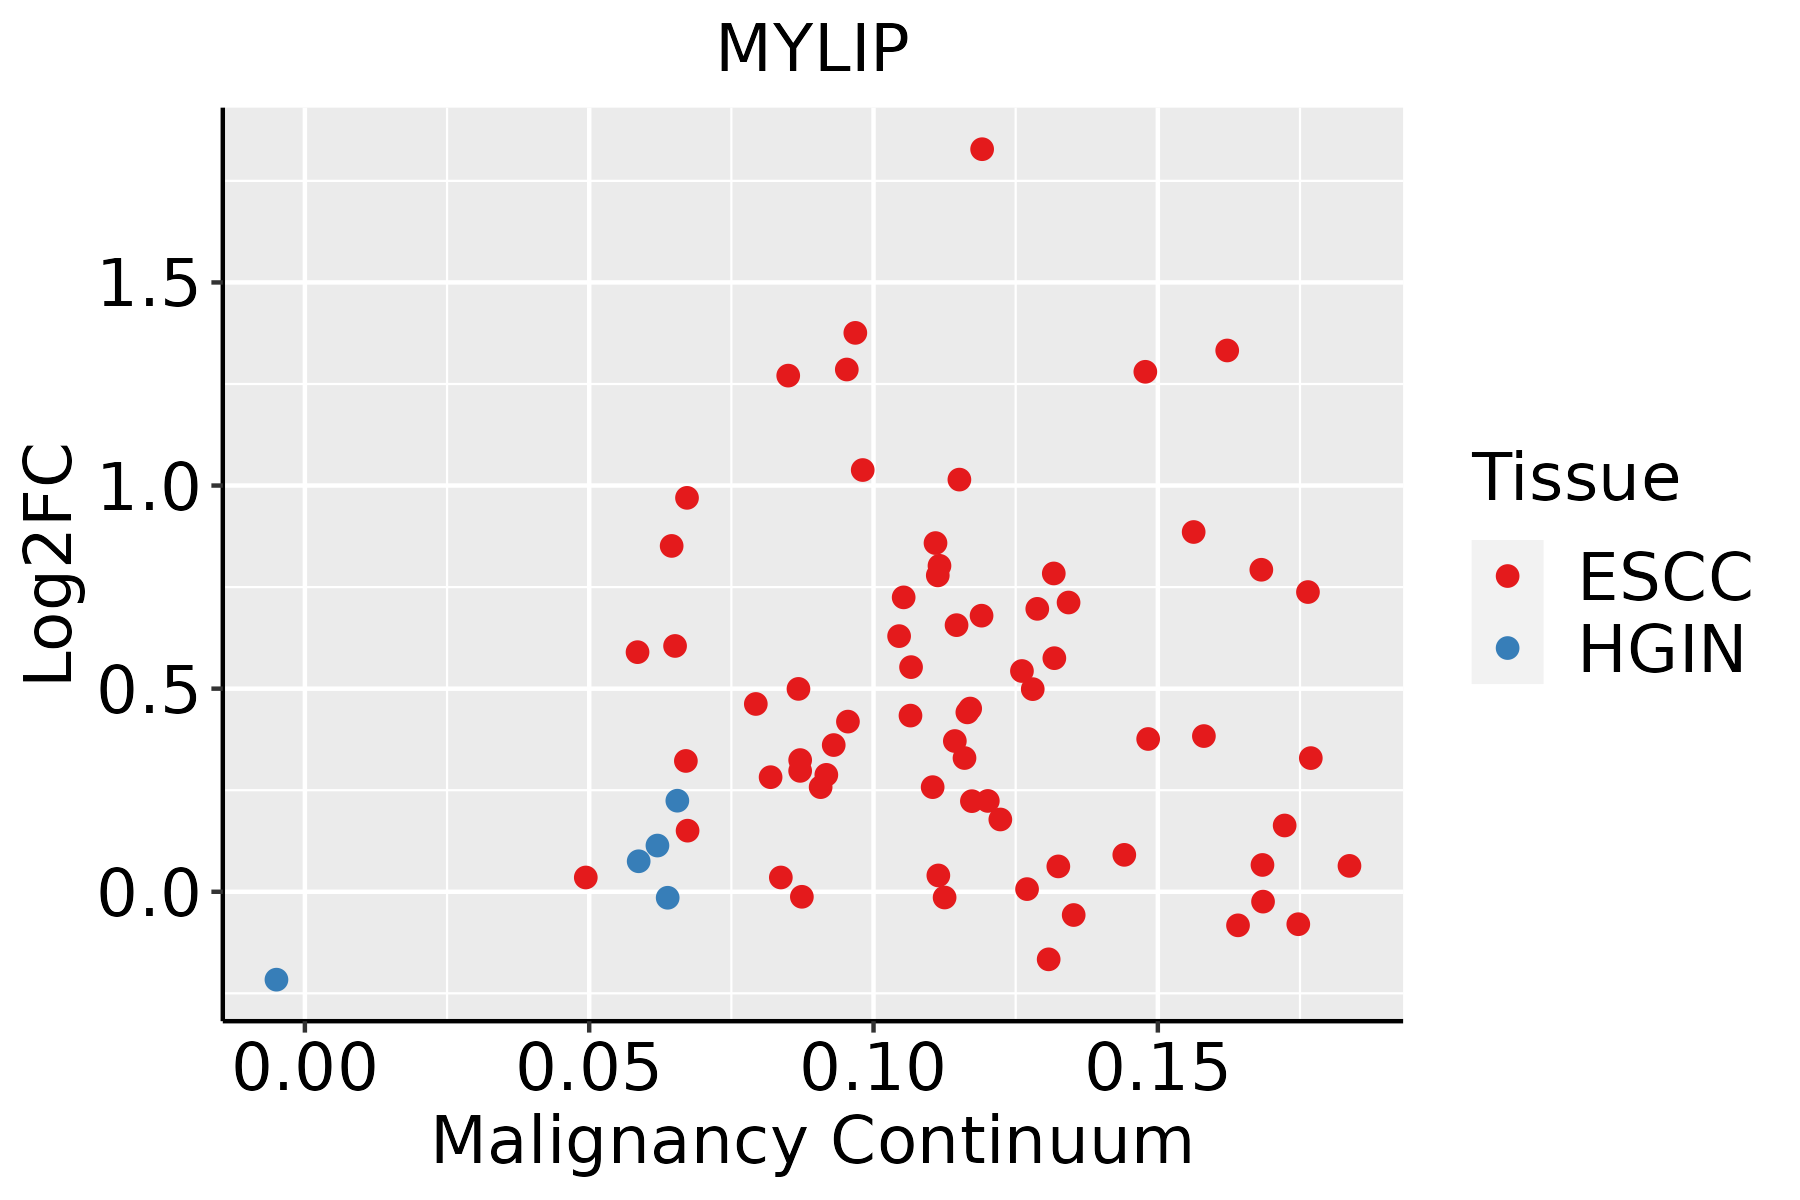 | ESCC: Esophageal squamous cell carcinoma |
| HGIN: High-grade intraepithelial neoplasias | ||
| LGIN: Low-grade intraepithelial neoplasias | ||
| Liver | 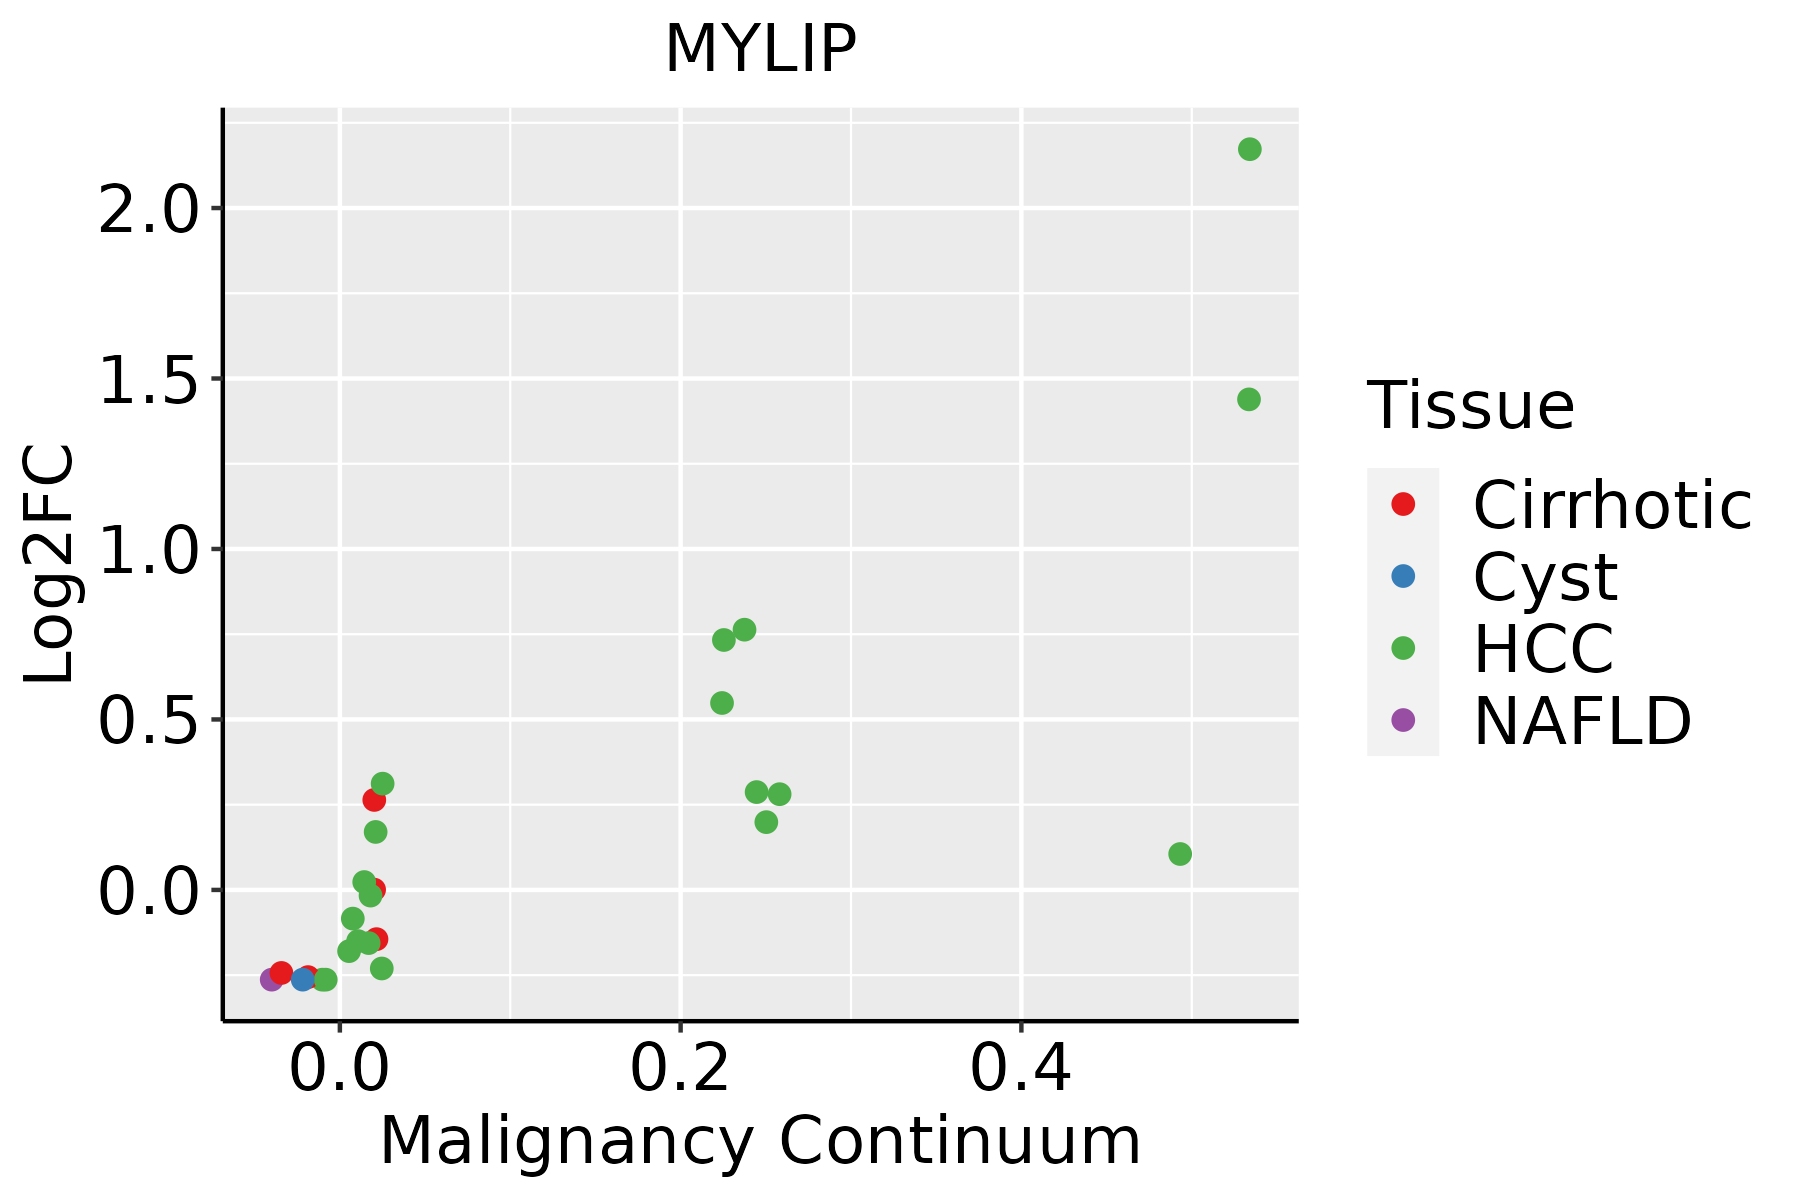 | HCC: Hepatocellular carcinoma |
| NAFLD: Non-alcoholic fatty liver disease | ||
| Lung | 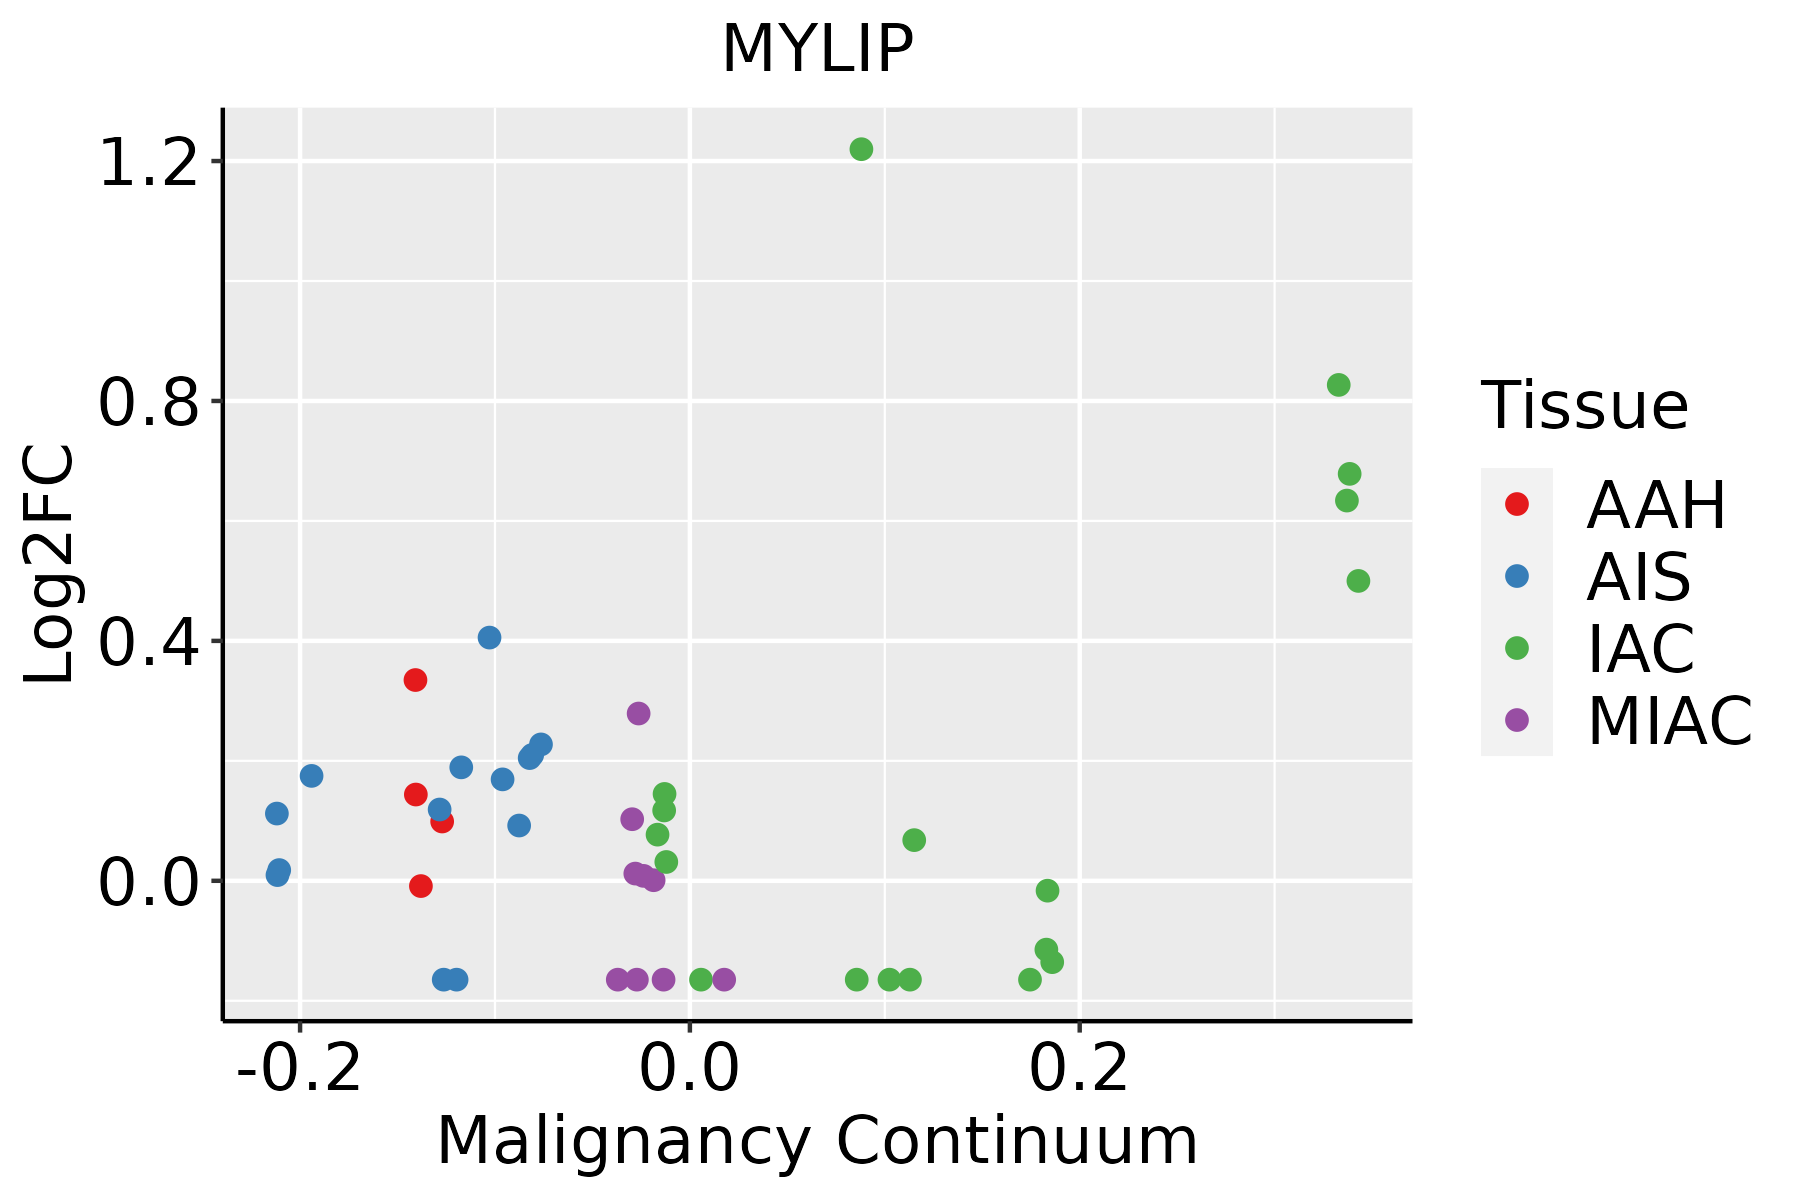 | AAH: Atypical adenomatous hyperplasia |
| AIS: Adenocarcinoma in situ | ||
| IAC: Invasive lung adenocarcinoma | ||
| MIA: Minimally invasive adenocarcinoma | ||
| Oral Cavity | 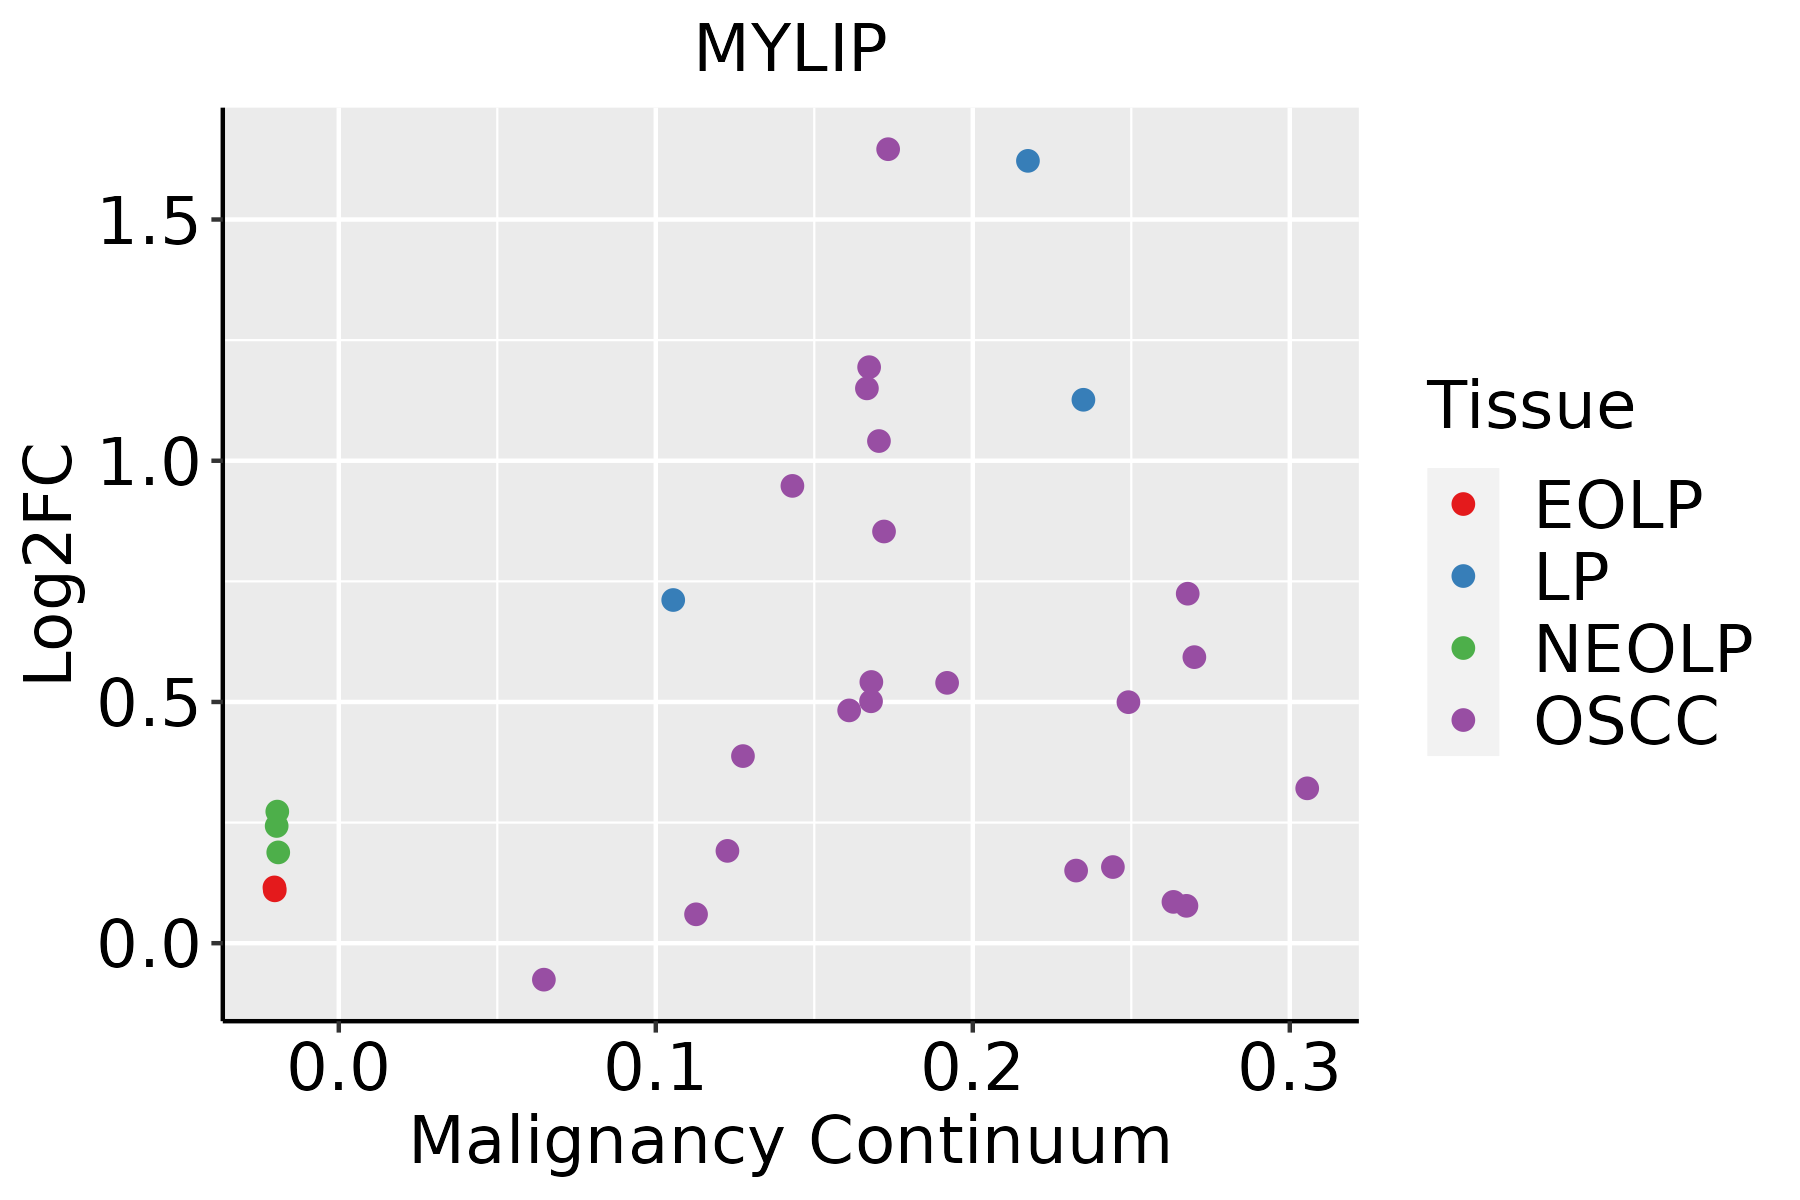 | EOLP: Erosive Oral lichen planus |
| LP: leukoplakia | ||
| NEOLP: Non-erosive oral lichen planus | ||
| OSCC: Oral squamous cell carcinoma | ||
| Prostate |  | BPH: Benign Prostatic Hyperplasia |
| Thyroid | 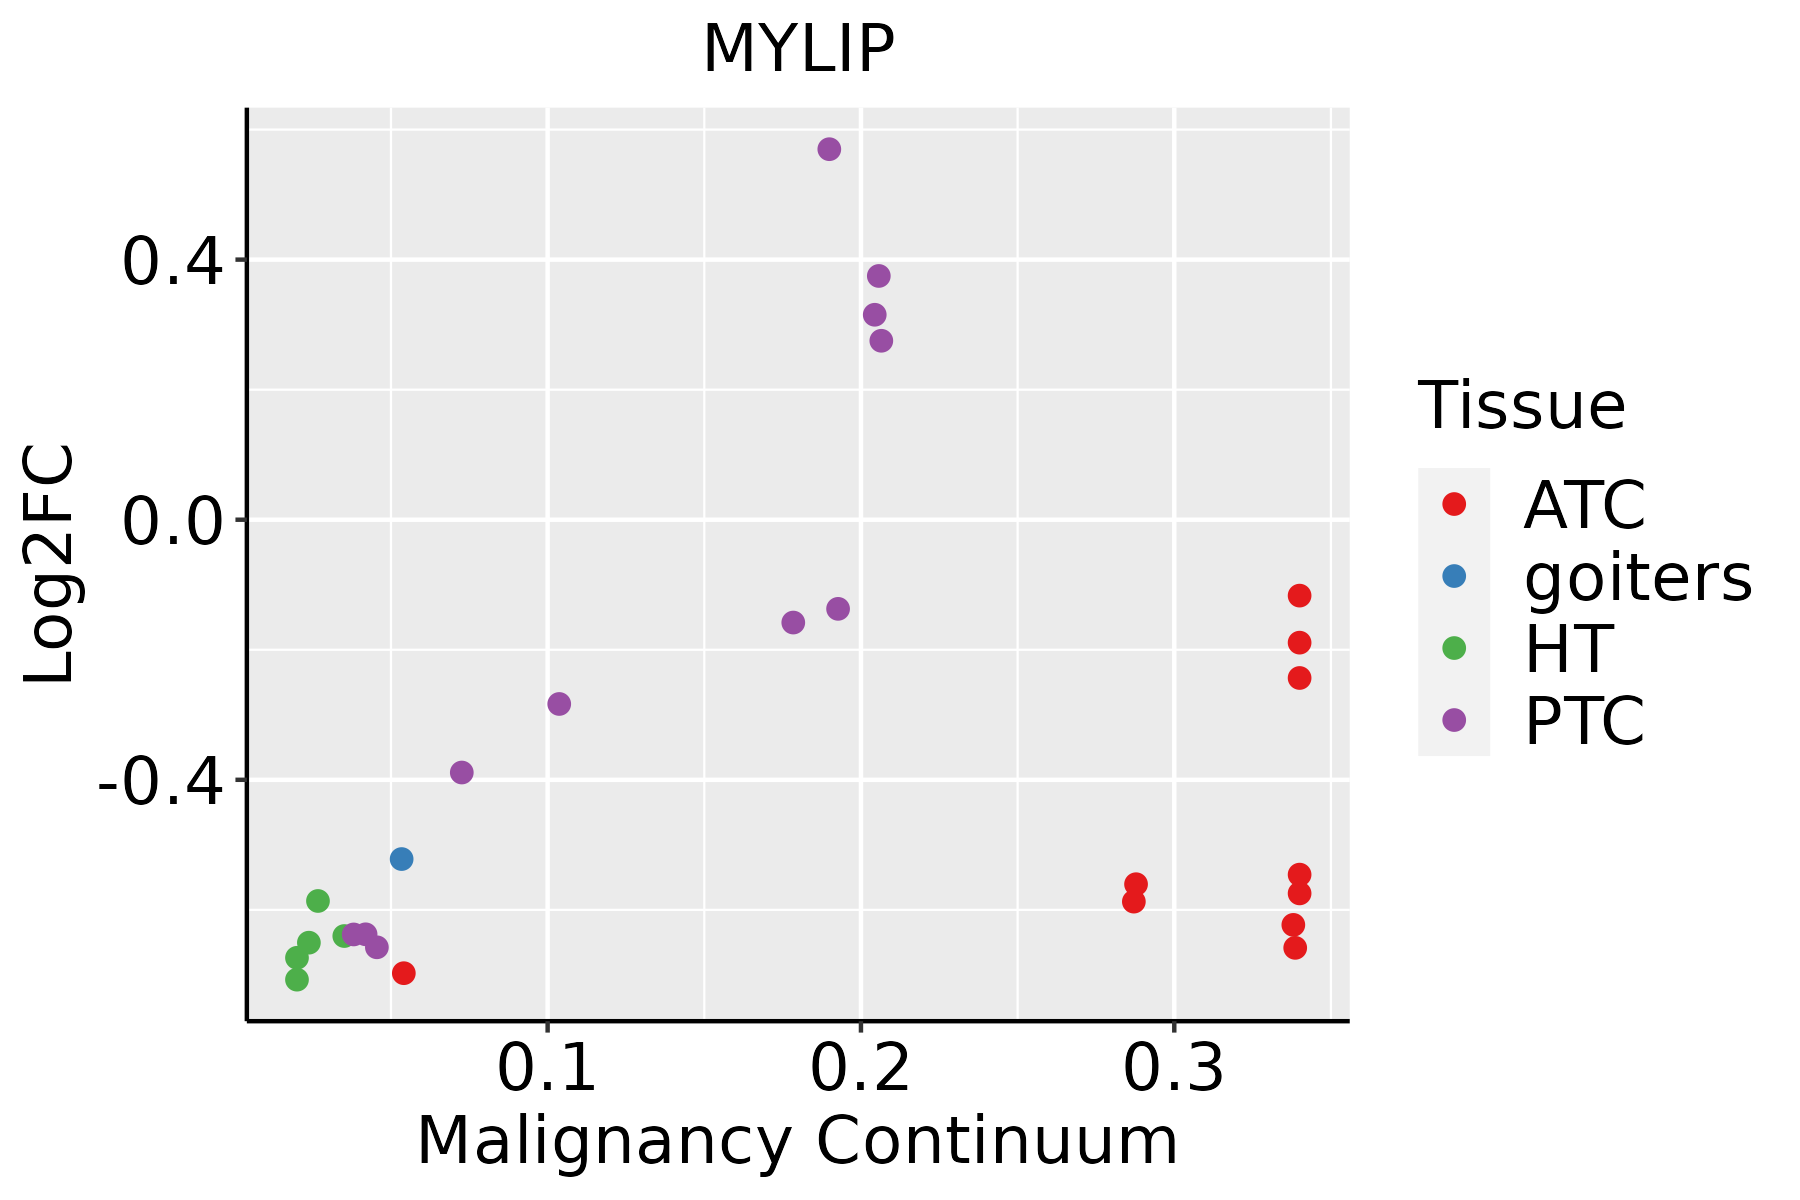 | ATC: Anaplastic thyroid cancer |
| HT: Hashimoto's thyroiditis | ||
| PTC: Papillary thyroid cancer |
| ∗log2FC in expression of this searched gene in stem-like cells from each diseased tissue sample relative to stem-like cells in normal samples in each tissue plotted against the malignancy continuum. Samples are colored based on if they are from different disease stage. |
Top |
Malignant transformation related pathway analysis |
| Find out the enriched GO biological processes and KEGG pathways involved in transition from healthy to precancer to cancer |
| Tissue | Disease Stage | Enriched GO biological Processes |
| Colorectum | AD |  |
| Colorectum | SER |  |
| Colorectum | MSS |  |
| Colorectum | MSI-H |  |
| Colorectum | FAP |  |
| ∗Top 15 enriched GO BP terms are showed in the bar plot of each disease state in each tissue. Each row represents a significant GO biological process which is colored according to the -log10(p.adjust). |
| Page: 1 2 3 4 5 6 7 8 9 |
| GO ID | Tissue | Disease Stage | Description | Gene Ratio | Bg Ratio | pvalue | p.adjust | Count |
| GO:0042176 | Colorectum | AD | regulation of protein catabolic process | 160/3918 | 391/18723 | 1.06e-19 | 7.34e-17 | 160 |
| GO:0009896 | Colorectum | AD | positive regulation of catabolic process | 180/3918 | 492/18723 | 4.33e-16 | 1.94e-13 | 180 |
| GO:1903362 | Colorectum | AD | regulation of cellular protein catabolic process | 109/3918 | 255/18723 | 2.14e-15 | 6.08e-13 | 109 |
| GO:0045732 | Colorectum | AD | positive regulation of protein catabolic process | 92/3918 | 231/18723 | 3.85e-11 | 4.47e-09 | 92 |
| GO:0031647 | Colorectum | AD | regulation of protein stability | 108/3918 | 298/18723 | 6.33e-10 | 5.08e-08 | 108 |
| GO:0043112 | Colorectum | AD | receptor metabolic process | 62/3918 | 166/18723 | 8.18e-07 | 2.85e-05 | 62 |
| GO:0010975 | Colorectum | AD | regulation of neuron projection development | 129/3918 | 445/18723 | 2.88e-05 | 5.37e-04 | 129 |
| GO:0031345 | Colorectum | AD | negative regulation of cell projection organization | 58/3918 | 186/18723 | 6.37e-04 | 6.58e-03 | 58 |
| GO:0010977 | Colorectum | AD | negative regulation of neuron projection development | 43/3918 | 137/18723 | 2.60e-03 | 1.97e-02 | 43 |
| GO:0032801 | Colorectum | AD | receptor catabolic process | 12/3918 | 28/18723 | 7.21e-03 | 4.39e-02 | 12 |
| GO:00421762 | Colorectum | MSS | regulation of protein catabolic process | 145/3467 | 391/18723 | 2.03e-18 | 1.17e-15 | 145 |
| GO:00098962 | Colorectum | MSS | positive regulation of catabolic process | 163/3467 | 492/18723 | 3.10e-15 | 9.22e-13 | 163 |
| GO:19033622 | Colorectum | MSS | regulation of cellular protein catabolic process | 99/3467 | 255/18723 | 1.90e-14 | 5.37e-12 | 99 |
| GO:00316472 | Colorectum | MSS | regulation of protein stability | 103/3467 | 298/18723 | 2.52e-11 | 3.49e-09 | 103 |
| GO:00457322 | Colorectum | MSS | positive regulation of protein catabolic process | 85/3467 | 231/18723 | 3.66e-11 | 4.57e-09 | 85 |
| GO:00431121 | Colorectum | MSS | receptor metabolic process | 57/3467 | 166/18723 | 8.47e-07 | 2.97e-05 | 57 |
| GO:00109752 | Colorectum | MSS | regulation of neuron projection development | 115/3467 | 445/18723 | 6.91e-05 | 1.20e-03 | 115 |
| GO:00313452 | Colorectum | MSS | negative regulation of cell projection organization | 54/3467 | 186/18723 | 3.03e-04 | 3.96e-03 | 54 |
| GO:00328011 | Colorectum | MSS | receptor catabolic process | 12/3467 | 28/18723 | 2.53e-03 | 2.02e-02 | 12 |
| GO:00109771 | Colorectum | MSS | negative regulation of neuron projection development | 39/3467 | 137/18723 | 2.86e-03 | 2.22e-02 | 39 |
| Page: 1 2 3 4 5 6 7 8 9 |
| Pathway ID | Tissue | Disease Stage | Description | Gene Ratio | Bg Ratio | pvalue | p.adjust | qvalue | Count |
| hsa049792 | Liver | Cirrhotic | Cholesterol metabolism | 30/2530 | 51/8465 | 1.59e-05 | 1.39e-04 | 8.60e-05 | 30 |
| hsa049793 | Liver | Cirrhotic | Cholesterol metabolism | 30/2530 | 51/8465 | 1.59e-05 | 1.39e-04 | 8.60e-05 | 30 |
| hsa049794 | Liver | HCC | Cholesterol metabolism | 41/4020 | 51/8465 | 1.33e-06 | 1.35e-05 | 7.49e-06 | 41 |
| hsa049795 | Liver | HCC | Cholesterol metabolism | 41/4020 | 51/8465 | 1.33e-06 | 1.35e-05 | 7.49e-06 | 41 |
| Page: 1 |
Top |
Cell-cell communication analysis |
| Identification of potential cell-cell interactions between two cell types and their ligand-receptor pairs for different disease states |
| Ligand | Receptor | LRpair | Pathway | Tissue | Disease Stage |
| Page: 1 |
Top |
Single-cell gene regulatory network inference analysis |
| Find out the significant the regulons (TFs) and the target genes of each regulon across cell types for different disease states |
| TF | Cell Type | Tissue | Disease Stage | Target Gene | RSS | Regulon Activity |
| ∗The dot plots of a searched regulon are shown for all cell subpopulations in each disease state of each tissue based on the regulon specific score inferred using pySCENIC and by calculating the average expression. |
| Page: 1 |
Top |
Somatic mutation of malignant transformation related genes |
| Annotation of somatic variants for genes involved in malignant transformation |
| Hugo Symbol | Variant Class | Variant Classification | dbSNP RS | HGVSc | HGVSp | HGVSp Short | SWISSPROT | BIOTYPE | SIFT | PolyPhen | Tumor Sample Barcode | Tissue | Histology | Sex | Age | Stage | Therapy Types | Drugs | Outcome |
| MYLIP | SNV | Missense_Mutation | c.1078N>A | p.Cys360Ser | p.C360S | Q8WY64 | protein_coding | tolerated(0.32) | benign(0.091) | TCGA-D8-A1XS-01 | Breast | breast invasive carcinoma | Male | <65 | III/IV | Chemotherapy | adriamycin+cyclophosphamide | SD | |
| MYLIP | SNV | Missense_Mutation | c.568N>T | p.His190Tyr | p.H190Y | Q8WY64 | protein_coding | tolerated(0.15) | probably_damaging(0.988) | TCGA-GM-A3NW-01 | Breast | breast invasive carcinoma | Female | <65 | I/II | Chemotherapy | fluorouracil | SD | |
| MYLIP | insertion | Frame_Shift_Ins | novel | c.1126_1127insGT | p.Glu376GlyfsTer7 | p.E376Gfs*7 | Q8WY64 | protein_coding | TCGA-AN-A0FK-01 | Breast | breast invasive carcinoma | Female | >=65 | III/IV | Unknown | Unknown | SD | ||
| MYLIP | insertion | In_Frame_Ins | novel | c.1127_1128insTACAACTAGGAGGGGCTTAAACAGGAT | p.Glu376delinsAspThrThrArgArgGlyLeuAsnArgMet | p.E376delinsDTTRRGLNRM | Q8WY64 | protein_coding | TCGA-AN-A0FK-01 | Breast | breast invasive carcinoma | Female | >=65 | III/IV | Unknown | Unknown | SD | ||
| MYLIP | insertion | Nonsense_Mutation | novel | c.1093_1094insGATA | p.Leu366Ter | p.L366* | Q8WY64 | protein_coding | TCGA-AO-A0JB-01 | Breast | breast invasive carcinoma | Female | <65 | III/IV | Chemotherapy | cyclophosphamide | SD | ||
| MYLIP | deletion | Frame_Shift_Del | novel | c.492delN | p.Thr166ProfsTer22 | p.T166Pfs*22 | Q8WY64 | protein_coding | TCGA-D8-A27V-01 | Breast | breast invasive carcinoma | Female | <65 | I/II | Hormone Therapy | tamoxiphen | SD | ||
| MYLIP | SNV | Missense_Mutation | novel | c.4C>A | p.Leu2Met | p.L2M | Q8WY64 | protein_coding | tolerated(0.12) | possibly_damaging(0.879) | TCGA-2W-A8YY-01 | Cervix | cervical & endocervical cancer | Female | <65 | I/II | Chemotherapy | cisplatin | CR |
| MYLIP | SNV | Missense_Mutation | novel | c.889G>A | p.Ala297Thr | p.A297T | Q8WY64 | protein_coding | tolerated(0.07) | probably_damaging(0.989) | TCGA-EA-A410-01 | Cervix | cervical & endocervical cancer | Female | <65 | I/II | Unknown | Unknown | SD |
| MYLIP | SNV | Missense_Mutation | c.160N>G | p.Leu54Val | p.L54V | Q8WY64 | protein_coding | tolerated(0.07) | probably_damaging(0.994) | TCGA-CA-6717-01 | Colorectum | colon adenocarcinoma | Male | <65 | I/II | Chemotherapy | oxaliplatin | CR | |
| MYLIP | SNV | Missense_Mutation | c.1184N>A | p.Ile395Asn | p.I395N | Q8WY64 | protein_coding | deleterious(0) | possibly_damaging(0.776) | TCGA-D5-6928-01 | Colorectum | colon adenocarcinoma | Male | >=65 | I/II | Unknown | Unknown | SD |
| Page: 1 2 3 4 5 |
Top |
Related drugs of malignant transformation related genes |
| Identification of chemicals and drugs interact with genes involved in malignant transfromation |
| (DGIdb 4.0) |
| Entrez ID | Symbol | Category | Interaction Types | Drug Claim Name | Drug Name | PMIDs |
| 29116 | MYLIP | ENZYME | atorvastatin | ATORVASTATIN | 25171759 |
| Page: 1 |

Copyright 2023-Present -The University of Texas Health Science Center at Houston |