
|
|||||
|
 | |
| |
| |
| |
| |
| |
|
Gene: MYL9 |
Gene summary for MYL9 |
| Gene information | Species | Human | Gene symbol | MYL9 | Gene ID | 10398 |
| Gene name | myosin light chain 9 | |
| Gene Alias | LC20 | |
| Cytomap | 20q11.23 | |
| Gene Type | protein-coding | GO ID | GO:0001775 | UniProtAcc | P24844 |
Top |
Malignant transformation analysis |
| Identification of the aberrant gene expression in precancerous and cancerous lesions by comparing the gene expression of stem-like cells in diseased tissues with normal stem cells |
| Entrez ID | Symbol | Replicates | Species | Organ | Tissue | Adj P-value | Log2FC | Malignancy |
| 10398 | MYL9 | GSM4909281 | Human | Breast | IDC | 4.24e-68 | 1.14e+00 | 0.21 |
| 10398 | MYL9 | GSM4909282 | Human | Breast | IDC | 1.77e-02 | 2.84e-01 | -0.0288 |
| 10398 | MYL9 | GSM4909287 | Human | Breast | IDC | 2.13e-11 | 5.23e-01 | 0.2057 |
| 10398 | MYL9 | GSM4909291 | Human | Breast | IDC | 6.73e-04 | 4.47e-01 | 0.1753 |
| 10398 | MYL9 | GSM4909294 | Human | Breast | IDC | 5.30e-07 | -2.11e-01 | 0.2022 |
| 10398 | MYL9 | GSM4909295 | Human | Breast | IDC | 7.51e-13 | 7.29e-01 | 0.0898 |
| 10398 | MYL9 | GSM4909296 | Human | Breast | IDC | 1.17e-02 | -1.53e-01 | 0.1524 |
| 10398 | MYL9 | GSM4909311 | Human | Breast | IDC | 1.62e-05 | -8.97e-02 | 0.1534 |
| 10398 | MYL9 | GSM4909315 | Human | Breast | IDC | 8.30e-08 | -2.25e-01 | 0.21 |
| 10398 | MYL9 | GSM4909319 | Human | Breast | IDC | 2.85e-07 | -1.49e-01 | 0.1563 |
| 10398 | MYL9 | GSM4909321 | Human | Breast | IDC | 1.81e-03 | -1.28e-01 | 0.1559 |
| 10398 | MYL9 | brca3 | Human | Breast | Precancer | 3.66e-09 | 3.96e-01 | -0.0263 |
| 10398 | MYL9 | brca10 | Human | Breast | Precancer | 7.92e-05 | 4.60e-01 | -0.0029 |
| 10398 | MYL9 | DCIS2 | Human | Breast | DCIS | 2.70e-11 | 4.85e-02 | 0.0085 |
| 10398 | MYL9 | AEH-subject1 | Human | Endometrium | AEH | 1.10e-34 | -8.34e-01 | -0.3059 |
| 10398 | MYL9 | AEH-subject2 | Human | Endometrium | AEH | 2.34e-31 | -7.85e-01 | -0.2525 |
| 10398 | MYL9 | AEH-subject3 | Human | Endometrium | AEH | 5.68e-27 | -7.60e-01 | -0.2576 |
| 10398 | MYL9 | AEH-subject4 | Human | Endometrium | AEH | 2.19e-27 | -7.98e-01 | -0.2657 |
| 10398 | MYL9 | AEH-subject5 | Human | Endometrium | AEH | 6.06e-39 | -8.26e-01 | -0.2953 |
| 10398 | MYL9 | EEC-subject1 | Human | Endometrium | EEC | 4.07e-39 | -8.78e-01 | -0.2682 |
| Page: 1 2 3 4 5 6 7 8 9 |
| Tissue | Expression Dynamics | Abbreviation |
| Breast |  | IDC: Invasive ductal carcinoma |
| DCIS: Ductal carcinoma in situ | ||
| Precancer(BRCA1-mut): Precancerous lesion from BRCA1 mutation carriers | ||
| Endometrium | 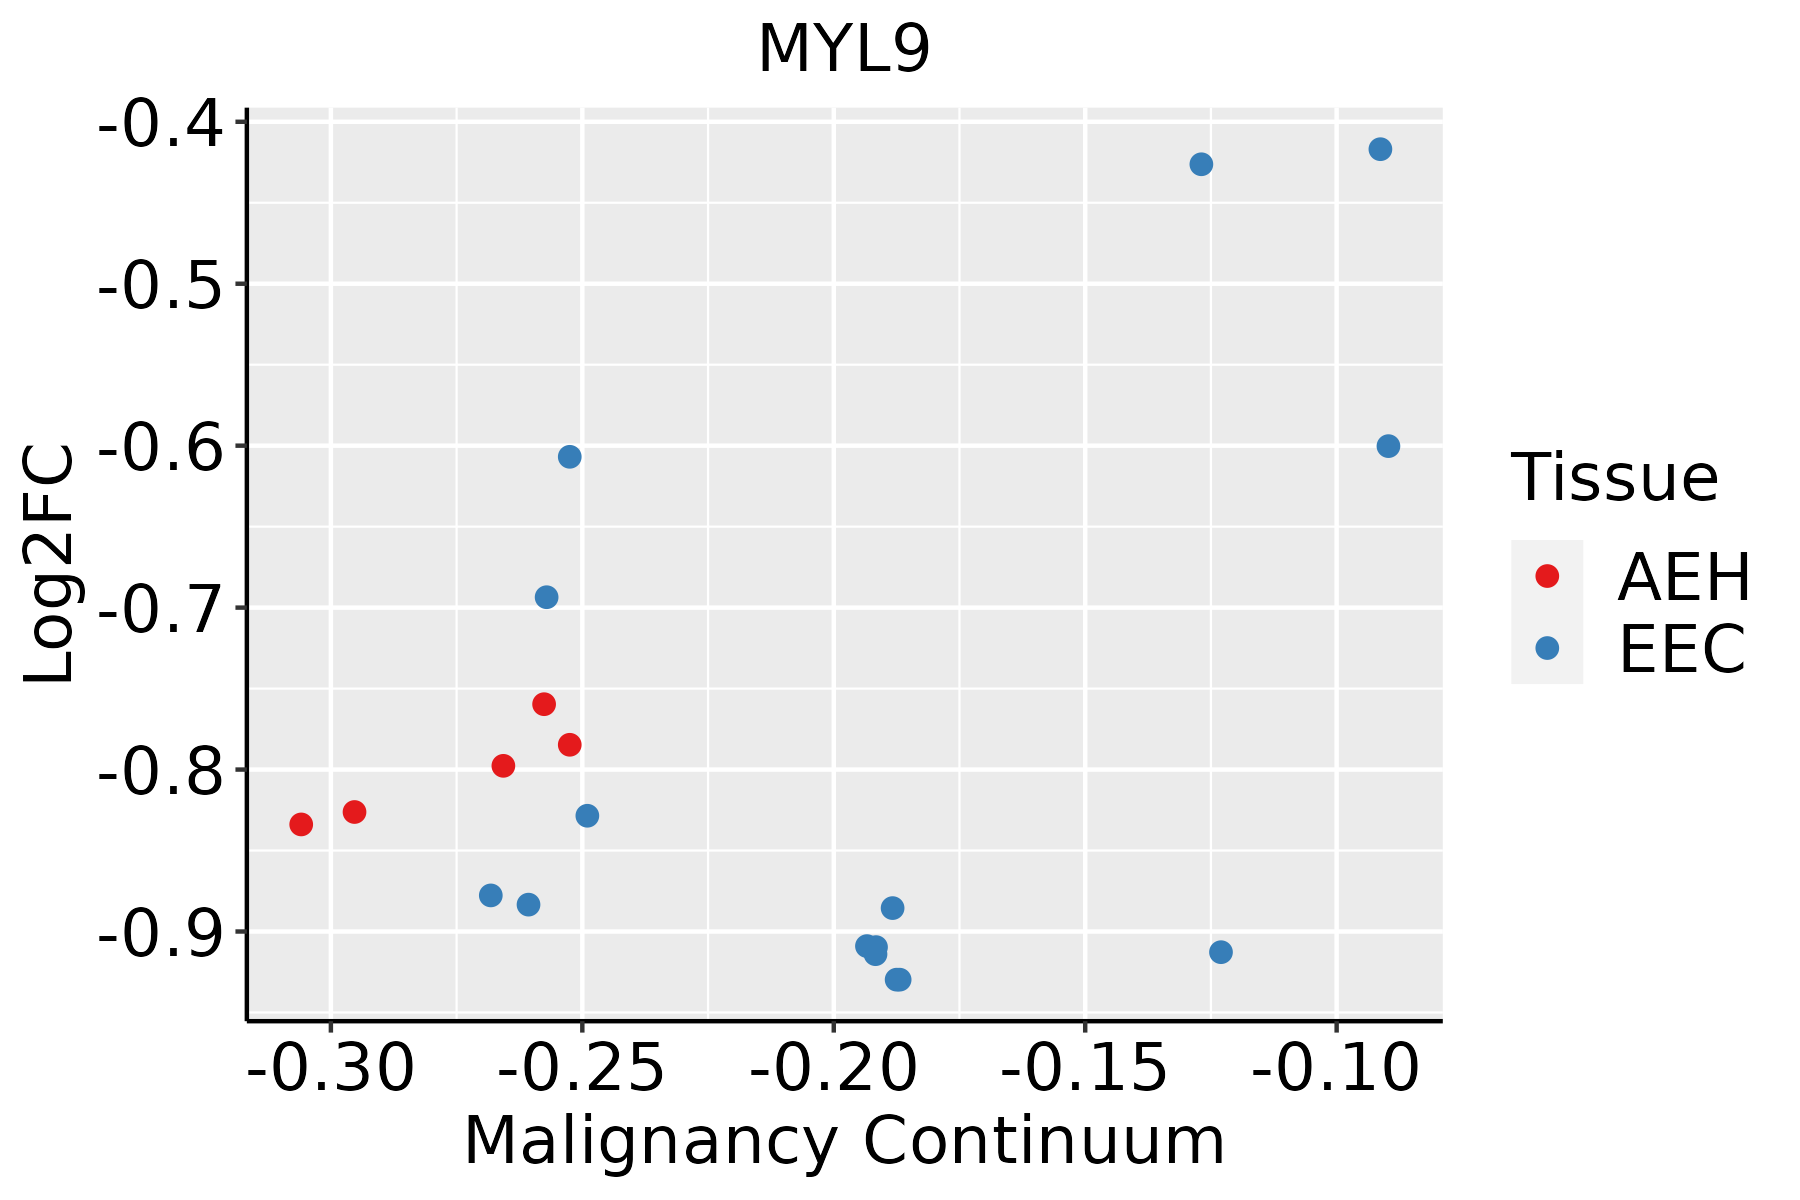 | AEH: Atypical endometrial hyperplasia |
| EEC: Endometrioid Cancer | ||
| Esophagus | 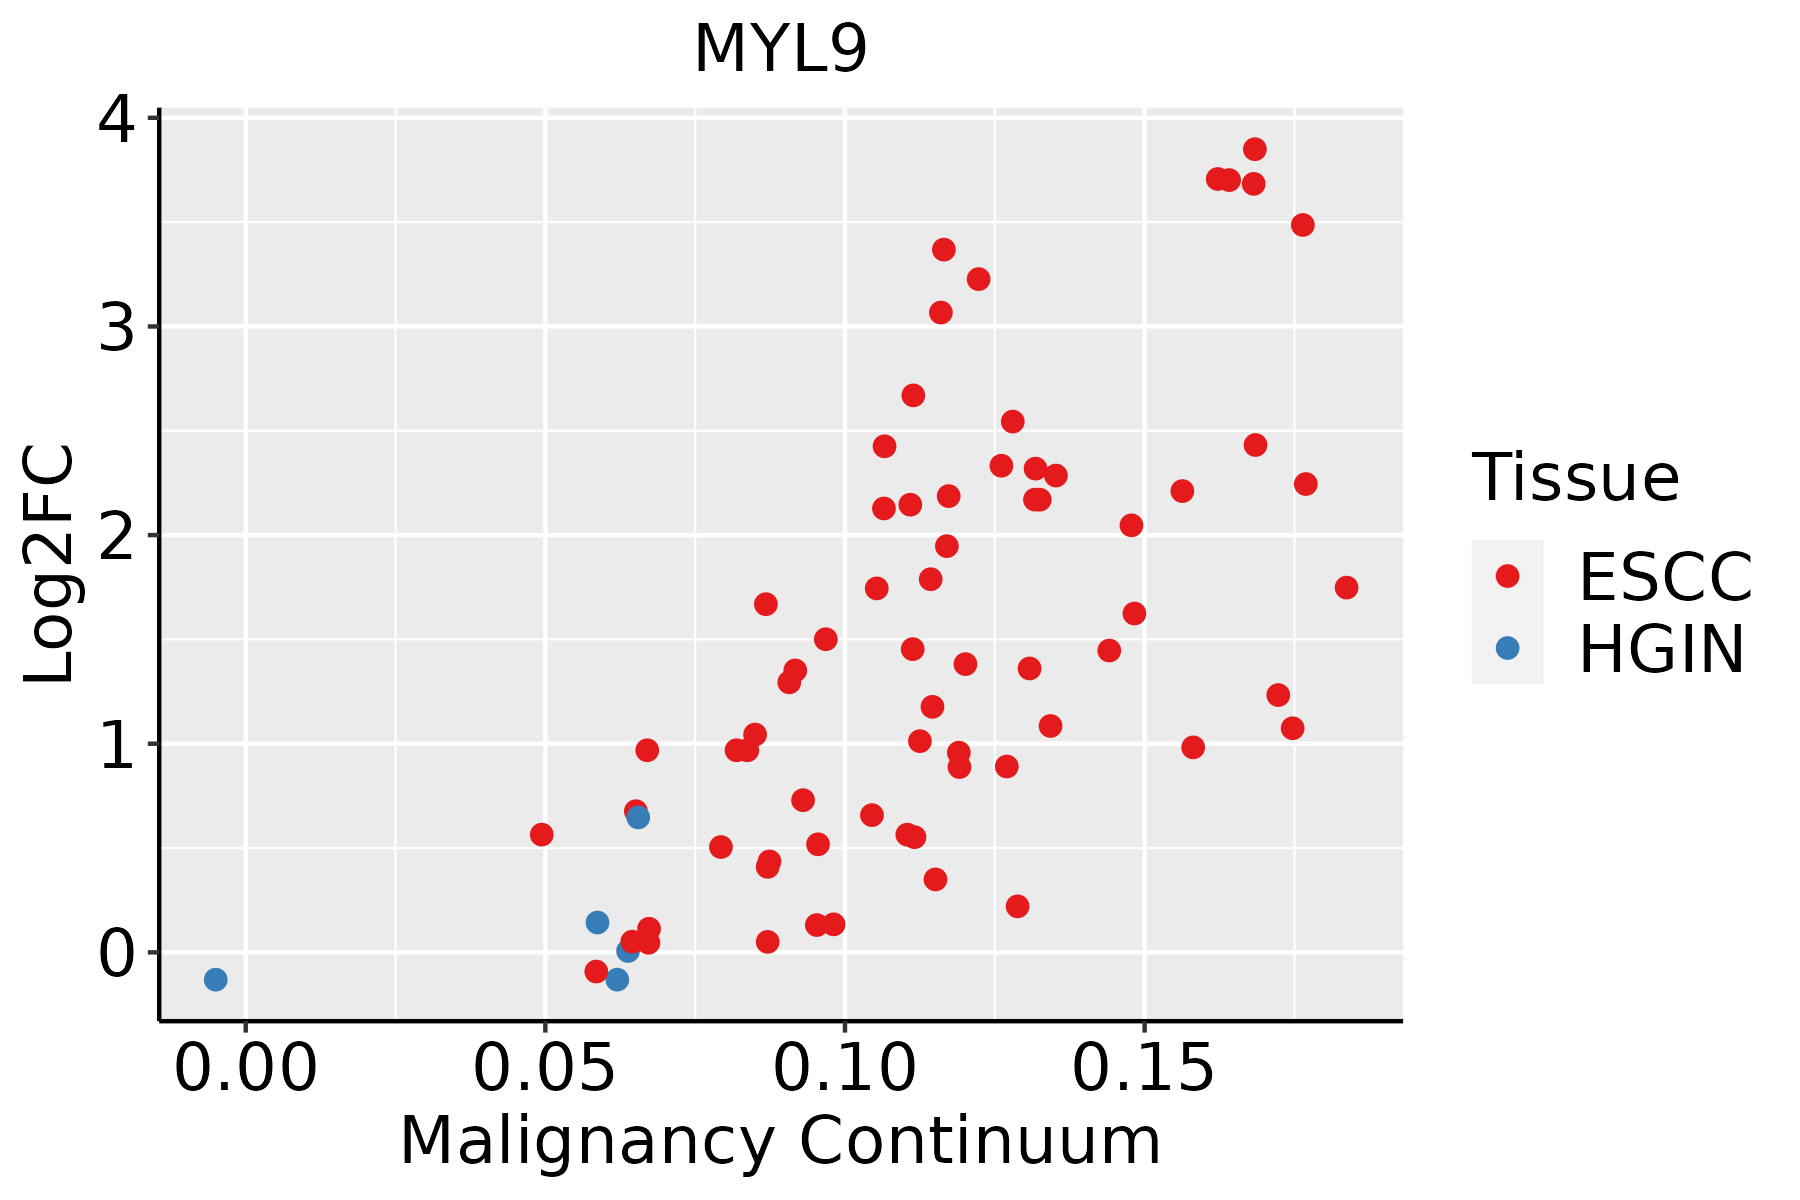 | ESCC: Esophageal squamous cell carcinoma |
| HGIN: High-grade intraepithelial neoplasias | ||
| LGIN: Low-grade intraepithelial neoplasias | ||
| Liver | 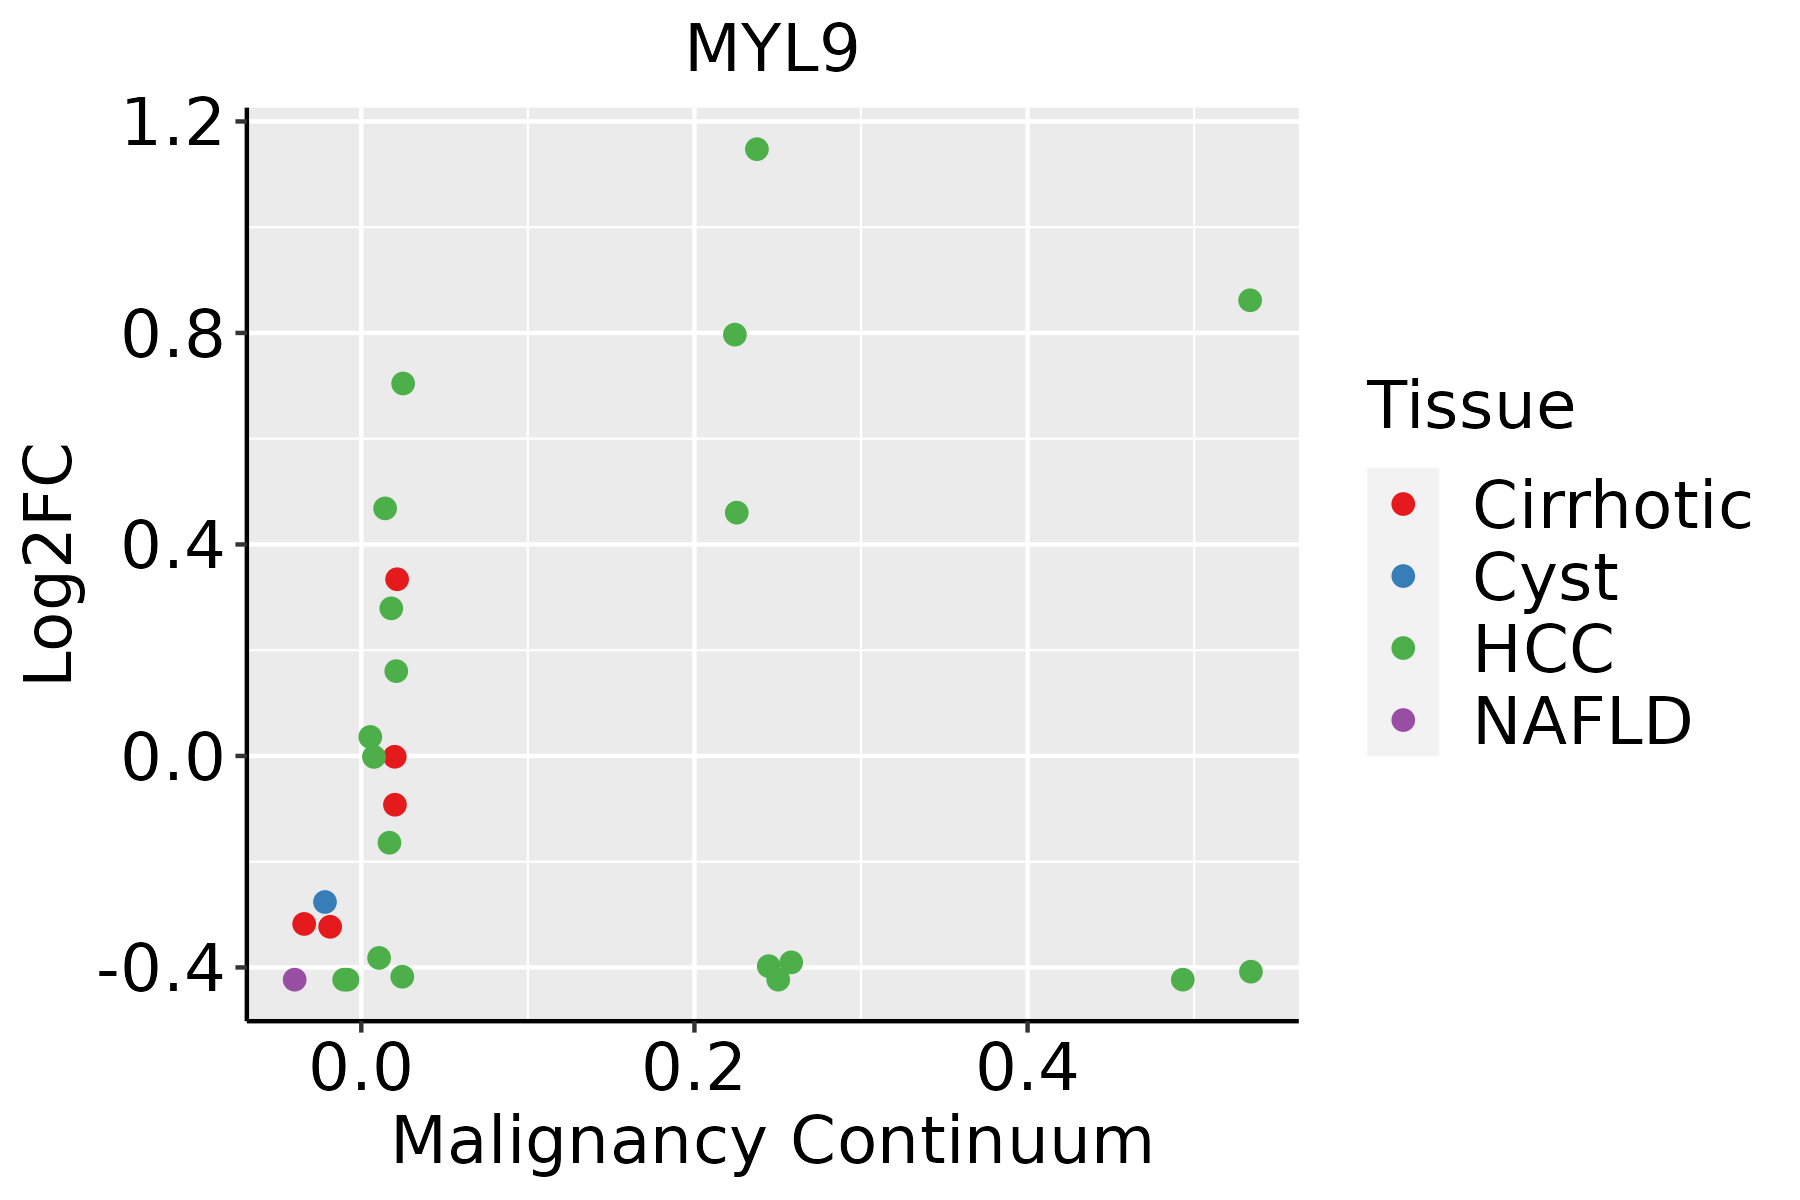 | HCC: Hepatocellular carcinoma |
| NAFLD: Non-alcoholic fatty liver disease | ||
| Oral Cavity |  | EOLP: Erosive Oral lichen planus |
| LP: leukoplakia | ||
| NEOLP: Non-erosive oral lichen planus | ||
| OSCC: Oral squamous cell carcinoma | ||
| Prostate | 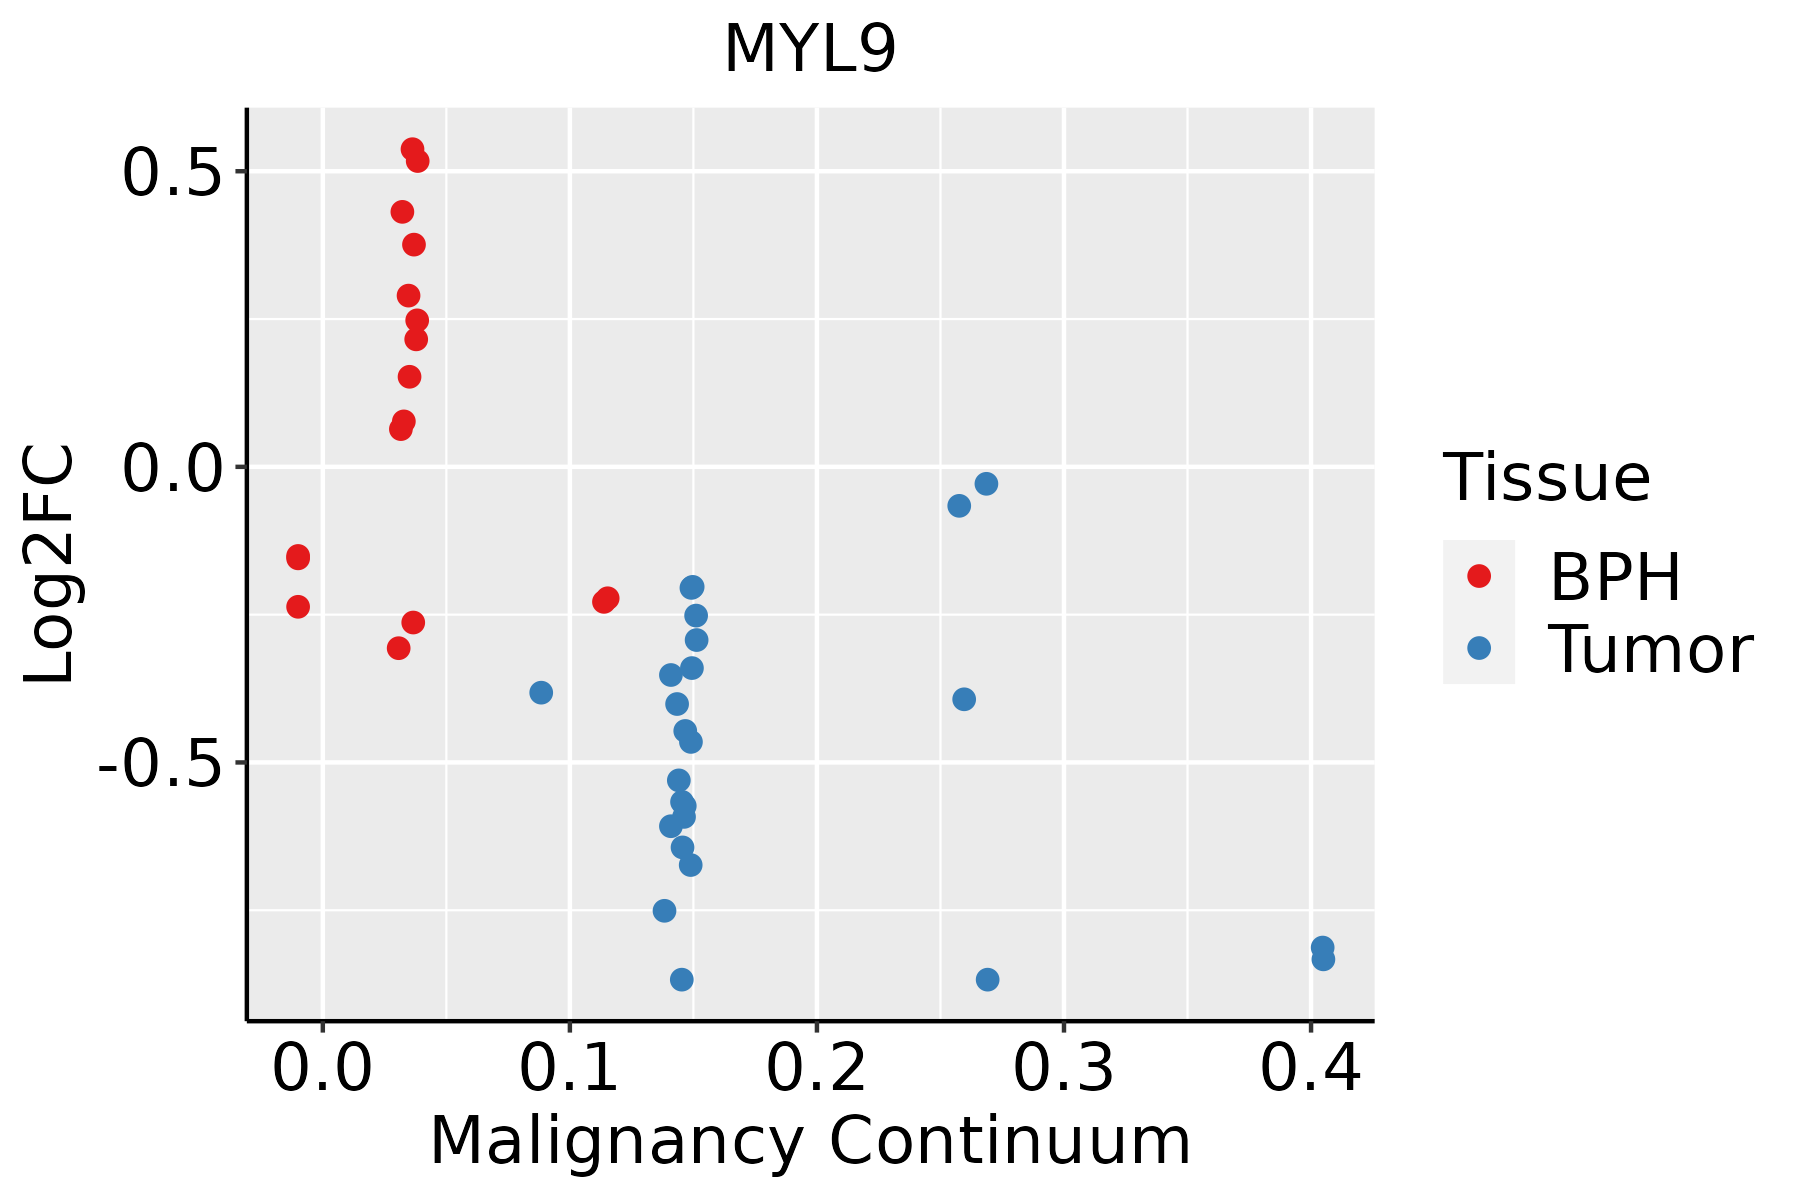 | BPH: Benign Prostatic Hyperplasia |
| Skin | 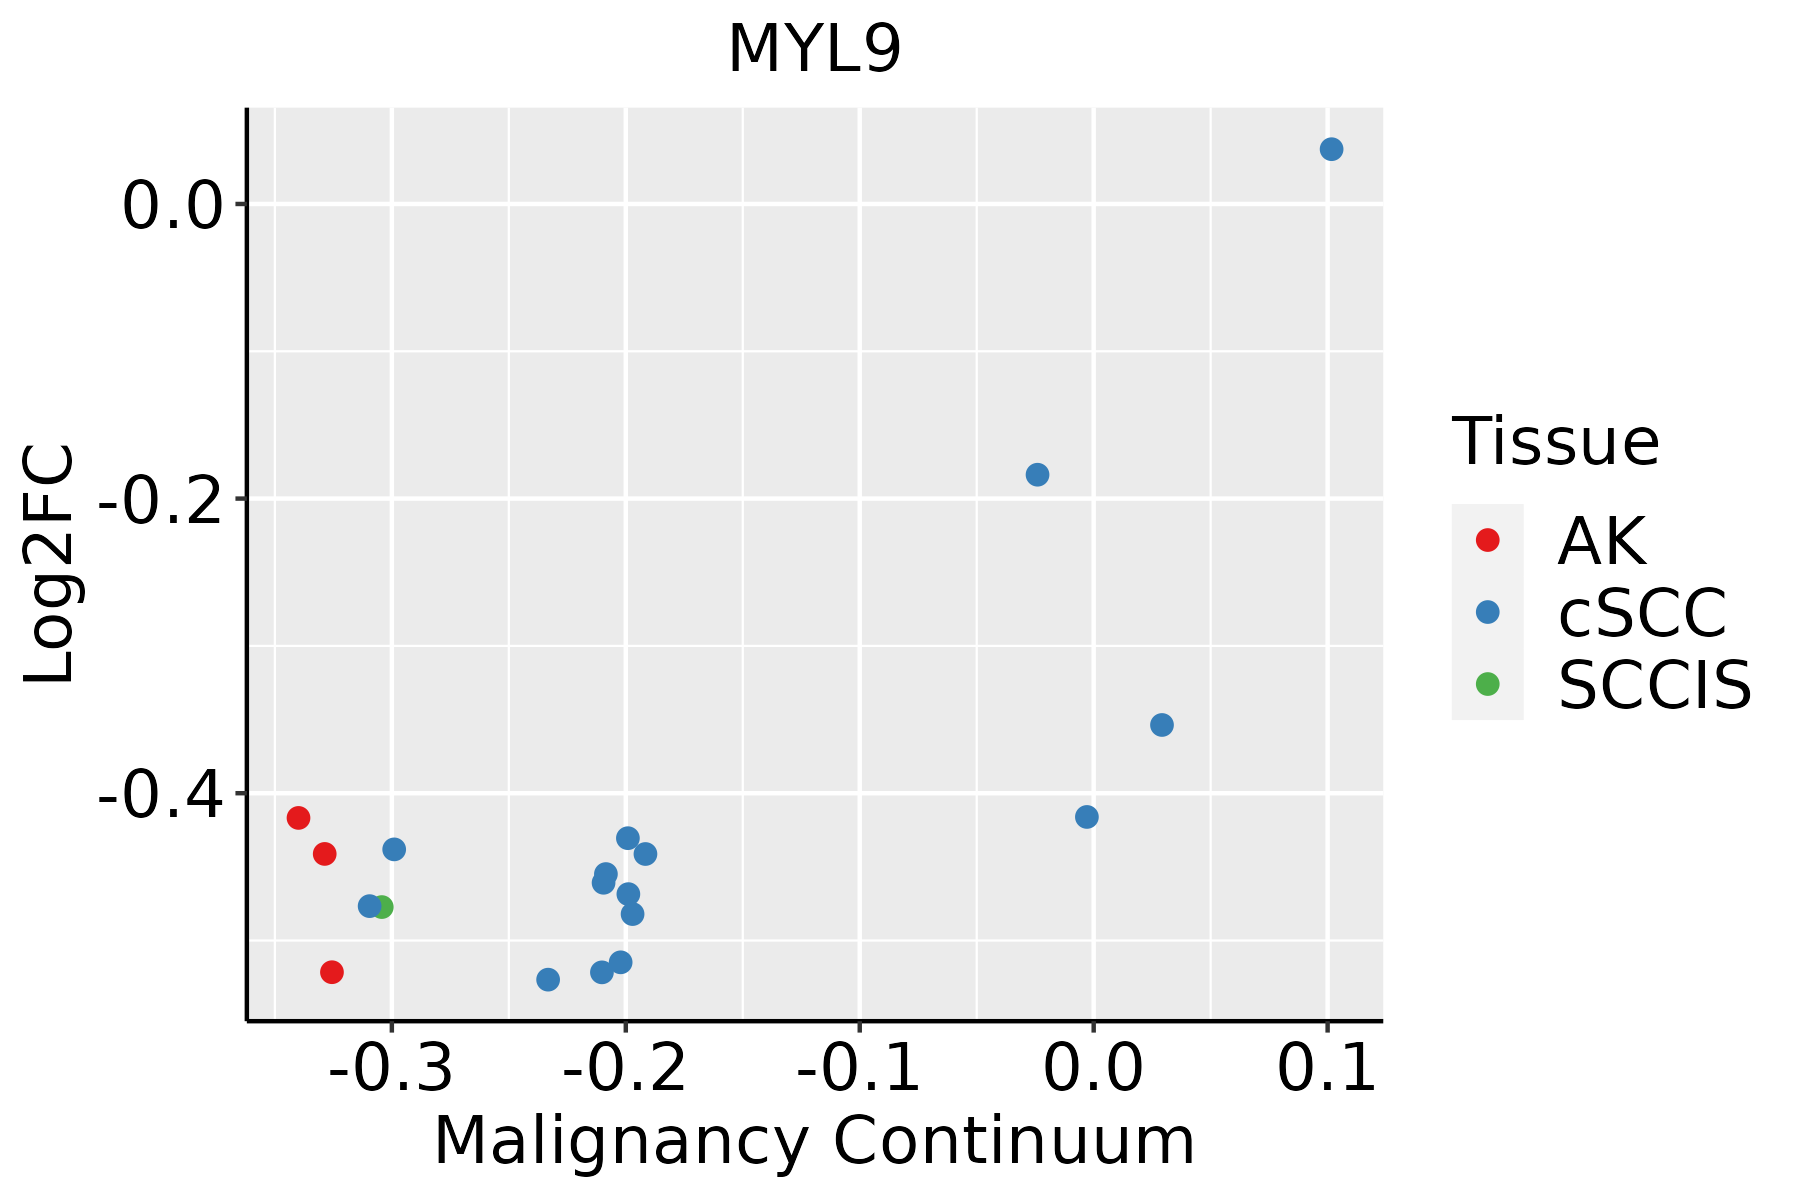 | AK: Actinic keratosis |
| cSCC: Cutaneous squamous cell carcinoma | ||
| SCCIS:squamous cell carcinoma in situ | ||
| Thyroid | 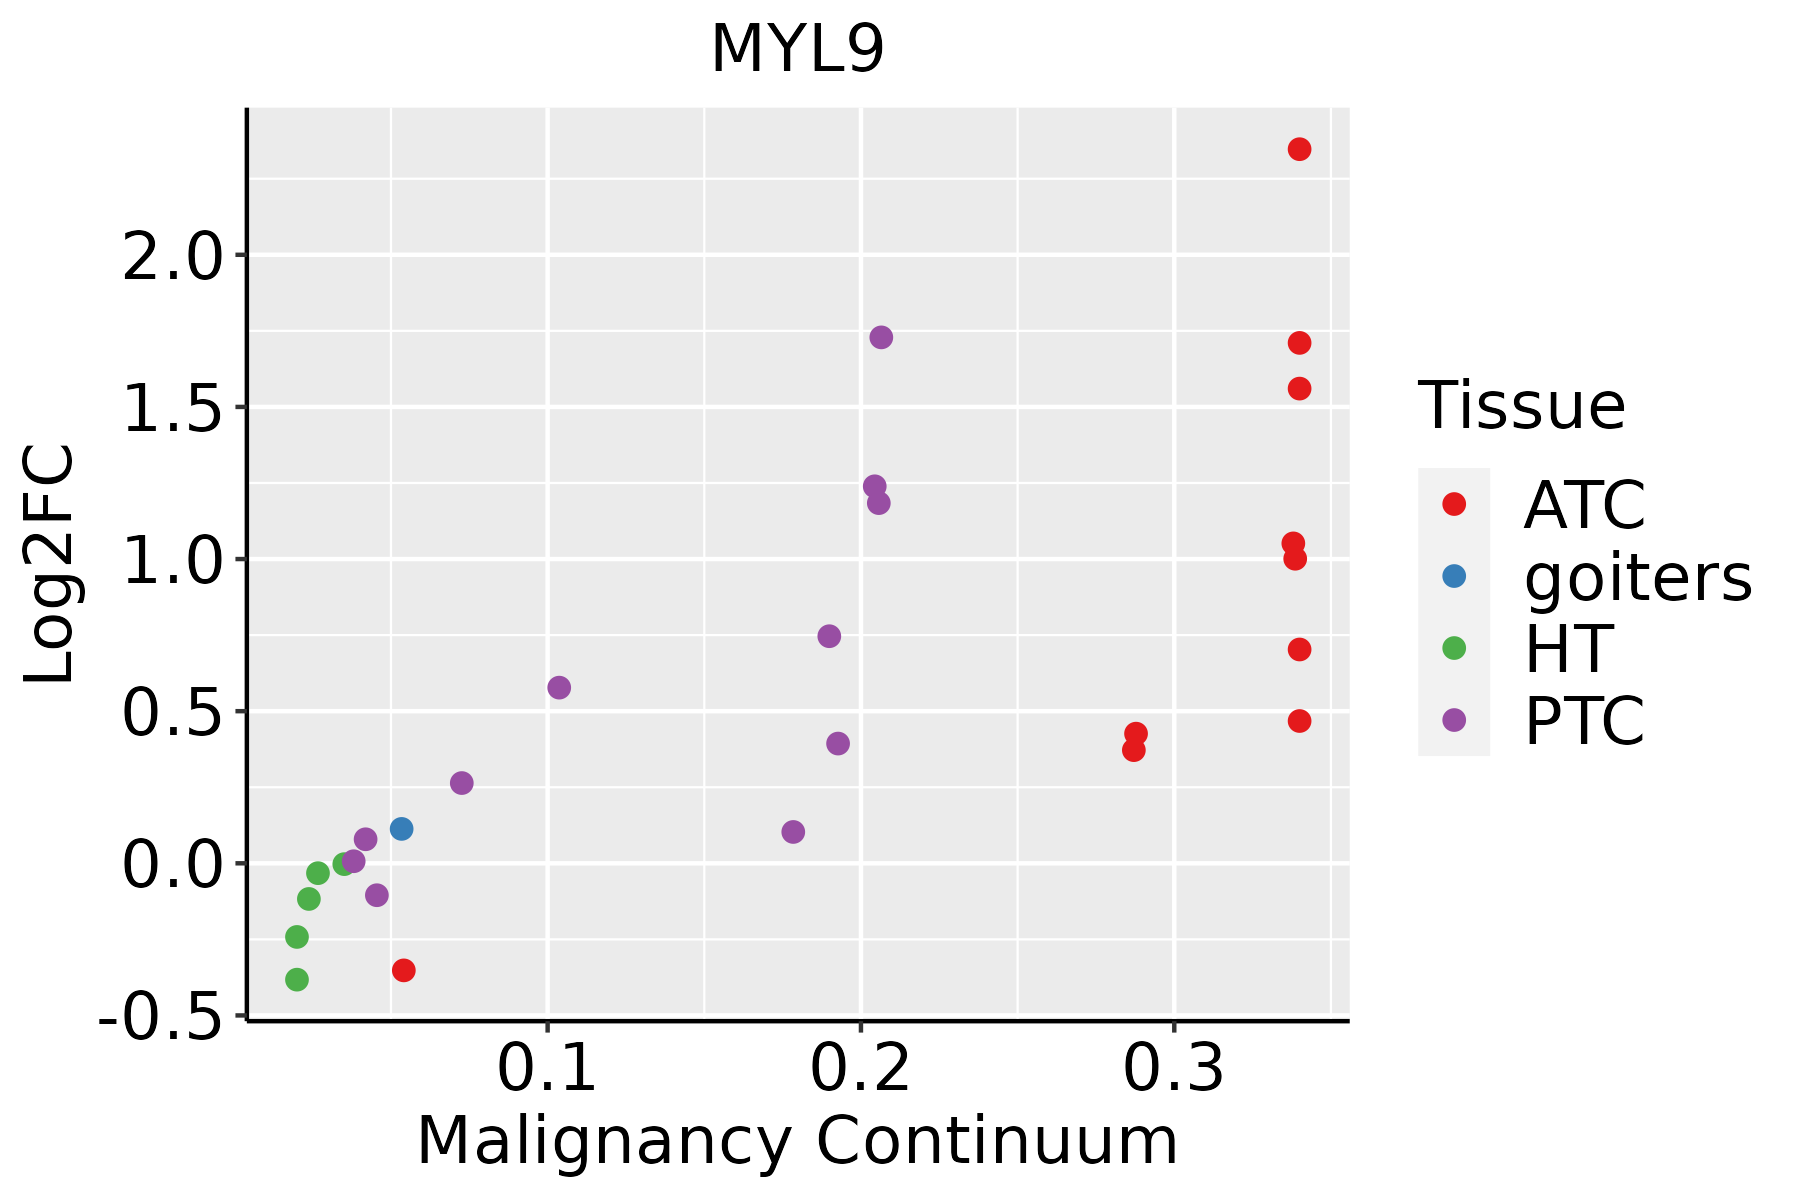 | ATC: Anaplastic thyroid cancer |
| HT: Hashimoto's thyroiditis | ||
| PTC: Papillary thyroid cancer |
| ∗log2FC in expression of this searched gene in stem-like cells from each diseased tissue sample relative to stem-like cells in normal samples in each tissue plotted against the malignancy continuum. Samples are colored based on if they are from different disease stage. |
Top |
Malignant transformation related pathway analysis |
| Find out the enriched GO biological processes and KEGG pathways involved in transition from healthy to precancer to cancer |
| Tissue | Disease Stage | Enriched GO biological Processes |
| Colorectum | AD |  |
| Colorectum | SER |  |
| Colorectum | MSS |  |
| Colorectum | MSI-H |  |
| Colorectum | FAP |  |
| ∗Top 15 enriched GO BP terms are showed in the bar plot of each disease state in each tissue. Each row represents a significant GO biological process which is colored according to the -log10(p.adjust). |
| Page: 1 2 3 4 5 6 7 8 9 |
| GO ID | Tissue | Disease Stage | Description | Gene Ratio | Bg Ratio | pvalue | p.adjust | Count |
| GO:00341099 | Breast | Precancer | homotypic cell-cell adhesion | 18/1080 | 90/18723 | 3.15e-06 | 1.03e-04 | 18 |
| GO:00420609 | Breast | Precancer | wound healing | 48/1080 | 422/18723 | 5.48e-06 | 1.63e-04 | 48 |
| GO:00508789 | Breast | Precancer | regulation of body fluid levels | 40/1080 | 379/18723 | 1.68e-04 | 2.77e-03 | 40 |
| GO:00705278 | Breast | Precancer | platelet aggregation | 12/1080 | 67/18723 | 4.02e-04 | 5.43e-03 | 12 |
| GO:00075995 | Breast | Precancer | hemostasis | 24/1080 | 222/18723 | 2.31e-03 | 2.15e-02 | 24 |
| GO:00075965 | Breast | Precancer | blood coagulation | 23/1080 | 217/18723 | 3.61e-03 | 2.98e-02 | 23 |
| GO:00508175 | Breast | Precancer | coagulation | 23/1080 | 222/18723 | 4.78e-03 | 3.64e-02 | 23 |
| GO:0030168 | Breast | Precancer | platelet activation | 15/1080 | 123/18723 | 4.80e-03 | 3.64e-02 | 15 |
| GO:003410913 | Breast | IDC | homotypic cell-cell adhesion | 20/1434 | 90/18723 | 1.20e-05 | 3.17e-04 | 20 |
| GO:004206014 | Breast | IDC | wound healing | 55/1434 | 422/18723 | 7.27e-05 | 1.45e-03 | 55 |
| GO:005087813 | Breast | IDC | regulation of body fluid levels | 50/1434 | 379/18723 | 1.12e-04 | 2.10e-03 | 50 |
| GO:007052713 | Breast | IDC | platelet aggregation | 12/1434 | 67/18723 | 4.53e-03 | 3.49e-02 | 12 |
| GO:00030125 | Breast | IDC | muscle system process | 50/1434 | 452/18723 | 5.52e-03 | 4.05e-02 | 50 |
| GO:005087823 | Breast | DCIS | regulation of body fluid levels | 50/1390 | 379/18723 | 5.17e-05 | 1.06e-03 | 50 |
| GO:004206024 | Breast | DCIS | wound healing | 54/1390 | 422/18723 | 6.09e-05 | 1.22e-03 | 54 |
| GO:003410923 | Breast | DCIS | homotypic cell-cell adhesion | 18/1390 | 90/18723 | 9.33e-05 | 1.71e-03 | 18 |
| GO:000301212 | Breast | DCIS | muscle system process | 50/1390 | 452/18723 | 3.02e-03 | 2.57e-02 | 50 |
| GO:004206016 | Endometrium | AEH | wound healing | 91/2100 | 422/18723 | 4.85e-10 | 4.61e-08 | 91 |
| GO:003410915 | Endometrium | AEH | homotypic cell-cell adhesion | 26/2100 | 90/18723 | 3.75e-06 | 1.00e-04 | 26 |
| GO:00030126 | Endometrium | AEH | muscle system process | 78/2100 | 452/18723 | 6.89e-05 | 1.06e-03 | 78 |
| Page: 1 2 3 4 5 6 7 |
| Pathway ID | Tissue | Disease Stage | Description | Gene Ratio | Bg Ratio | pvalue | p.adjust | qvalue | Count |
| hsa0513118 | Breast | Precancer | Shigellosis | 44/684 | 247/8465 | 3.91e-07 | 6.86e-06 | 5.26e-06 | 44 |
| hsa0453018 | Breast | Precancer | Tight junction | 31/684 | 169/8465 | 1.13e-05 | 1.26e-04 | 9.64e-05 | 31 |
| hsa0467018 | Breast | Precancer | Leukocyte transendothelial migration | 20/684 | 114/8465 | 7.26e-04 | 5.33e-03 | 4.09e-03 | 20 |
| hsa0452018 | Breast | Precancer | Adherens junction | 17/684 | 93/8465 | 1.11e-03 | 7.57e-03 | 5.80e-03 | 17 |
| hsa0513119 | Breast | Precancer | Shigellosis | 44/684 | 247/8465 | 3.91e-07 | 6.86e-06 | 5.26e-06 | 44 |
| hsa0453019 | Breast | Precancer | Tight junction | 31/684 | 169/8465 | 1.13e-05 | 1.26e-04 | 9.64e-05 | 31 |
| hsa0467019 | Breast | Precancer | Leukocyte transendothelial migration | 20/684 | 114/8465 | 7.26e-04 | 5.33e-03 | 4.09e-03 | 20 |
| hsa0452019 | Breast | Precancer | Adherens junction | 17/684 | 93/8465 | 1.11e-03 | 7.57e-03 | 5.80e-03 | 17 |
| hsa0513224 | Breast | IDC | Salmonella infection | 55/867 | 249/8465 | 2.07e-08 | 4.49e-07 | 3.36e-07 | 55 |
| hsa0453024 | Breast | IDC | Tight junction | 38/867 | 169/8465 | 2.07e-06 | 3.20e-05 | 2.39e-05 | 38 |
| hsa0513124 | Breast | IDC | Shigellosis | 47/867 | 247/8465 | 1.78e-05 | 2.00e-04 | 1.49e-04 | 47 |
| hsa0467024 | Breast | IDC | Leukocyte transendothelial migration | 21/867 | 114/8465 | 5.41e-03 | 3.13e-02 | 2.34e-02 | 21 |
| hsa0481014 | Breast | IDC | Regulation of actin cytoskeleton | 36/867 | 229/8465 | 5.79e-03 | 3.13e-02 | 2.34e-02 | 36 |
| hsa045109 | Breast | IDC | Focal adhesion | 32/867 | 203/8465 | 8.60e-03 | 4.23e-02 | 3.17e-02 | 32 |
| hsa0513234 | Breast | IDC | Salmonella infection | 55/867 | 249/8465 | 2.07e-08 | 4.49e-07 | 3.36e-07 | 55 |
| hsa0453034 | Breast | IDC | Tight junction | 38/867 | 169/8465 | 2.07e-06 | 3.20e-05 | 2.39e-05 | 38 |
| hsa0513134 | Breast | IDC | Shigellosis | 47/867 | 247/8465 | 1.78e-05 | 2.00e-04 | 1.49e-04 | 47 |
| hsa0467034 | Breast | IDC | Leukocyte transendothelial migration | 21/867 | 114/8465 | 5.41e-03 | 3.13e-02 | 2.34e-02 | 21 |
| hsa0481015 | Breast | IDC | Regulation of actin cytoskeleton | 36/867 | 229/8465 | 5.79e-03 | 3.13e-02 | 2.34e-02 | 36 |
| hsa0451013 | Breast | IDC | Focal adhesion | 32/867 | 203/8465 | 8.60e-03 | 4.23e-02 | 3.17e-02 | 32 |
| Page: 1 2 3 4 5 6 7 8 9 |
Top |
Cell-cell communication analysis |
| Identification of potential cell-cell interactions between two cell types and their ligand-receptor pairs for different disease states |
| Ligand | Receptor | LRpair | Pathway | Tissue | Disease Stage |
| Page: 1 |
Top |
Single-cell gene regulatory network inference analysis |
| Find out the significant the regulons (TFs) and the target genes of each regulon across cell types for different disease states |
| TF | Cell Type | Tissue | Disease Stage | Target Gene | RSS | Regulon Activity |
| ∗The dot plots of a searched regulon are shown for all cell subpopulations in each disease state of each tissue based on the regulon specific score inferred using pySCENIC and by calculating the average expression. |
| Page: 1 |
Top |
Somatic mutation of malignant transformation related genes |
| Annotation of somatic variants for genes involved in malignant transformation |
| Hugo Symbol | Variant Class | Variant Classification | dbSNP RS | HGVSc | HGVSp | HGVSp Short | SWISSPROT | BIOTYPE | SIFT | PolyPhen | Tumor Sample Barcode | Tissue | Histology | Sex | Age | Stage | Therapy Types | Drugs | Outcome |
| MYL9 | SNV | Missense_Mutation | c.228N>C | p.Glu76Asp | p.E76D | P24844 | protein_coding | tolerated(0.06) | benign(0.007) | TCGA-E9-A22A-01 | Breast | breast invasive carcinoma | Female | >=65 | I/II | Hormone Therapy | tamoxiphen | SD | |
| MYL9 | SNV | Missense_Mutation | rs768626963 | c.179C>T | p.Ser60Leu | p.S60L | P24844 | protein_coding | deleterious(0) | probably_damaging(0.978) | TCGA-JX-A3PZ-01 | Cervix | cervical & endocervical cancer | Female | <65 | I/II | Unknown | Unknown | PD |
| MYL9 | SNV | Missense_Mutation | novel | c.409N>A | p.Glu137Lys | p.E137K | P24844 | protein_coding | deleterious(0) | possibly_damaging(0.771) | TCGA-VS-A958-01 | Cervix | cervical & endocervical cancer | Female | <65 | I/II | Chemotherapy | cisplatin | CR |
| MYL9 | SNV | Missense_Mutation | novel | c.17C>T | p.Ala6Val | p.A6V | P24844 | protein_coding | deleterious(0.03) | benign(0.04) | TCGA-AA-A02E-01 | Colorectum | colon adenocarcinoma | Female | >=65 | III/IV | Unknown | Unknown | PD |
| MYL9 | SNV | Missense_Mutation | c.20N>G | p.Lys7Arg | p.K7R | P24844 | protein_coding | tolerated(0.1) | benign(0.229) | TCGA-AM-5821-01 | Colorectum | colon adenocarcinoma | Female | >=65 | I/II | Unknown | Unknown | SD | |
| MYL9 | SNV | Missense_Mutation | c.361N>A | p.Asp121Asn | p.D121N | P24844 | protein_coding | tolerated(0.09) | benign(0.111) | TCGA-AG-4001-01 | Colorectum | rectum adenocarcinoma | Female | >=65 | I/II | Unknown | Unknown | SD | |
| MYL9 | SNV | Missense_Mutation | c.40N>T | p.Arg14Trp | p.R14W | P24844 | protein_coding | deleterious(0) | possibly_damaging(0.609) | TCGA-AG-A02N-01 | Colorectum | rectum adenocarcinoma | Male | >=65 | I/II | Chemotherapy | folinic | CR | |
| MYL9 | SNV | Missense_Mutation | c.351N>A | p.Phe117Leu | p.F117L | P24844 | protein_coding | tolerated(0.66) | benign(0) | TCGA-AH-6643-01 | Colorectum | rectum adenocarcinoma | Male | <65 | III/IV | Chemotherapy | oxaliplatin | PD | |
| MYL9 | SNV | Missense_Mutation | rs766224371 | c.233N>T | p.Pro78Leu | p.P78L | P24844 | protein_coding | deleterious(0.03) | benign(0.051) | TCGA-A5-A2K3-01 | Endometrium | uterine corpus endometrioid carcinoma | Female | >=65 | I/II | Chemotherapy | carboplatin | SD |
| MYL9 | SNV | Missense_Mutation | rs768877867 | c.49N>T | p.Arg17Trp | p.R17W | P24844 | protein_coding | tolerated(0.07) | possibly_damaging(0.683) | TCGA-AJ-A3EK-01 | Endometrium | uterine corpus endometrioid carcinoma | Female | <65 | I/II | Chemotherapy | carboplatin | CR |
| Page: 1 2 3 |
Top |
Related drugs of malignant transformation related genes |
| Identification of chemicals and drugs interact with genes involved in malignant transfromation |
| (DGIdb 4.0) |
| Entrez ID | Symbol | Category | Interaction Types | Drug Claim Name | Drug Name | PMIDs |
| Page: 1 |

Copyright 2023-Present -The University of Texas Health Science Center at Houston |