
|
|||||
|
 | |
| |
| |
| |
| |
| |
|
Gene: MYL6B |
Gene summary for MYL6B |
| Gene information | Species | Human | Gene symbol | MYL6B | Gene ID | 140465 |
| Gene name | myosin light chain 6B | |
| Gene Alias | MLC1SA | |
| Cytomap | 12q13.2 | |
| Gene Type | protein-coding | GO ID | GO:0003008 | UniProtAcc | A0A024RB31 |
Top |
Malignant transformation analysis |
| Identification of the aberrant gene expression in precancerous and cancerous lesions by comparing the gene expression of stem-like cells in diseased tissues with normal stem cells |
| Entrez ID | Symbol | Replicates | Species | Organ | Tissue | Adj P-value | Log2FC | Malignancy |
| 140465 | MYL6B | AEH-subject1 | Human | Endometrium | AEH | 1.46e-05 | -2.51e-01 | -0.3059 |
| 140465 | MYL6B | AEH-subject2 | Human | Endometrium | AEH | 4.45e-13 | -4.36e-01 | -0.2525 |
| 140465 | MYL6B | AEH-subject3 | Human | Endometrium | AEH | 2.36e-15 | -3.11e-01 | -0.2576 |
| 140465 | MYL6B | AEH-subject4 | Human | Endometrium | AEH | 1.32e-17 | -5.52e-01 | -0.2657 |
| 140465 | MYL6B | AEH-subject5 | Human | Endometrium | AEH | 3.42e-24 | -5.35e-01 | -0.2953 |
| 140465 | MYL6B | EEC-subject1 | Human | Endometrium | EEC | 5.55e-21 | -4.27e-01 | -0.2682 |
| 140465 | MYL6B | EEC-subject2 | Human | Endometrium | EEC | 5.86e-13 | -3.55e-01 | -0.2607 |
| 140465 | MYL6B | EEC-subject3 | Human | Endometrium | EEC | 1.92e-52 | -5.57e-01 | -0.2525 |
| 140465 | MYL6B | EEC-subject4 | Human | Endometrium | EEC | 1.07e-19 | -5.15e-01 | -0.2571 |
| 140465 | MYL6B | EEC-subject5 | Human | Endometrium | EEC | 3.66e-12 | -3.51e-01 | -0.249 |
| 140465 | MYL6B | GSM5276934 | Human | Endometrium | EEC | 2.70e-23 | -5.08e-01 | -0.0913 |
| 140465 | MYL6B | GSM5276937 | Human | Endometrium | EEC | 7.49e-14 | -4.70e-01 | -0.0897 |
| 140465 | MYL6B | GSM6177620_NYU_UCEC1_lib1_lib1 | Human | Endometrium | EEC | 1.15e-38 | -5.35e-01 | -0.1869 |
| 140465 | MYL6B | GSM6177620_NYU_UCEC1_lib2_lib2 | Human | Endometrium | EEC | 9.42e-33 | -5.89e-01 | -0.1875 |
| 140465 | MYL6B | GSM6177620_NYU_UCEC1_lib3_lib3 | Human | Endometrium | EEC | 9.56e-41 | -6.01e-01 | -0.1883 |
| 140465 | MYL6B | GSM6177621_NYU_UCEC2_lib1_lib1 | Human | Endometrium | EEC | 1.67e-41 | -4.32e-01 | -0.1934 |
| 140465 | MYL6B | GSM6177622_NYU_UCEC3_lib1_lib1 | Human | Endometrium | EEC | 5.37e-59 | -4.71e-01 | -0.1917 |
| 140465 | MYL6B | GSM6177622_NYU_UCEC3_lib2_lib2 | Human | Endometrium | EEC | 1.73e-52 | -5.20e-01 | -0.1916 |
| 140465 | MYL6B | GSM6177623_NYU_UCEC3_Vis | Human | Endometrium | EEC | 1.58e-08 | -1.59e-01 | -0.1269 |
| 140465 | MYL6B | LZE4T | Human | Esophagus | ESCC | 9.36e-05 | 1.20e-01 | 0.0811 |
| Page: 1 2 3 4 5 6 7 8 |
| Tissue | Expression Dynamics | Abbreviation |
| Endometrium | 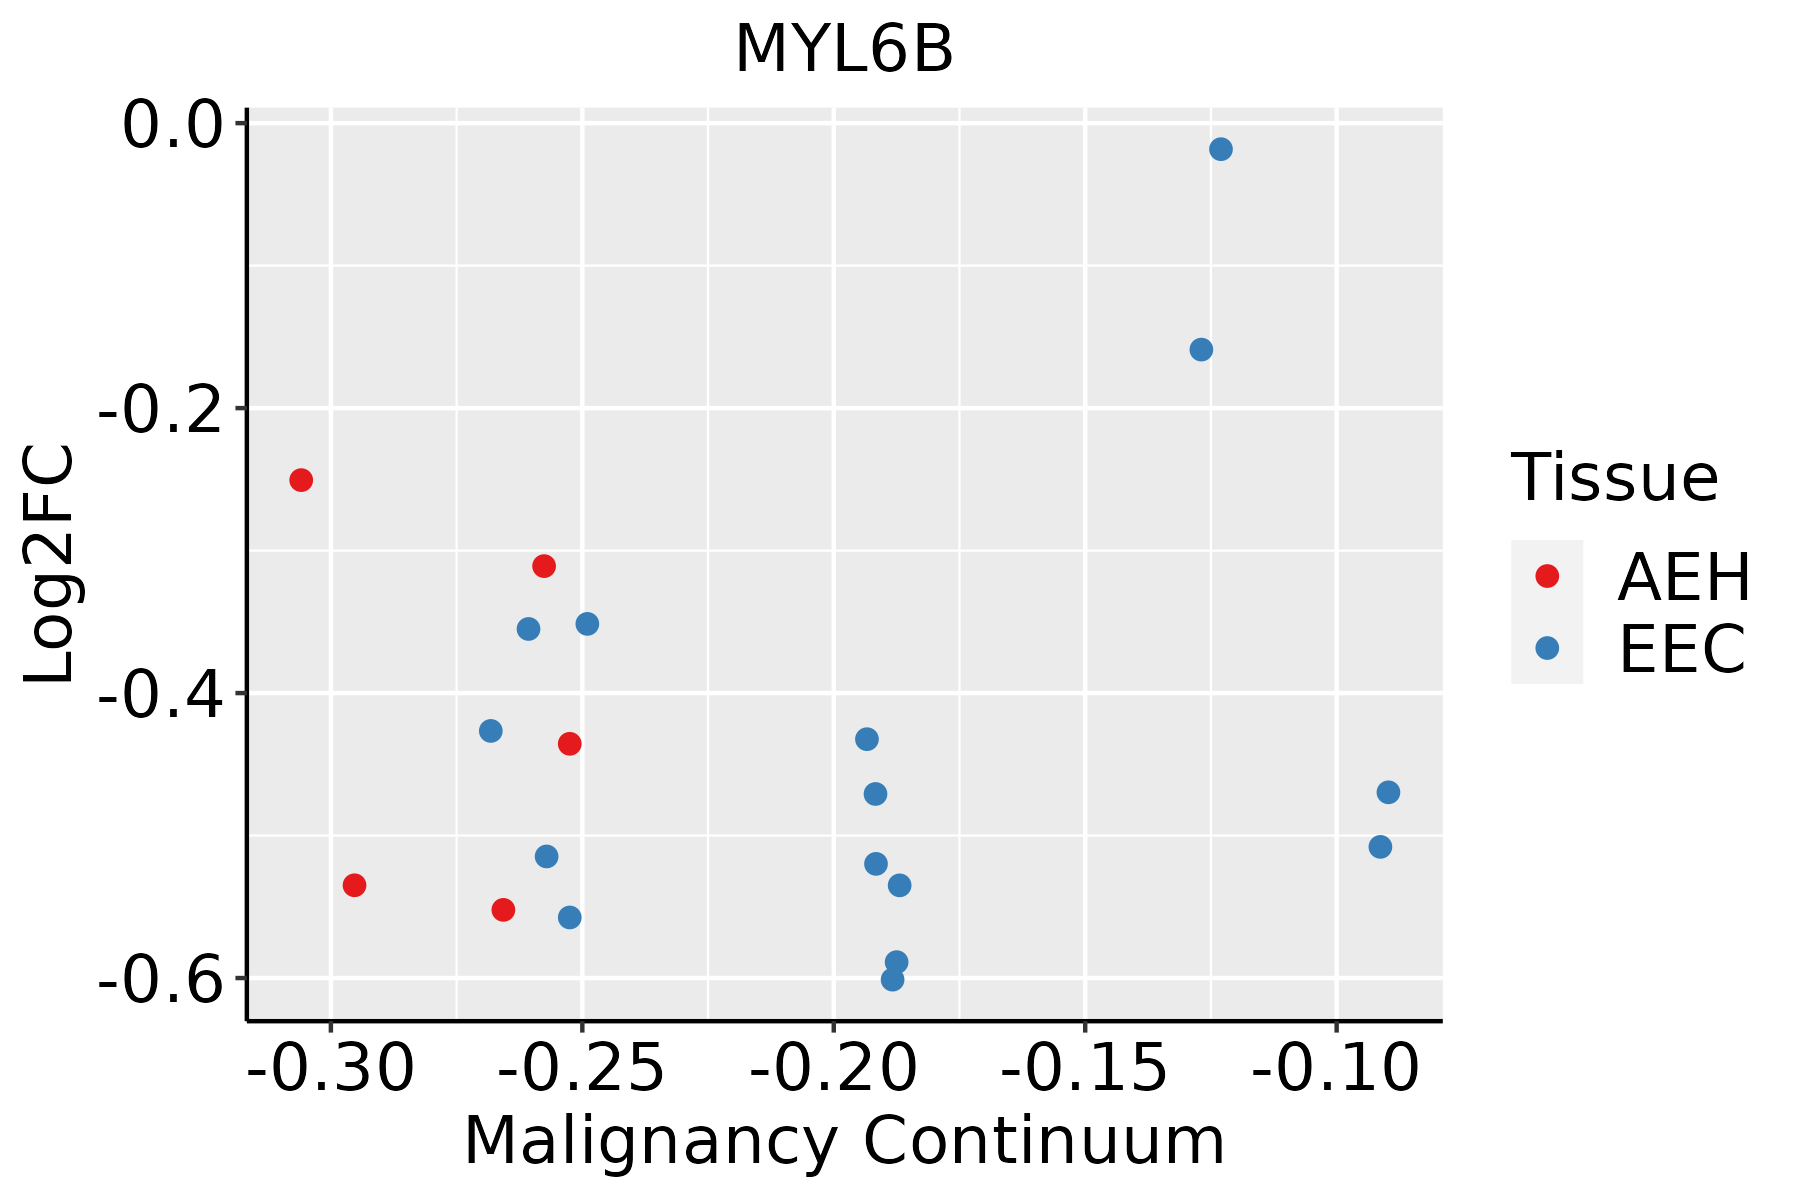 | AEH: Atypical endometrial hyperplasia |
| EEC: Endometrioid Cancer | ||
| Esophagus |  | ESCC: Esophageal squamous cell carcinoma |
| HGIN: High-grade intraepithelial neoplasias | ||
| LGIN: Low-grade intraepithelial neoplasias | ||
| Liver | 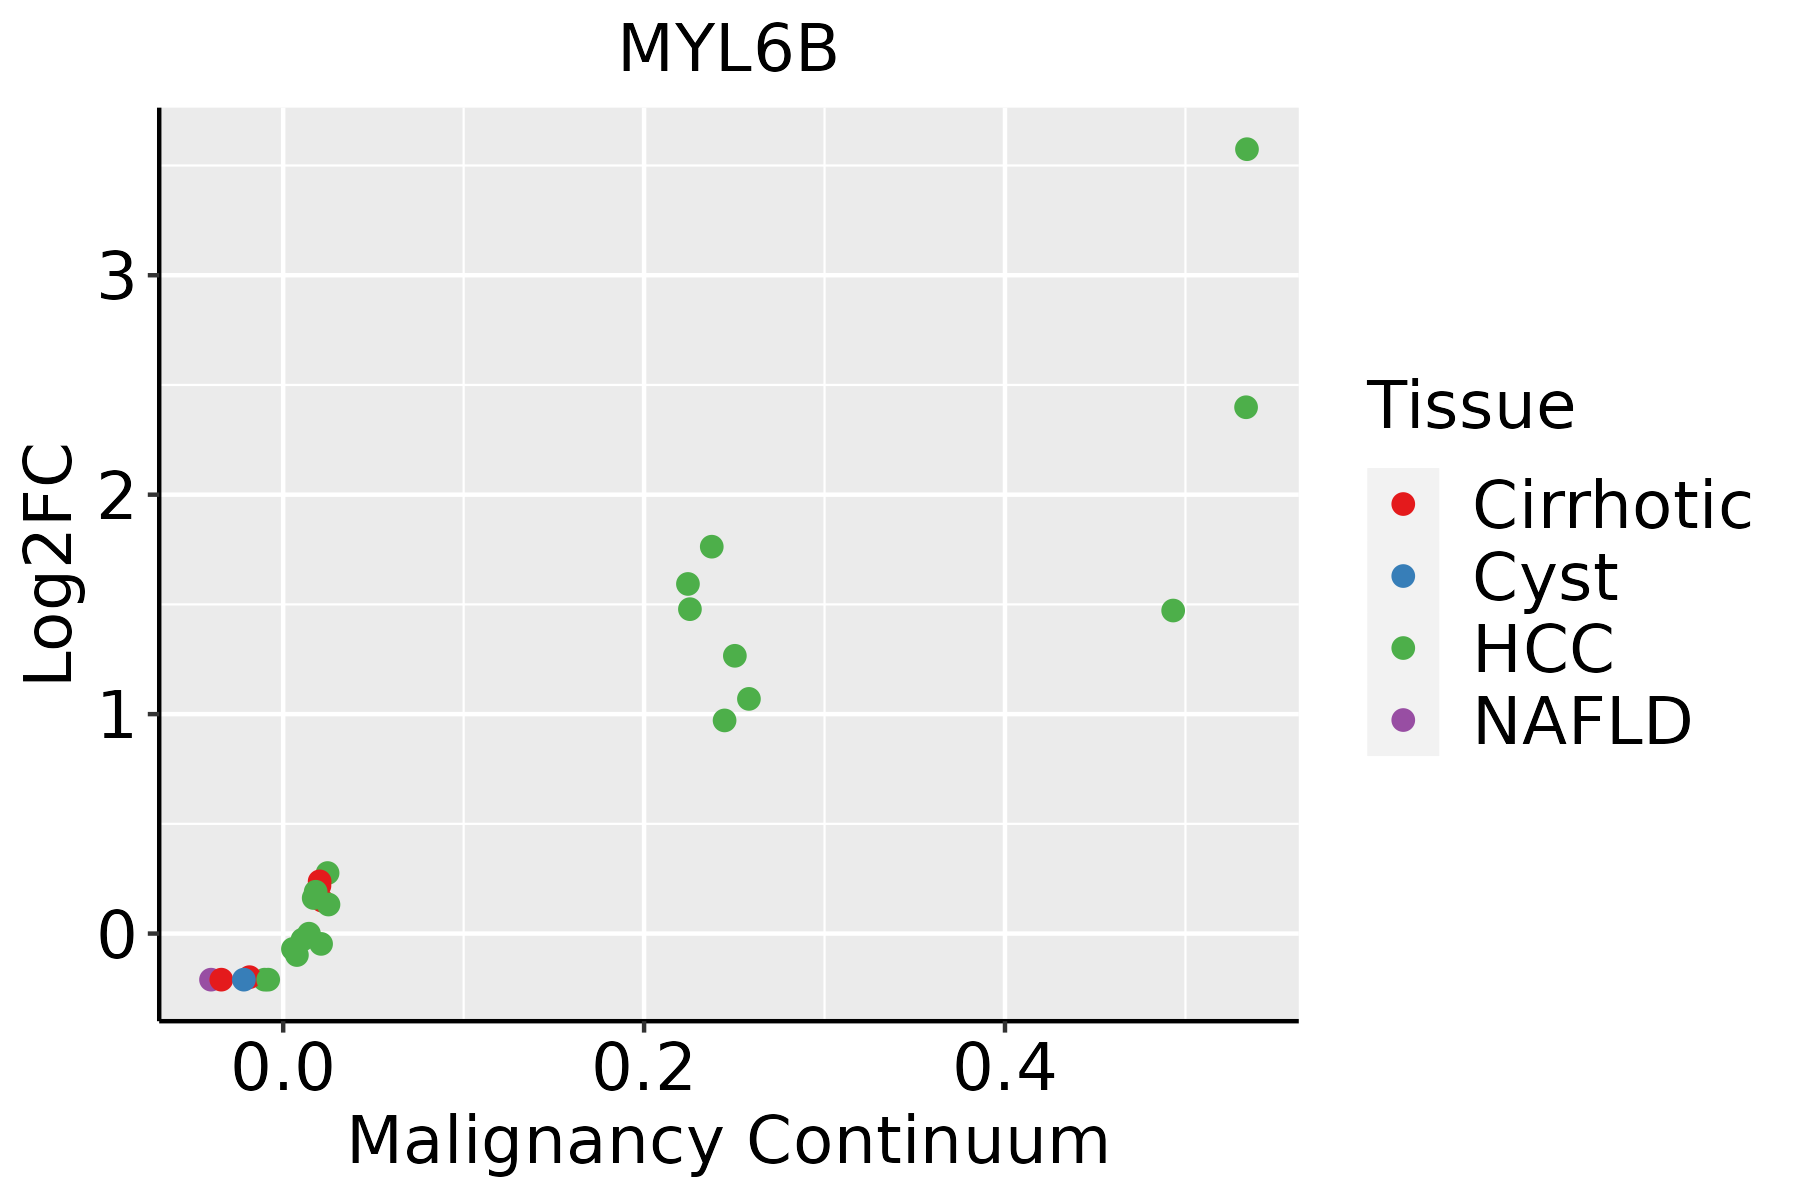 | HCC: Hepatocellular carcinoma |
| NAFLD: Non-alcoholic fatty liver disease | ||
| Oral Cavity | 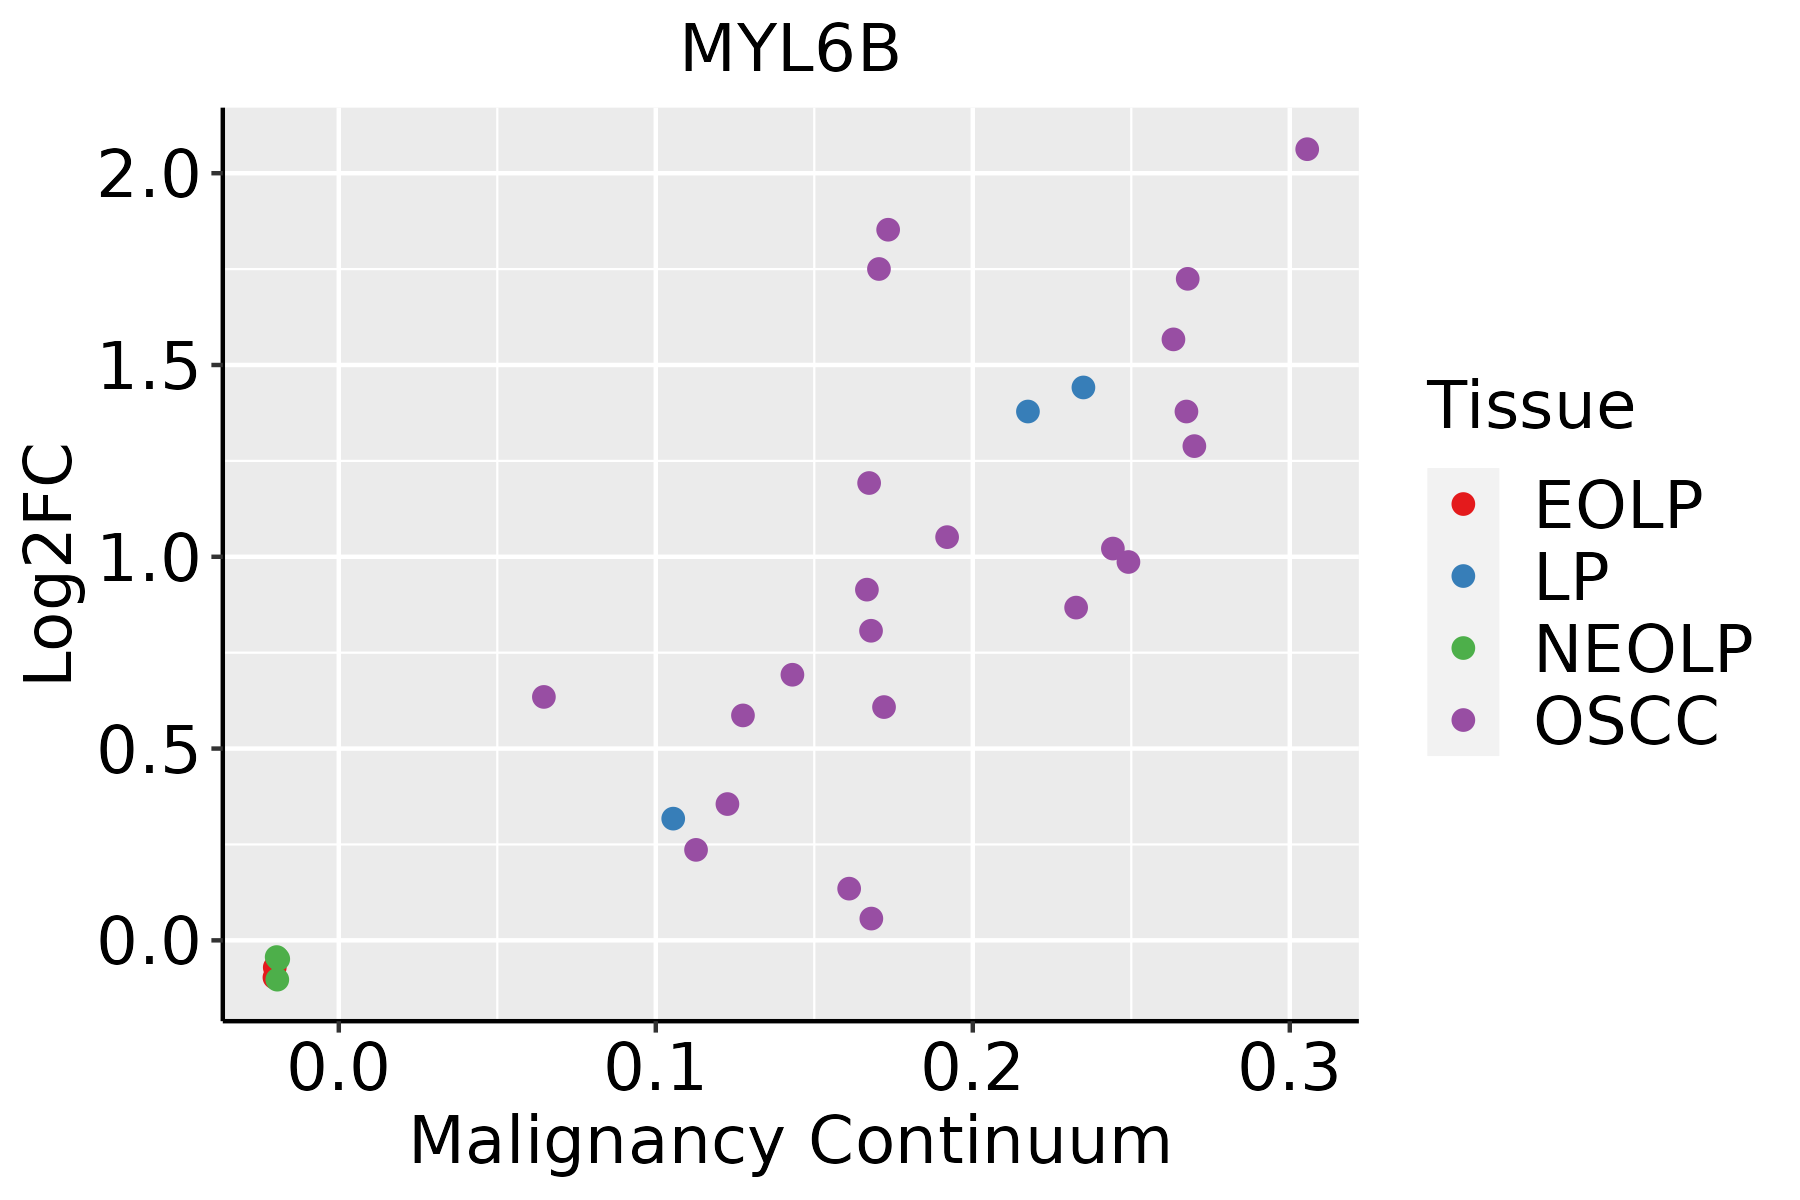 | EOLP: Erosive Oral lichen planus |
| LP: leukoplakia | ||
| NEOLP: Non-erosive oral lichen planus | ||
| OSCC: Oral squamous cell carcinoma | ||
| Skin | 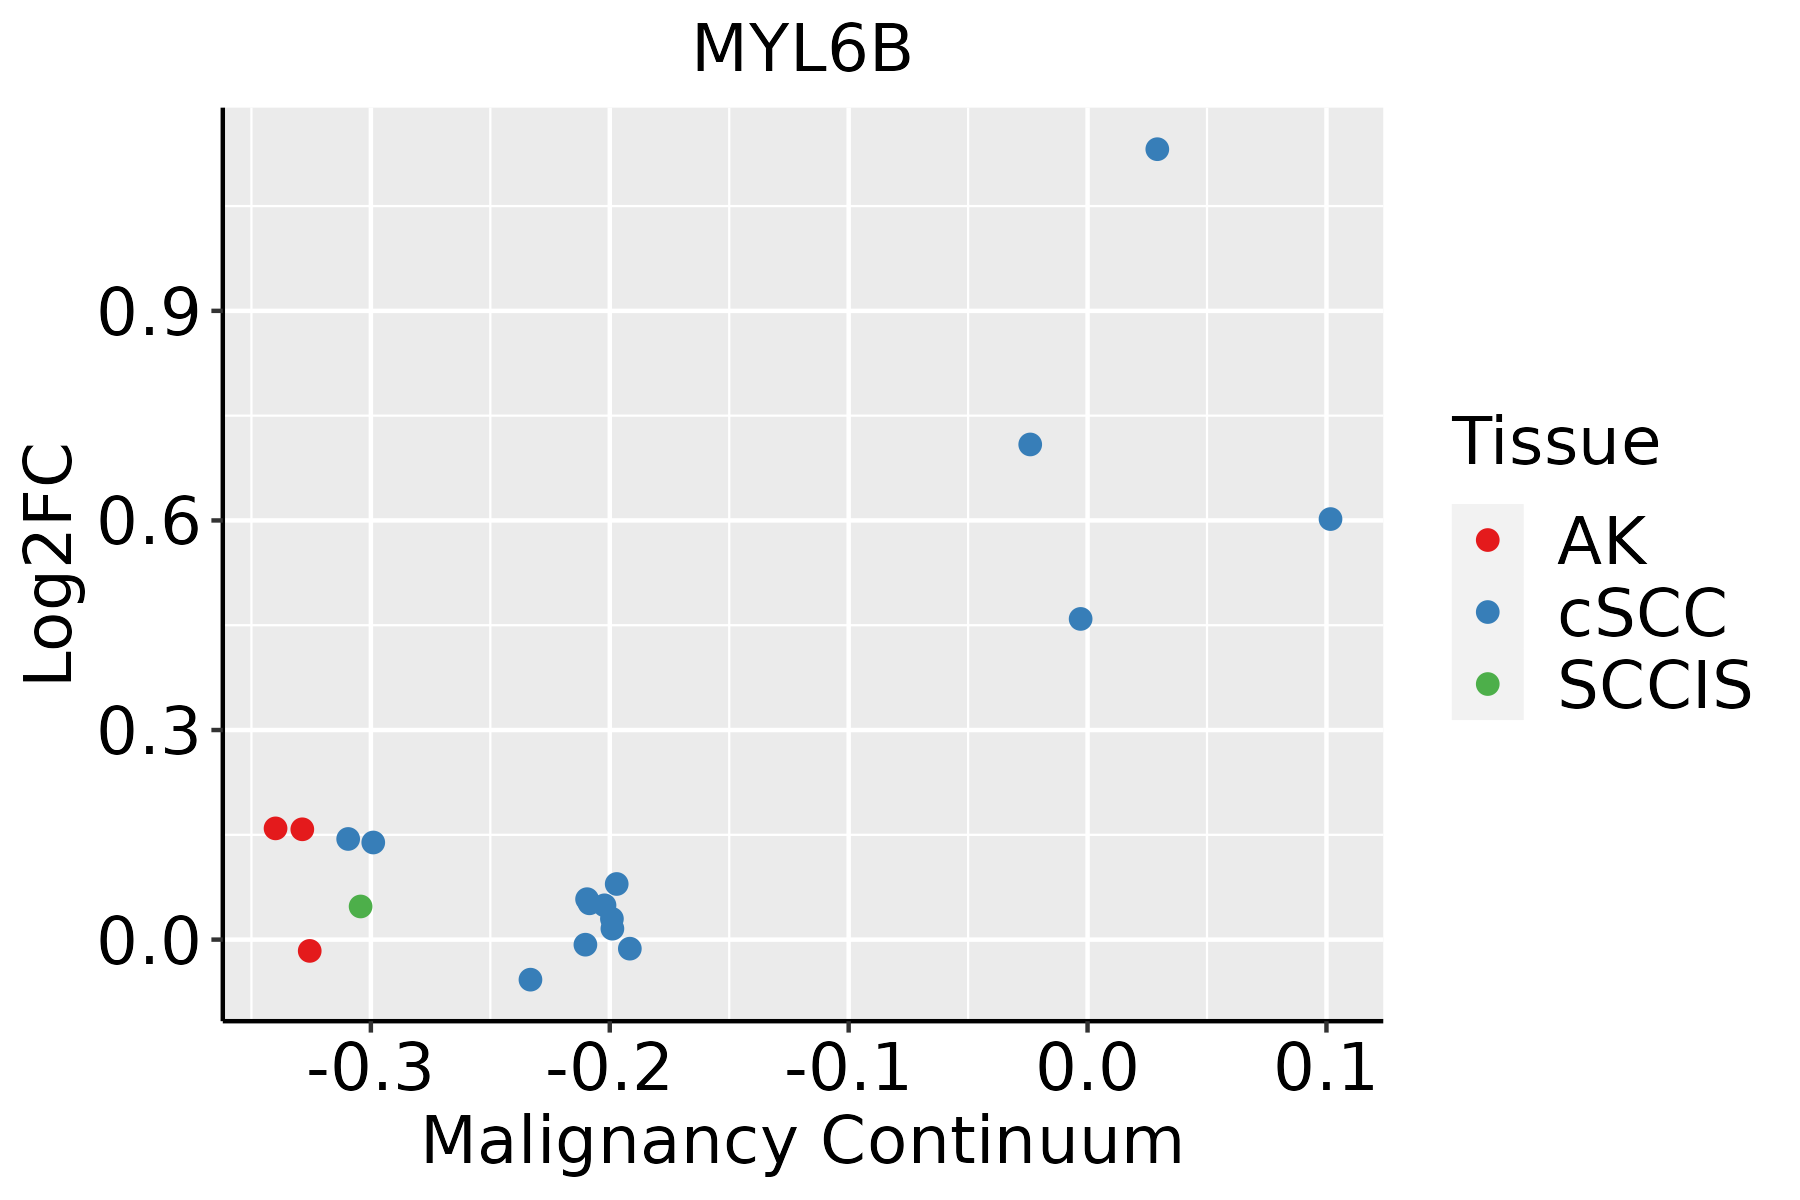 | AK: Actinic keratosis |
| cSCC: Cutaneous squamous cell carcinoma | ||
| SCCIS:squamous cell carcinoma in situ | ||
| Thyroid |  | ATC: Anaplastic thyroid cancer |
| HT: Hashimoto's thyroiditis | ||
| PTC: Papillary thyroid cancer |
| ∗log2FC in expression of this searched gene in stem-like cells from each diseased tissue sample relative to stem-like cells in normal samples in each tissue plotted against the malignancy continuum. Samples are colored based on if they are from different disease stage. |
Top |
Malignant transformation related pathway analysis |
| Find out the enriched GO biological processes and KEGG pathways involved in transition from healthy to precancer to cancer |
| Tissue | Disease Stage | Enriched GO biological Processes |
| Colorectum | AD |  |
| Colorectum | SER |  |
| Colorectum | MSS |  |
| Colorectum | MSI-H |  |
| Colorectum | FAP |  |
| ∗Top 15 enriched GO BP terms are showed in the bar plot of each disease state in each tissue. Each row represents a significant GO biological process which is colored according to the -log10(p.adjust). |
| Page: 1 2 3 4 5 6 7 8 9 |
| GO ID | Tissue | Disease Stage | Description | Gene Ratio | Bg Ratio | pvalue | p.adjust | Count |
| GO:00605376 | Endometrium | AEH | muscle tissue development | 83/2100 | 403/18723 | 2.57e-08 | 1.50e-06 | 83 |
| GO:00147065 | Endometrium | AEH | striated muscle tissue development | 75/2100 | 384/18723 | 1.06e-06 | 3.62e-05 | 75 |
| GO:00300488 | Endometrium | AEH | actin filament-based movement | 31/2100 | 127/18723 | 2.10e-05 | 4.14e-04 | 31 |
| GO:00030126 | Endometrium | AEH | muscle system process | 78/2100 | 452/18723 | 6.89e-05 | 1.06e-03 | 78 |
| GO:00075174 | Endometrium | AEH | muscle organ development | 60/2100 | 327/18723 | 8.19e-05 | 1.22e-03 | 60 |
| GO:0006936 | Endometrium | AEH | muscle contraction | 59/2100 | 347/18723 | 7.32e-04 | 6.99e-03 | 59 |
| GO:00702524 | Endometrium | AEH | actin-mediated cell contraction | 20/2100 | 97/18723 | 5.00e-03 | 3.14e-02 | 20 |
| GO:00605382 | Endometrium | AEH | skeletal muscle organ development | 30/2100 | 166/18723 | 5.64e-03 | 3.46e-02 | 30 |
| GO:00075193 | Endometrium | AEH | skeletal muscle tissue development | 28/2100 | 155/18723 | 7.35e-03 | 4.19e-02 | 28 |
| GO:006053713 | Endometrium | EEC | muscle tissue development | 82/2168 | 403/18723 | 2.14e-07 | 9.38e-06 | 82 |
| GO:001470612 | Endometrium | EEC | striated muscle tissue development | 74/2168 | 384/18723 | 6.64e-06 | 1.57e-04 | 74 |
| GO:003004814 | Endometrium | EEC | actin filament-based movement | 31/2168 | 127/18723 | 3.90e-05 | 6.56e-04 | 31 |
| GO:000301213 | Endometrium | EEC | muscle system process | 79/2168 | 452/18723 | 1.16e-04 | 1.55e-03 | 79 |
| GO:000751712 | Endometrium | EEC | muscle organ development | 59/2168 | 327/18723 | 3.49e-04 | 3.85e-03 | 59 |
| GO:00069361 | Endometrium | EEC | muscle contraction | 59/2168 | 347/18723 | 1.57e-03 | 1.26e-02 | 59 |
| GO:007025212 | Endometrium | EEC | actin-mediated cell contraction | 20/2168 | 97/18723 | 7.11e-03 | 4.07e-02 | 20 |
| GO:006053811 | Endometrium | EEC | skeletal muscle organ development | 30/2168 | 166/18723 | 8.78e-03 | 4.74e-02 | 30 |
| GO:00605379 | Esophagus | HGIN | muscle tissue development | 76/2587 | 403/18723 | 2.67e-03 | 2.63e-02 | 76 |
| GO:00147068 | Esophagus | HGIN | striated muscle tissue development | 72/2587 | 384/18723 | 3.94e-03 | 3.56e-02 | 72 |
| GO:006053716 | Esophagus | ESCC | muscle tissue development | 211/8552 | 403/18723 | 3.84e-03 | 1.56e-02 | 211 |
| Page: 1 2 |
| Pathway ID | Tissue | Disease Stage | Description | Gene Ratio | Bg Ratio | pvalue | p.adjust | qvalue | Count |
| hsa0453026 | Endometrium | AEH | Tight junction | 54/1197 | 169/8465 | 1.99e-09 | 3.80e-08 | 2.78e-08 | 54 |
| hsa048144 | Endometrium | AEH | Motor proteins | 42/1197 | 193/8465 | 2.41e-03 | 1.42e-02 | 1.04e-02 | 42 |
| hsa04530112 | Endometrium | AEH | Tight junction | 54/1197 | 169/8465 | 1.99e-09 | 3.80e-08 | 2.78e-08 | 54 |
| hsa0481411 | Endometrium | AEH | Motor proteins | 42/1197 | 193/8465 | 2.41e-03 | 1.42e-02 | 1.04e-02 | 42 |
| hsa0453027 | Endometrium | EEC | Tight junction | 54/1237 | 169/8465 | 6.56e-09 | 1.27e-07 | 9.46e-08 | 54 |
| hsa048142 | Endometrium | EEC | Motor proteins | 42/1237 | 193/8465 | 4.43e-03 | 2.39e-02 | 1.78e-02 | 42 |
| hsa0453036 | Endometrium | EEC | Tight junction | 54/1237 | 169/8465 | 6.56e-09 | 1.27e-07 | 9.46e-08 | 54 |
| hsa048143 | Endometrium | EEC | Motor proteins | 42/1237 | 193/8465 | 4.43e-03 | 2.39e-02 | 1.78e-02 | 42 |
| hsa0453039 | Esophagus | HGIN | Tight junction | 40/1383 | 169/8465 | 8.18e-03 | 4.71e-02 | 3.74e-02 | 40 |
| hsa04530115 | Esophagus | HGIN | Tight junction | 40/1383 | 169/8465 | 8.18e-03 | 4.71e-02 | 3.74e-02 | 40 |
| hsa04530211 | Esophagus | ESCC | Tight junction | 105/4205 | 169/8465 | 6.73e-04 | 2.23e-03 | 1.14e-03 | 105 |
| hsa04530310 | Esophagus | ESCC | Tight junction | 105/4205 | 169/8465 | 6.73e-04 | 2.23e-03 | 1.14e-03 | 105 |
| hsa0453022 | Liver | Cirrhotic | Tight junction | 82/2530 | 169/8465 | 2.14e-07 | 2.85e-06 | 1.76e-06 | 82 |
| hsa0453032 | Liver | Cirrhotic | Tight junction | 82/2530 | 169/8465 | 2.14e-07 | 2.85e-06 | 1.76e-06 | 82 |
| hsa0453042 | Liver | HCC | Tight junction | 110/4020 | 169/8465 | 2.45e-06 | 2.28e-05 | 1.27e-05 | 110 |
| hsa0453052 | Liver | HCC | Tight junction | 110/4020 | 169/8465 | 2.45e-06 | 2.28e-05 | 1.27e-05 | 110 |
| hsa0453030 | Oral cavity | OSCC | Tight junction | 102/3704 | 169/8465 | 8.68e-06 | 3.93e-05 | 2.00e-05 | 102 |
| hsa04530114 | Oral cavity | OSCC | Tight junction | 102/3704 | 169/8465 | 8.68e-06 | 3.93e-05 | 2.00e-05 | 102 |
| Page: 1 |
Top |
Cell-cell communication analysis |
| Identification of potential cell-cell interactions between two cell types and their ligand-receptor pairs for different disease states |
| Ligand | Receptor | LRpair | Pathway | Tissue | Disease Stage |
| Page: 1 |
Top |
Single-cell gene regulatory network inference analysis |
| Find out the significant the regulons (TFs) and the target genes of each regulon across cell types for different disease states |
| TF | Cell Type | Tissue | Disease Stage | Target Gene | RSS | Regulon Activity |
| ∗The dot plots of a searched regulon are shown for all cell subpopulations in each disease state of each tissue based on the regulon specific score inferred using pySCENIC and by calculating the average expression. |
| Page: 1 |
Top |
Somatic mutation of malignant transformation related genes |
| Annotation of somatic variants for genes involved in malignant transformation |
| Hugo Symbol | Variant Class | Variant Classification | dbSNP RS | HGVSc | HGVSp | HGVSp Short | SWISSPROT | BIOTYPE | SIFT | PolyPhen | Tumor Sample Barcode | Tissue | Histology | Sex | Age | Stage | Therapy Types | Drugs | Outcome |
| MYL6B | SNV | Missense_Mutation | c.152N>T | p.Pro51Leu | p.P51L | P14649 | protein_coding | tolerated(0.05) | probably_damaging(0.923) | TCGA-D8-A1J8-01 | Breast | breast invasive carcinoma | Female | >=65 | I/II | Hormone Therapy | nolvadex | SD | |
| MYL6B | SNV | Missense_Mutation | c.508N>G | p.Leu170Val | p.L170V | P14649 | protein_coding | deleterious(0) | probably_damaging(0.998) | TCGA-IR-A3LK-01 | Cervix | cervical & endocervical cancer | Female | >=65 | I/II | Chemotherapy | cisplatin | PD | |
| MYL6B | SNV | Missense_Mutation | c.397G>A | p.Ala133Thr | p.A133T | P14649 | protein_coding | tolerated(0.73) | benign(0.003) | TCGA-AA-3710-01 | Colorectum | colon adenocarcinoma | Female | >=65 | I/II | Unknown | Unknown | SD | |
| MYL6B | SNV | Missense_Mutation | rs779611293 | c.356N>T | p.Ser119Leu | p.S119L | P14649 | protein_coding | tolerated(0.22) | benign(0.001) | TCGA-AA-3811-01 | Colorectum | colon adenocarcinoma | Female | >=65 | III/IV | Unknown | Unknown | PD |
| MYL6B | SNV | Missense_Mutation | c.290N>A | p.Gly97Asp | p.G97D | P14649 | protein_coding | deleterious(0) | probably_damaging(1) | TCGA-AA-3966-01 | Colorectum | colon adenocarcinoma | Female | >=65 | I/II | Unknown | Unknown | SD | |
| MYL6B | SNV | Missense_Mutation | c.346N>A | p.Glu116Lys | p.E116K | P14649 | protein_coding | deleterious(0) | benign(0.445) | TCGA-EI-6882-01 | Colorectum | rectum adenocarcinoma | Male | <65 | I/II | Unknown | Unknown | SD | |
| MYL6B | SNV | Missense_Mutation | novel | c.205N>A | p.Phe69Ile | p.F69I | P14649 | protein_coding | deleterious(0.05) | possibly_damaging(0.59) | TCGA-AP-A051-01 | Endometrium | uterine corpus endometrioid carcinoma | Female | >=65 | I/II | Unknown | Unknown | SD |
| MYL6B | SNV | Missense_Mutation | c.56A>T | p.Lys19Ile | p.K19I | P14649 | protein_coding | deleterious_low_confidence(0.02) | probably_damaging(0.916) | TCGA-AP-A054-01 | Endometrium | uterine corpus endometrioid carcinoma | Female | <65 | III/IV | Chemotherapy | carboplatin | PD | |
| MYL6B | SNV | Missense_Mutation | c.571N>A | p.Asp191Asn | p.D191N | P14649 | protein_coding | deleterious(0.01) | possibly_damaging(0.459) | TCGA-AP-A0LM-01 | Endometrium | uterine corpus endometrioid carcinoma | Female | <65 | III/IV | Chemotherapy | cisplatin | SD | |
| MYL6B | SNV | Missense_Mutation | novel | c.570G>T | p.Glu190Asp | p.E190D | P14649 | protein_coding | deleterious(0.03) | possibly_damaging(0.713) | TCGA-AX-A2HC-01 | Endometrium | uterine corpus endometrioid carcinoma | Female | <65 | III/IV | Chemotherapy | paclitaxel | PD |
| Page: 1 2 |
Top |
Related drugs of malignant transformation related genes |
| Identification of chemicals and drugs interact with genes involved in malignant transfromation |
| (DGIdb 4.0) |
| Entrez ID | Symbol | Category | Interaction Types | Drug Claim Name | Drug Name | PMIDs |
| Page: 1 |

Copyright 2023-Present -The University of Texas Health Science Center at Houston |