
|
|||||
|
 | |
| |
| |
| |
| |
| |
|
Gene: MYL6 |
Gene summary for MYL6 |
| Gene information | Species | Human | Gene symbol | MYL6 | Gene ID | 4637 |
| Gene name | myosin light chain 6 | |
| Gene Alias | ESMLC | |
| Cytomap | 12q13.2 | |
| Gene Type | protein-coding | GO ID | GO:0003008 | UniProtAcc | P60660 |
Top |
Malignant transformation analysis |
| Identification of the aberrant gene expression in precancerous and cancerous lesions by comparing the gene expression of stem-like cells in diseased tissues with normal stem cells |
| Entrez ID | Symbol | Replicates | Species | Organ | Tissue | Adj P-value | Log2FC | Malignancy |
| 4637 | MYL6 | CA_HPV_1 | Human | Cervix | CC | 1.11e-03 | -1.30e-01 | 0.0264 |
| 4637 | MYL6 | CA_HPV_2 | Human | Cervix | CC | 6.54e-05 | -1.60e-01 | 0.0391 |
| 4637 | MYL6 | CA_HPV_3 | Human | Cervix | CC | 2.19e-02 | -3.12e-02 | 0.0414 |
| 4637 | MYL6 | CCI_1 | Human | Cervix | CC | 8.12e-48 | -1.53e+00 | 0.528 |
| 4637 | MYL6 | CCI_2 | Human | Cervix | CC | 1.42e-33 | -1.26e+00 | 0.5249 |
| 4637 | MYL6 | CCI_3 | Human | Cervix | CC | 7.78e-55 | -1.52e+00 | 0.516 |
| 4637 | MYL6 | CCII_1 | Human | Cervix | CC | 1.78e-62 | -1.32e+00 | 0.3249 |
| 4637 | MYL6 | Tumor | Human | Cervix | CC | 3.76e-04 | -1.30e-01 | 0.1241 |
| 4637 | MYL6 | sample3 | Human | Cervix | CC | 6.09e-25 | -1.81e-01 | 0.1387 |
| 4637 | MYL6 | H2 | Human | Cervix | HSIL_HPV | 4.56e-06 | -2.48e-01 | 0.0632 |
| 4637 | MYL6 | L1 | Human | Cervix | CC | 1.47e-03 | -2.52e-01 | 0.0802 |
| 4637 | MYL6 | T3 | Human | Cervix | CC | 3.30e-22 | -1.63e-01 | 0.1389 |
| 4637 | MYL6 | HTA11_3410_2000001011 | Human | Colorectum | AD | 2.89e-44 | 9.80e-01 | 0.0155 |
| 4637 | MYL6 | HTA11_2487_2000001011 | Human | Colorectum | SER | 2.77e-51 | 2.10e+00 | -0.1808 |
| 4637 | MYL6 | HTA11_2951_2000001011 | Human | Colorectum | AD | 3.83e-11 | 1.06e+00 | 0.0216 |
| 4637 | MYL6 | HTA11_1938_2000001011 | Human | Colorectum | AD | 2.99e-51 | 2.00e+00 | -0.0811 |
| 4637 | MYL6 | HTA11_78_2000001011 | Human | Colorectum | AD | 7.48e-16 | 9.07e-01 | -0.1088 |
| 4637 | MYL6 | HTA11_347_2000001011 | Human | Colorectum | AD | 2.73e-77 | 1.97e+00 | -0.1954 |
| 4637 | MYL6 | HTA11_411_2000001011 | Human | Colorectum | SER | 1.79e-19 | 3.17e+00 | -0.2602 |
| 4637 | MYL6 | HTA11_2112_2000001011 | Human | Colorectum | SER | 2.81e-24 | 2.30e+00 | -0.2196 |
| Page: 1 2 3 4 5 6 7 8 9 10 11 12 13 14 |
| Tissue | Expression Dynamics | Abbreviation |
| Cervix |  | CC: Cervix cancer |
| HSIL_HPV: HPV-infected high-grade squamous intraepithelial lesions | ||
| N_HPV: HPV-infected normal cervix | ||
| Colorectum (GSE201348) |  | FAP: Familial adenomatous polyposis |
| CRC: Colorectal cancer | ||
| Colorectum (HTA11) |  | AD: Adenomas |
| SER: Sessile serrated lesions | ||
| MSI-H: Microsatellite-high colorectal cancer | ||
| MSS: Microsatellite stable colorectal cancer | ||
| Endometrium |  | AEH: Atypical endometrial hyperplasia |
| EEC: Endometrioid Cancer | ||
| Esophagus | 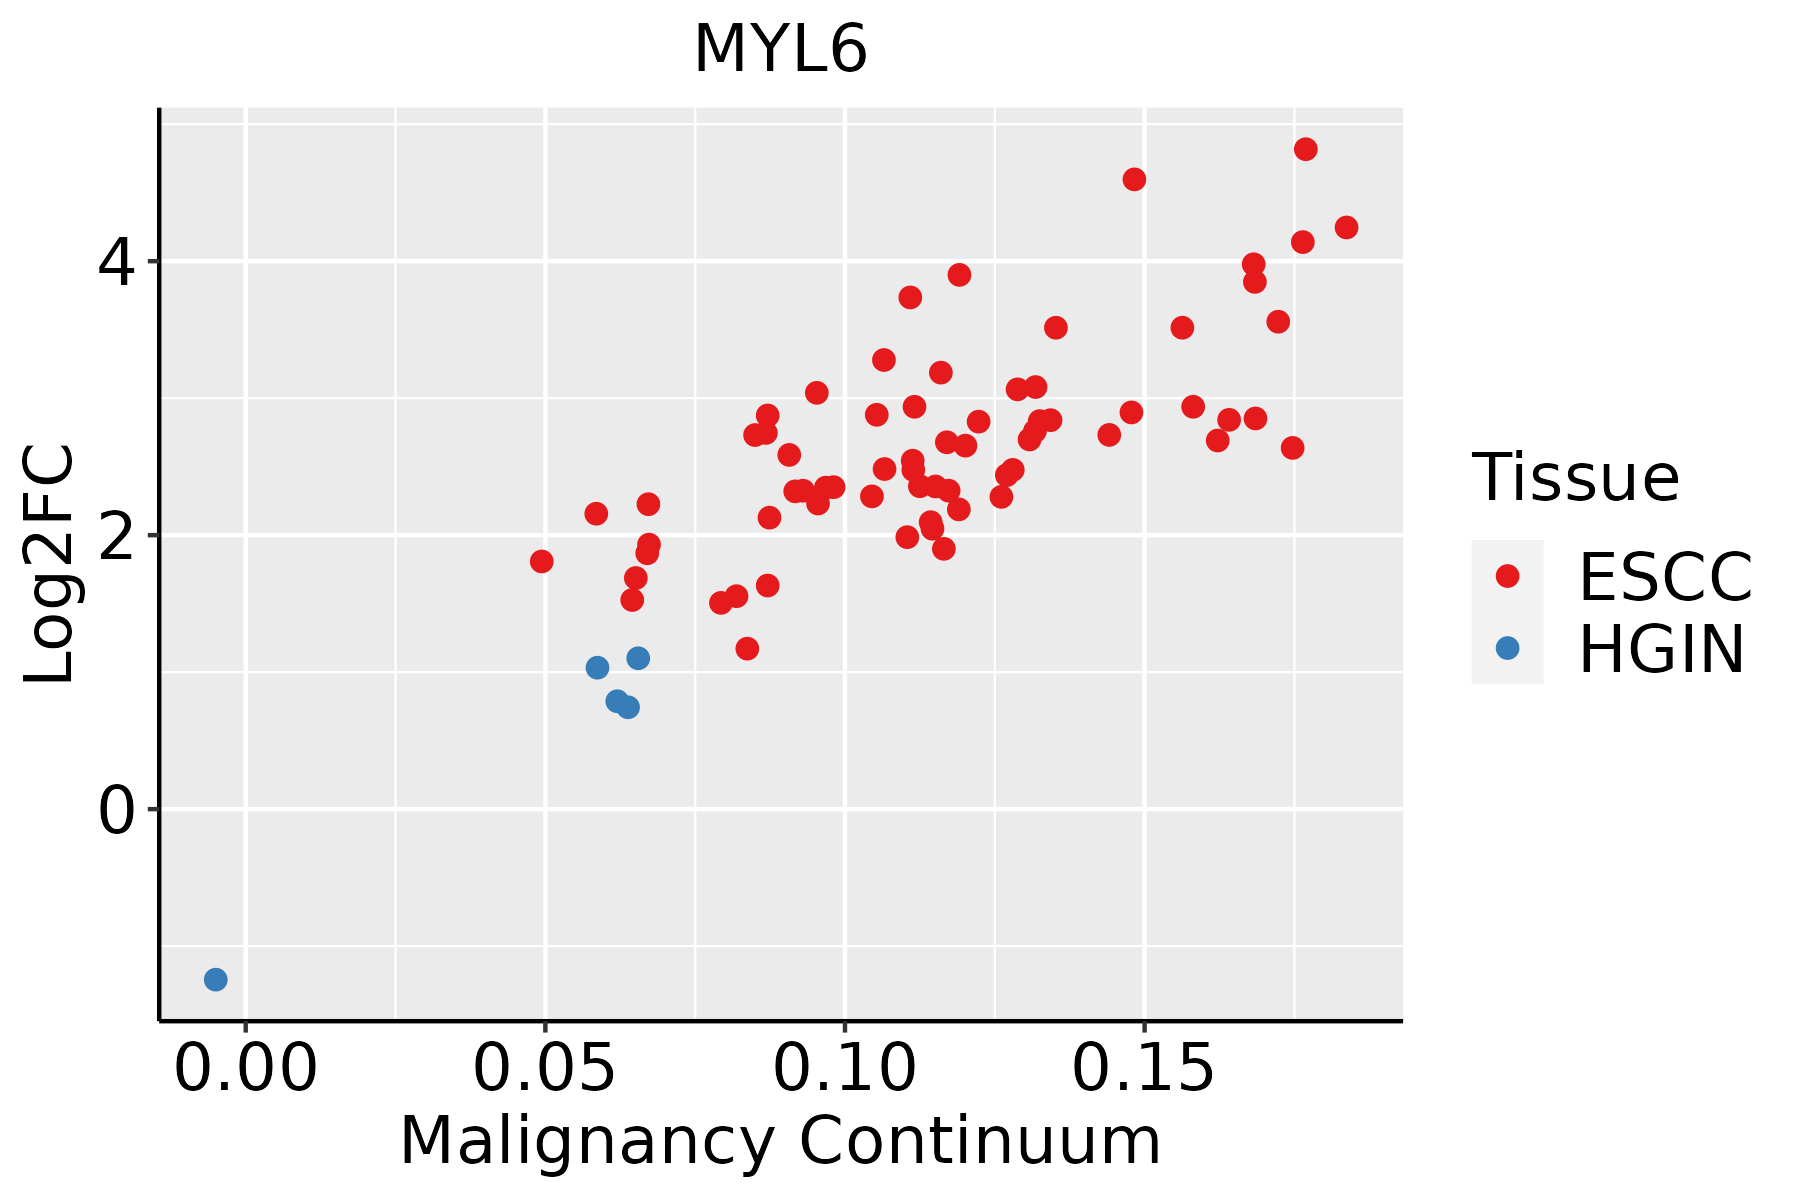 | ESCC: Esophageal squamous cell carcinoma |
| HGIN: High-grade intraepithelial neoplasias | ||
| LGIN: Low-grade intraepithelial neoplasias | ||
| Liver | 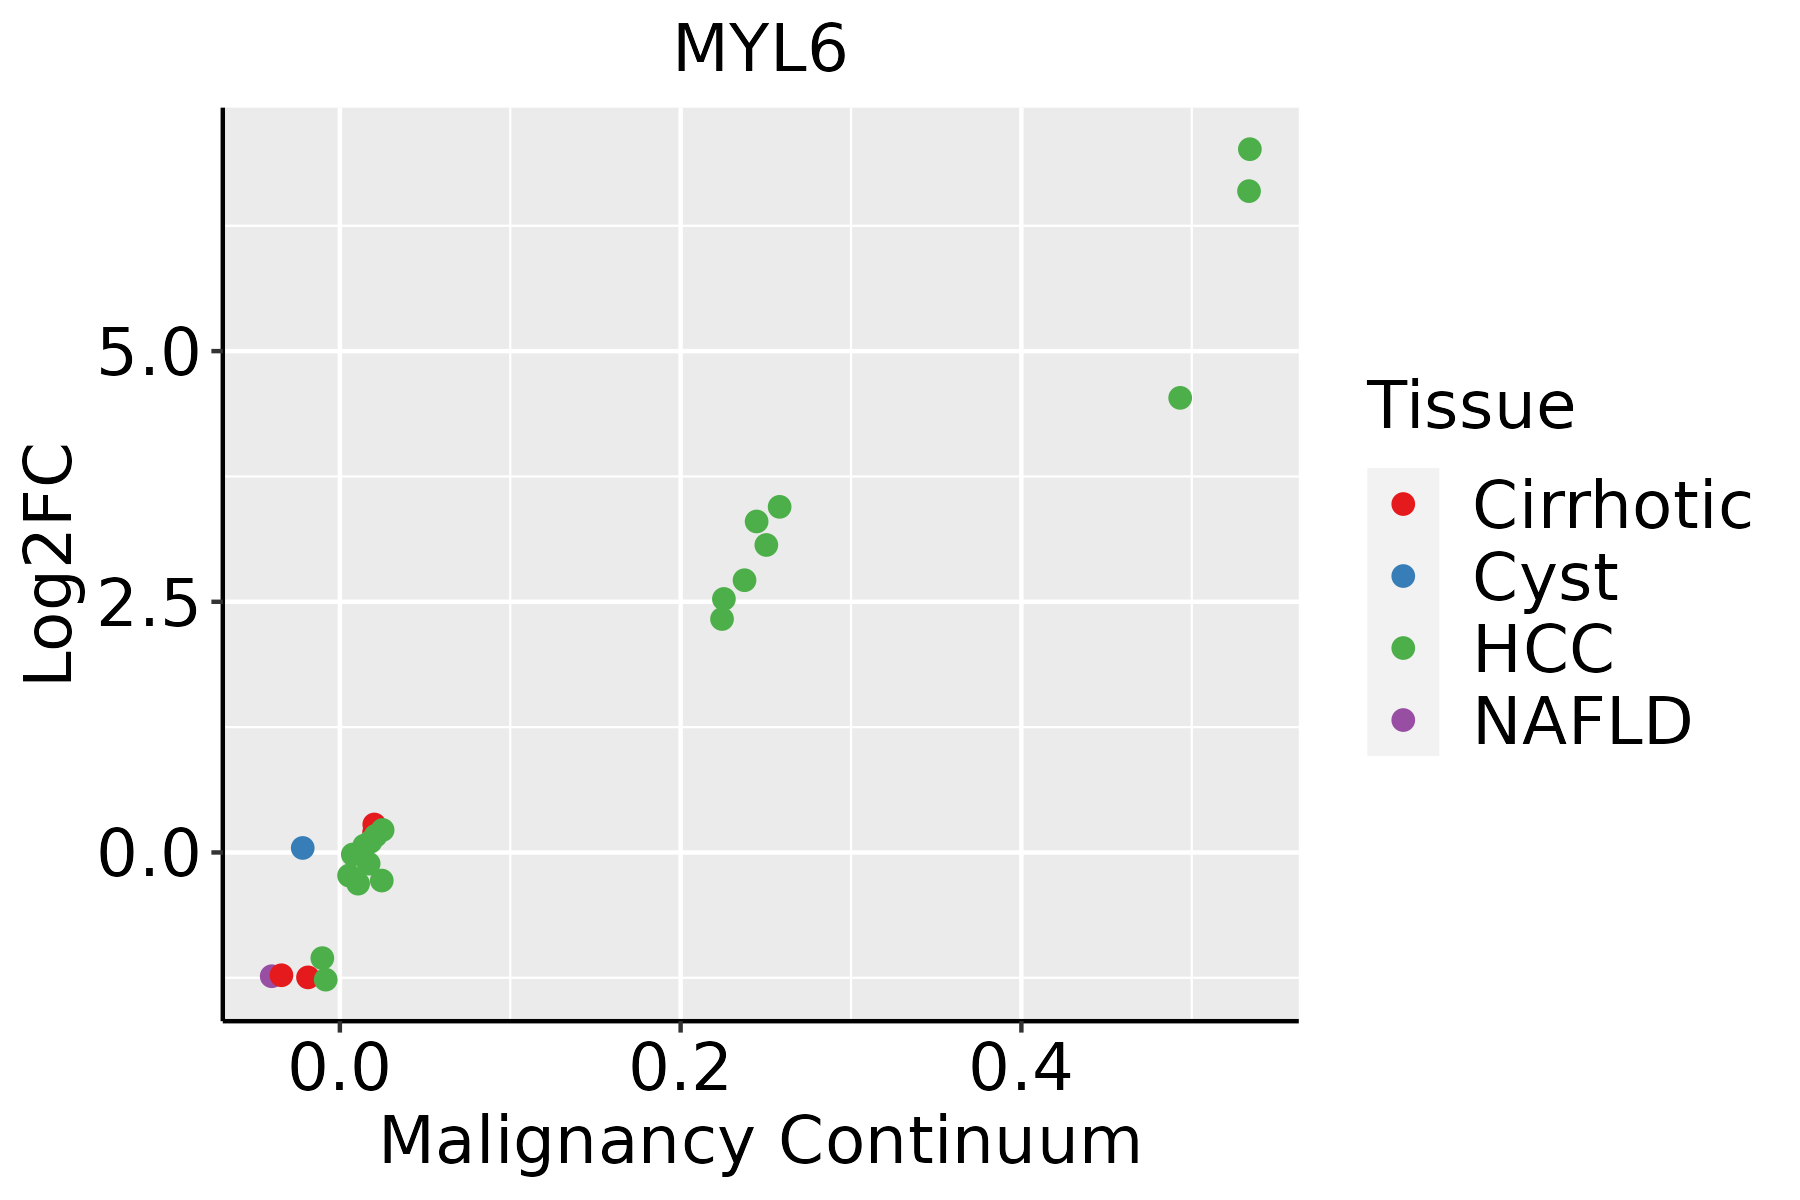 | HCC: Hepatocellular carcinoma |
| NAFLD: Non-alcoholic fatty liver disease | ||
| Oral Cavity | 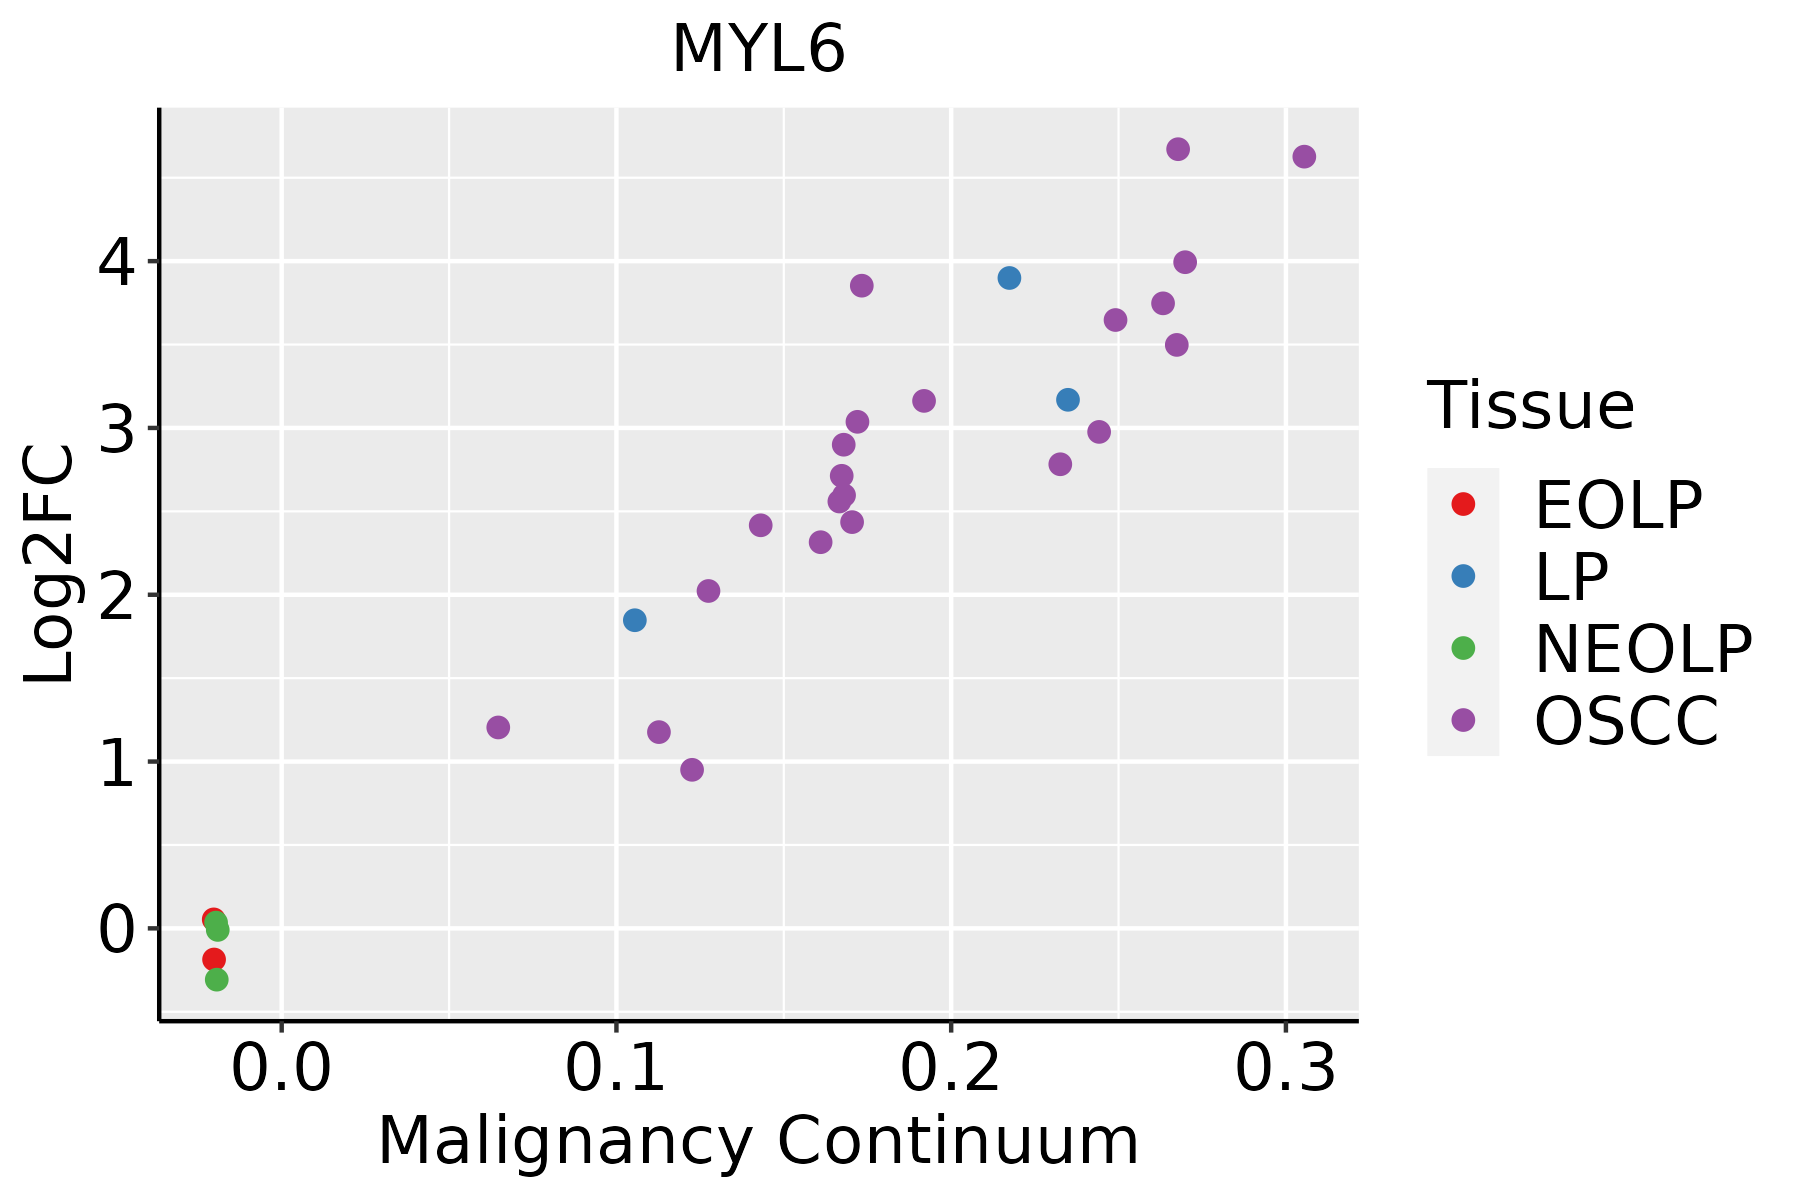 | EOLP: Erosive Oral lichen planus |
| LP: leukoplakia | ||
| NEOLP: Non-erosive oral lichen planus | ||
| OSCC: Oral squamous cell carcinoma | ||
| Prostate | 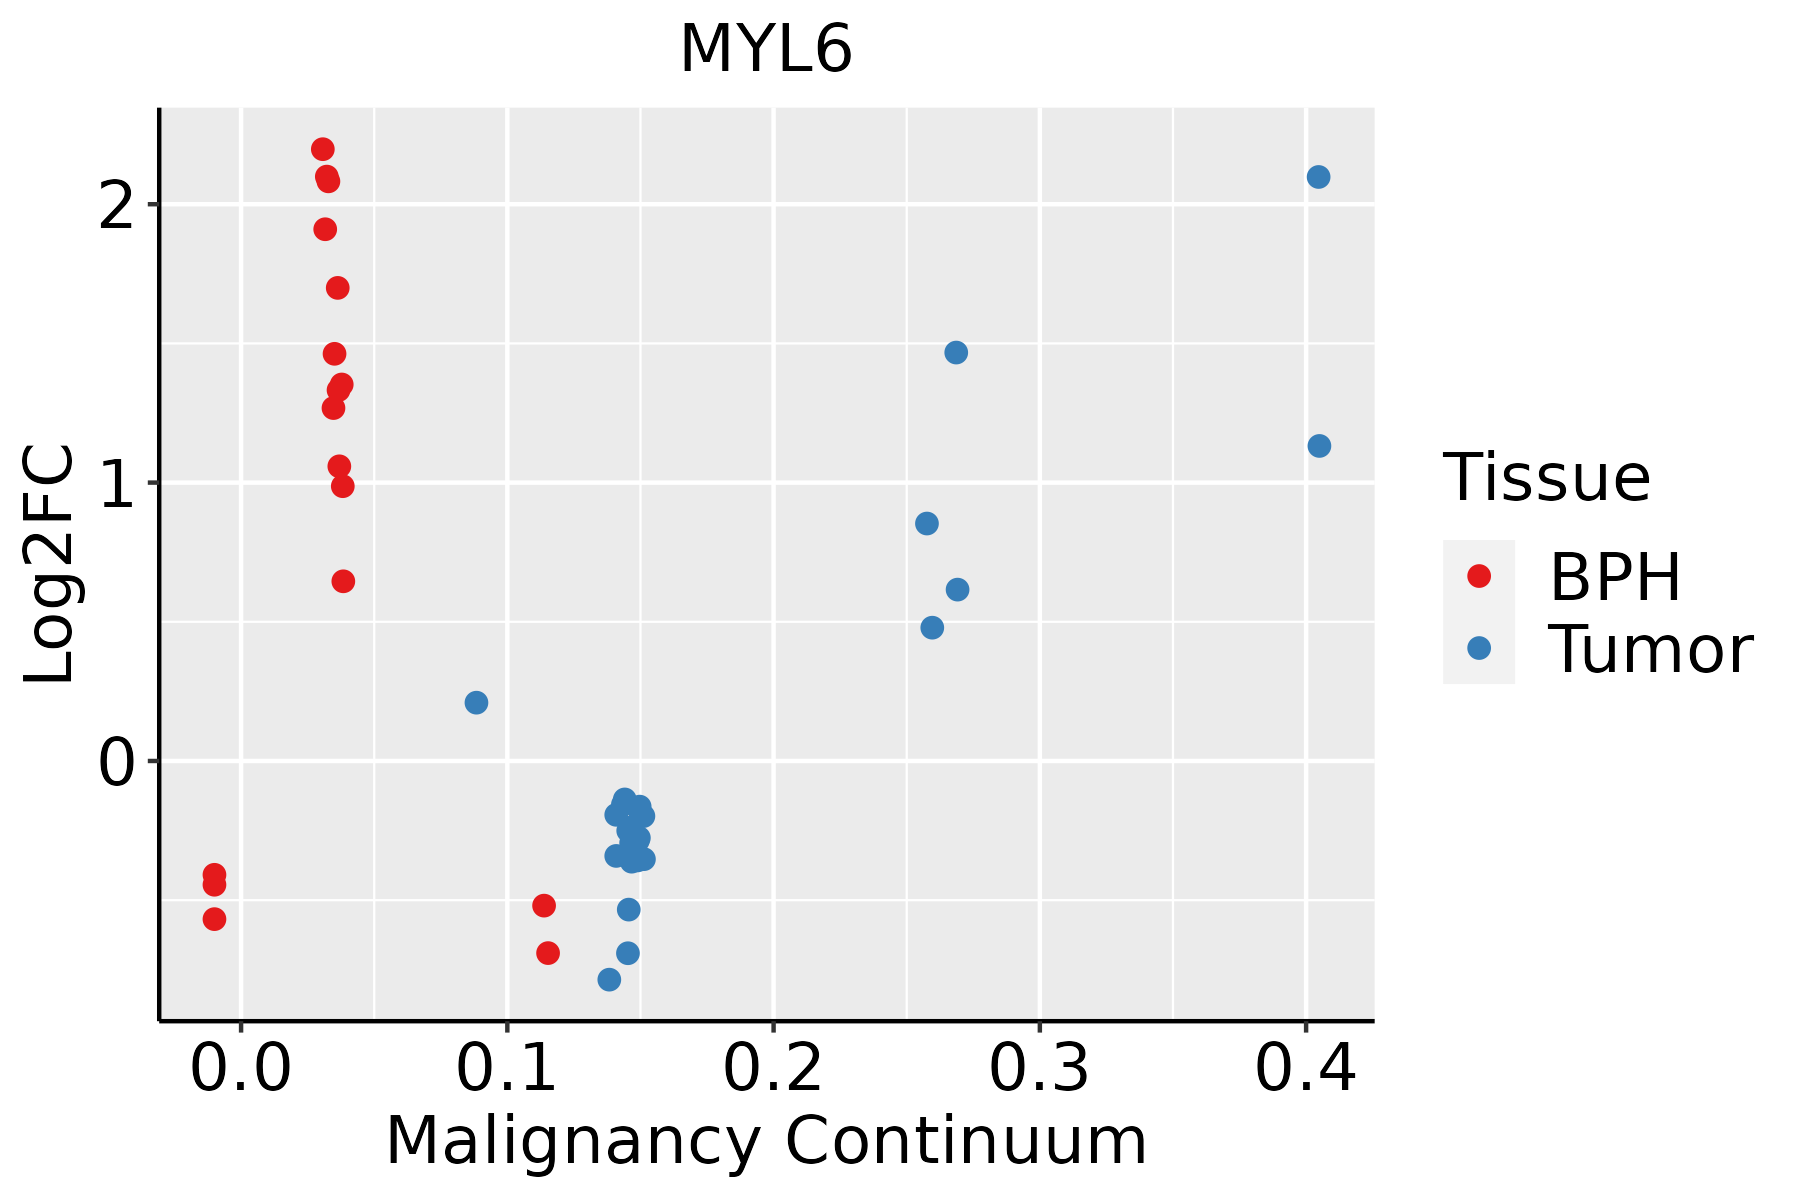 | BPH: Benign Prostatic Hyperplasia |
| Skin |  | AK: Actinic keratosis |
| cSCC: Cutaneous squamous cell carcinoma | ||
| SCCIS:squamous cell carcinoma in situ | ||
| Thyroid | 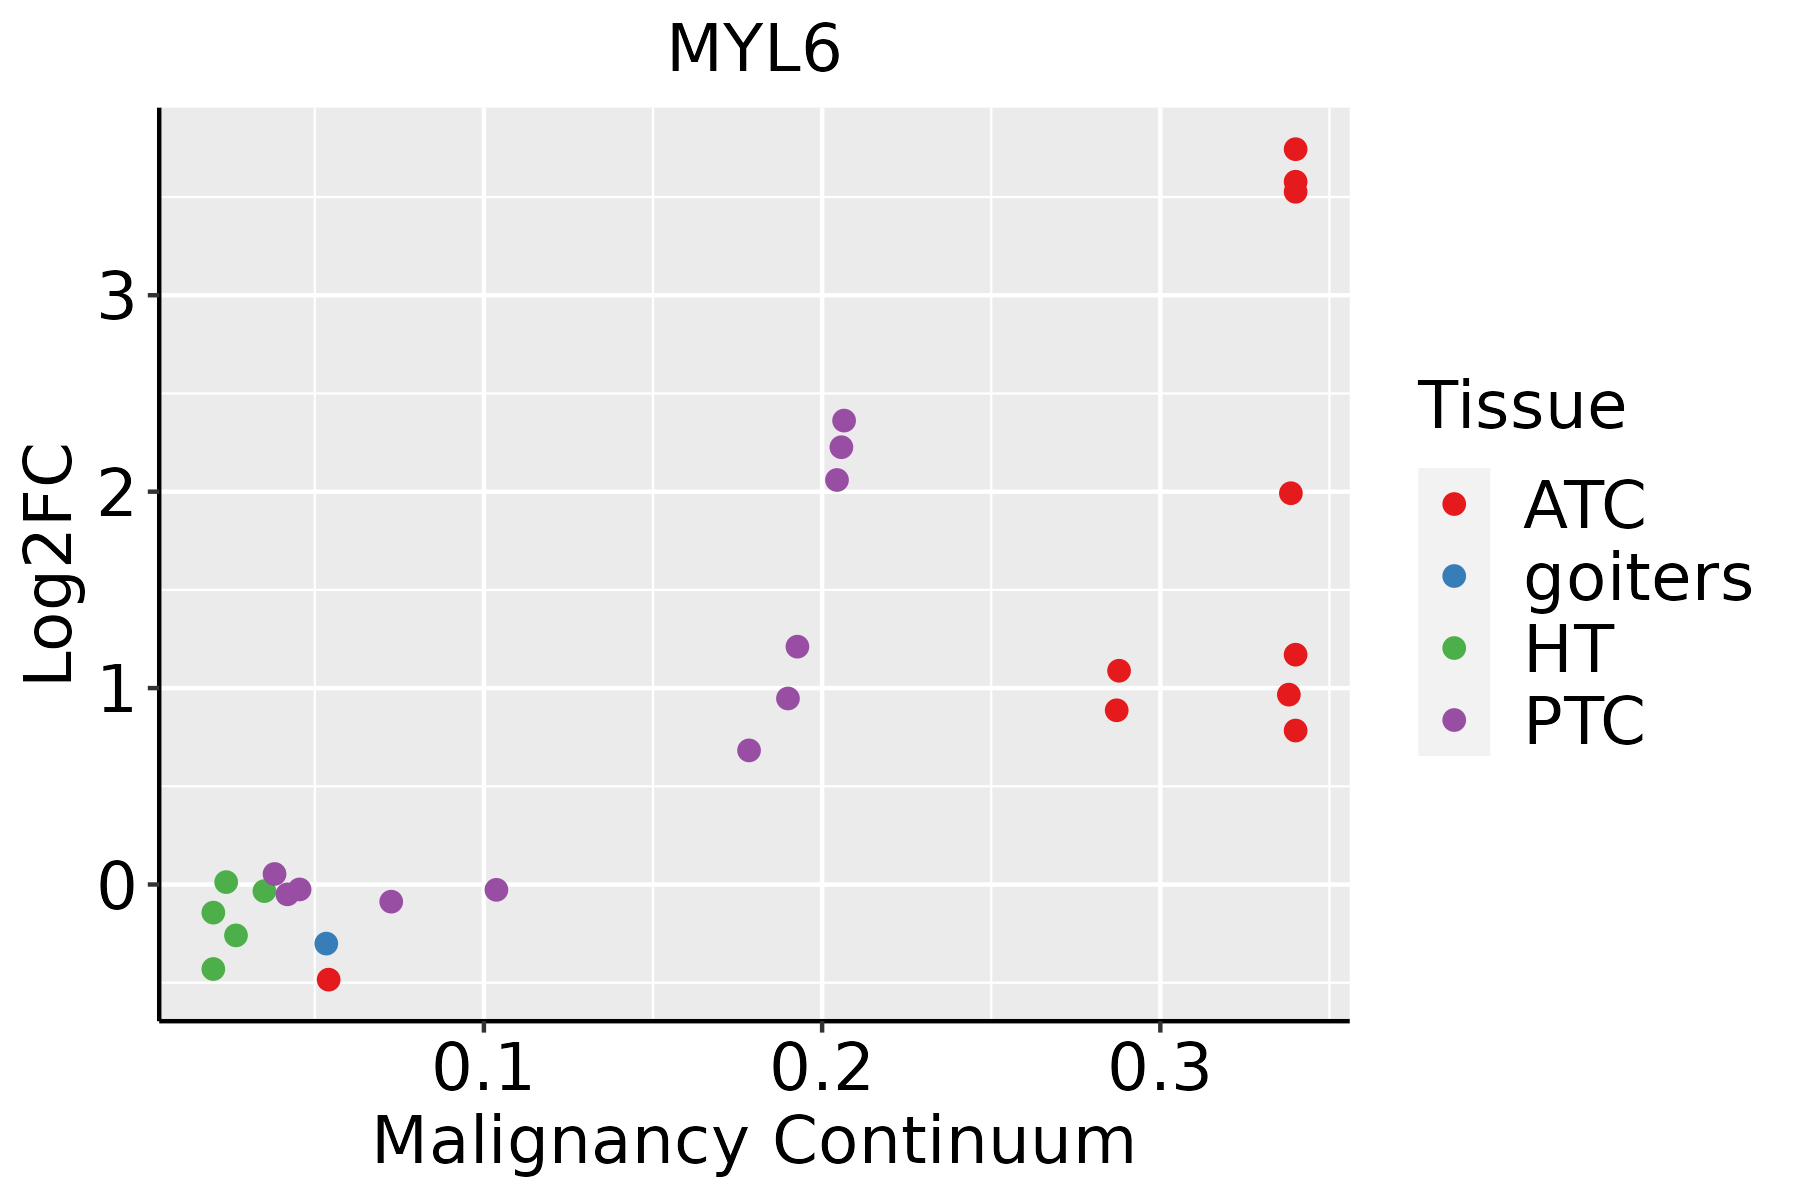 | ATC: Anaplastic thyroid cancer |
| HT: Hashimoto's thyroiditis | ||
| PTC: Papillary thyroid cancer |
| ∗log2FC in expression of this searched gene in stem-like cells from each diseased tissue sample relative to stem-like cells in normal samples in each tissue plotted against the malignancy continuum. Samples are colored based on if they are from different disease stage. |
Top |
Malignant transformation related pathway analysis |
| Find out the enriched GO biological processes and KEGG pathways involved in transition from healthy to precancer to cancer |
| Tissue | Disease Stage | Enriched GO biological Processes |
| Colorectum | AD |  |
| Colorectum | SER |  |
| Colorectum | MSS |  |
| Colorectum | MSI-H |  |
| Colorectum | FAP |  |
| ∗Top 15 enriched GO BP terms are showed in the bar plot of each disease state in each tissue. Each row represents a significant GO biological process which is colored according to the -log10(p.adjust). |
| Page: 1 2 3 4 5 6 7 8 9 |
| GO ID | Tissue | Disease Stage | Description | Gene Ratio | Bg Ratio | pvalue | p.adjust | Count |
| GO:00605375 | Cervix | CC | muscle tissue development | 76/2311 | 403/18723 | 9.76e-05 | 1.27e-03 | 76 |
| GO:00147064 | Cervix | CC | striated muscle tissue development | 72/2311 | 384/18723 | 1.76e-04 | 2.07e-03 | 72 |
| GO:00300487 | Cervix | CC | actin filament-based movement | 29/2311 | 127/18723 | 6.91e-04 | 6.33e-03 | 29 |
| GO:00075173 | Cervix | CC | muscle organ development | 58/2311 | 327/18723 | 2.73e-03 | 1.85e-02 | 58 |
| GO:00075192 | Cervix | CC | skeletal muscle tissue development | 30/2311 | 155/18723 | 7.97e-03 | 4.18e-02 | 30 |
| GO:00075191 | Cervix | HSIL_HPV | skeletal muscle tissue development | 16/737 | 155/18723 | 4.13e-04 | 6.25e-03 | 16 |
| GO:00605381 | Cervix | HSIL_HPV | skeletal muscle organ development | 16/737 | 166/18723 | 8.78e-04 | 1.13e-02 | 16 |
| GO:001470611 | Cervix | HSIL_HPV | striated muscle tissue development | 28/737 | 384/18723 | 1.35e-03 | 1.55e-02 | 28 |
| GO:000751711 | Cervix | HSIL_HPV | muscle organ development | 24/737 | 327/18723 | 2.65e-03 | 2.55e-02 | 24 |
| GO:006053712 | Cervix | HSIL_HPV | muscle tissue development | 28/737 | 403/18723 | 2.72e-03 | 2.59e-02 | 28 |
| GO:003004813 | Cervix | HSIL_HPV | actin filament-based movement | 12/737 | 127/18723 | 4.37e-03 | 3.68e-02 | 12 |
| GO:0030048 | Colorectum | AD | actin filament-based movement | 44/3918 | 127/18723 | 2.31e-04 | 2.99e-03 | 44 |
| GO:00300481 | Colorectum | SER | actin filament-based movement | 38/2897 | 127/18723 | 2.80e-05 | 7.56e-04 | 38 |
| GO:0003012 | Colorectum | SER | muscle system process | 92/2897 | 452/18723 | 2.98e-03 | 2.63e-02 | 92 |
| GO:00300482 | Colorectum | MSS | actin filament-based movement | 44/3467 | 127/18723 | 1.11e-05 | 2.64e-04 | 44 |
| GO:0070252 | Colorectum | MSS | actin-mediated cell contraction | 29/3467 | 97/18723 | 4.38e-03 | 3.10e-02 | 29 |
| GO:00030121 | Colorectum | MSS | muscle system process | 105/3467 | 452/18723 | 6.39e-03 | 4.26e-02 | 105 |
| GO:00300483 | Colorectum | FAP | actin filament-based movement | 44/2622 | 127/18723 | 3.48e-09 | 5.93e-07 | 44 |
| GO:00702521 | Colorectum | FAP | actin-mediated cell contraction | 28/2622 | 97/18723 | 1.06e-04 | 1.76e-03 | 28 |
| GO:00030122 | Colorectum | FAP | muscle system process | 89/2622 | 452/18723 | 4.63e-04 | 5.39e-03 | 89 |
| Page: 1 2 3 4 5 |
| Pathway ID | Tissue | Disease Stage | Description | Gene Ratio | Bg Ratio | pvalue | p.adjust | qvalue | Count |
| hsa0453020 | Cervix | CC | Tight junction | 49/1267 | 169/8465 | 1.87e-06 | 1.78e-05 | 1.05e-05 | 49 |
| hsa049218 | Cervix | CC | Oxytocin signaling pathway | 34/1267 | 154/8465 | 1.12e-02 | 3.42e-02 | 2.02e-02 | 34 |
| hsa04530110 | Cervix | CC | Tight junction | 49/1267 | 169/8465 | 1.87e-06 | 1.78e-05 | 1.05e-05 | 49 |
| hsa0492111 | Cervix | CC | Oxytocin signaling pathway | 34/1267 | 154/8465 | 1.12e-02 | 3.42e-02 | 2.02e-02 | 34 |
| hsa04530 | Colorectum | AD | Tight junction | 76/2092 | 169/8465 | 5.49e-09 | 9.69e-08 | 6.18e-08 | 76 |
| hsa045301 | Colorectum | AD | Tight junction | 76/2092 | 169/8465 | 5.49e-09 | 9.69e-08 | 6.18e-08 | 76 |
| hsa045302 | Colorectum | SER | Tight junction | 59/1580 | 169/8465 | 3.24e-07 | 5.98e-06 | 4.34e-06 | 59 |
| hsa045303 | Colorectum | SER | Tight junction | 59/1580 | 169/8465 | 3.24e-07 | 5.98e-06 | 4.34e-06 | 59 |
| hsa045304 | Colorectum | MSS | Tight junction | 66/1875 | 169/8465 | 4.10e-07 | 6.25e-06 | 3.83e-06 | 66 |
| hsa045305 | Colorectum | MSS | Tight junction | 66/1875 | 169/8465 | 4.10e-07 | 6.25e-06 | 3.83e-06 | 66 |
| hsa045306 | Colorectum | MSI-H | Tight junction | 31/797 | 169/8465 | 2.08e-04 | 2.80e-03 | 2.35e-03 | 31 |
| hsa045307 | Colorectum | MSI-H | Tight junction | 31/797 | 169/8465 | 2.08e-04 | 2.80e-03 | 2.35e-03 | 31 |
| hsa045308 | Colorectum | FAP | Tight junction | 60/1404 | 169/8465 | 1.40e-09 | 9.33e-08 | 5.67e-08 | 60 |
| hsa04270 | Colorectum | FAP | Vascular smooth muscle contraction | 33/1404 | 134/8465 | 1.05e-02 | 3.74e-02 | 2.28e-02 | 33 |
| hsa045309 | Colorectum | FAP | Tight junction | 60/1404 | 169/8465 | 1.40e-09 | 9.33e-08 | 5.67e-08 | 60 |
| hsa042701 | Colorectum | FAP | Vascular smooth muscle contraction | 33/1404 | 134/8465 | 1.05e-02 | 3.74e-02 | 2.28e-02 | 33 |
| hsa0453026 | Endometrium | AEH | Tight junction | 54/1197 | 169/8465 | 1.99e-09 | 3.80e-08 | 2.78e-08 | 54 |
| hsa048144 | Endometrium | AEH | Motor proteins | 42/1197 | 193/8465 | 2.41e-03 | 1.42e-02 | 1.04e-02 | 42 |
| hsa04530112 | Endometrium | AEH | Tight junction | 54/1197 | 169/8465 | 1.99e-09 | 3.80e-08 | 2.78e-08 | 54 |
| hsa0481411 | Endometrium | AEH | Motor proteins | 42/1197 | 193/8465 | 2.41e-03 | 1.42e-02 | 1.04e-02 | 42 |
| Page: 1 2 3 |
Top |
Cell-cell communication analysis |
| Identification of potential cell-cell interactions between two cell types and their ligand-receptor pairs for different disease states |
| Ligand | Receptor | LRpair | Pathway | Tissue | Disease Stage |
| Page: 1 |
Top |
Single-cell gene regulatory network inference analysis |
| Find out the significant the regulons (TFs) and the target genes of each regulon across cell types for different disease states |
| TF | Cell Type | Tissue | Disease Stage | Target Gene | RSS | Regulon Activity |
| ∗The dot plots of a searched regulon are shown for all cell subpopulations in each disease state of each tissue based on the regulon specific score inferred using pySCENIC and by calculating the average expression. |
| Page: 1 |
Top |
Somatic mutation of malignant transformation related genes |
| Annotation of somatic variants for genes involved in malignant transformation |
| Hugo Symbol | Variant Class | Variant Classification | dbSNP RS | HGVSc | HGVSp | HGVSp Short | SWISSPROT | BIOTYPE | SIFT | PolyPhen | Tumor Sample Barcode | Tissue | Histology | Sex | Age | Stage | Therapy Types | Drugs | Outcome |
| MYL6 | SNV | Missense_Mutation | c.372A>C | p.Glu124Asp | p.E124D | P60660 | protein_coding | deleterious(0.04) | possibly_damaging(0.821) | TCGA-A8-A08O-01 | Breast | breast invasive carcinoma | Female | <65 | III/IV | Chemotherapy | docetaxel | PD | |
| MYL6 | SNV | Missense_Mutation | c.397G>C | p.Glu133Gln | p.E133Q | P60660 | protein_coding | deleterious(0.04) | possibly_damaging(0.615) | TCGA-D8-A1JA-01 | Breast | breast invasive carcinoma | Female | <65 | III/IV | Chemotherapy | adriamycin | PD | |
| MYL6 | SNV | Missense_Mutation | rs747003745 | c.217N>G | p.Met73Val | p.M73V | P60660 | protein_coding | tolerated(0.1) | benign(0.015) | TCGA-AA-A022-01 | Colorectum | colon adenocarcinoma | Female | >=65 | I/II | Unknown | Unknown | SD |
| MYL6 | SNV | Missense_Mutation | novel | c.209T>G | p.Phe70Cys | p.F70C | P60660 | protein_coding | deleterious(0) | probably_damaging(0.915) | TCGA-A5-A0G2-01 | Endometrium | uterine corpus endometrioid carcinoma | Female | <65 | III/IV | Unknown | Unknown | SD |
| MYL6 | SNV | Missense_Mutation | rs372692919 | c.449N>T | p.Ser150Leu | p.S150L | P60660 | protein_coding | deleterious(0.04) | benign(0.003) | TCGA-AP-A0LM-01 | Endometrium | uterine corpus endometrioid carcinoma | Female | <65 | III/IV | Chemotherapy | cisplatin | SD |
| MYL6 | SNV | Missense_Mutation | novel | c.42G>T | p.Glu14Asp | p.E14D | P60660 | protein_coding | tolerated(0.23) | benign(0.009) | TCGA-AX-A06F-01 | Endometrium | uterine corpus endometrioid carcinoma | Female | <65 | III/IV | Chemotherapy | carboplatin | SD |
| MYL6 | SNV | Missense_Mutation | c.337N>G | p.Leu113Val | p.L113V | P60660 | protein_coding | deleterious(0) | probably_damaging(0.995) | TCGA-33-4547-01 | Lung | lung squamous cell carcinoma | Male | >=65 | I/II | Unknown | Unknown | SD |
| Page: 1 |
Top |
Related drugs of malignant transformation related genes |
| Identification of chemicals and drugs interact with genes involved in malignant transfromation |
| (DGIdb 4.0) |
| Entrez ID | Symbol | Category | Interaction Types | Drug Claim Name | Drug Name | PMIDs |
| Page: 1 |

Copyright 2023-Present -The University of Texas Health Science Center at Houston |