
|
|||||
|
 | |
| |
| |
| |
| |
| |
|
Gene: MYL5 |
Gene summary for MYL5 |
| Gene information | Species | Human | Gene symbol | MYL5 | Gene ID | 4636 |
| Gene name | myosin light chain 5 | |
| Gene Alias | MYLC2 | |
| Cytomap | 4p16.3 | |
| Gene Type | protein-coding | GO ID | GO:0003008 | UniProtAcc | Q02045 |
Top |
Malignant transformation analysis |
| Identification of the aberrant gene expression in precancerous and cancerous lesions by comparing the gene expression of stem-like cells in diseased tissues with normal stem cells |
| Entrez ID | Symbol | Replicates | Species | Organ | Tissue | Adj P-value | Log2FC | Malignancy |
| 4636 | MYL5 | HCC1_Meng | Human | Liver | HCC | 4.82e-17 | 1.05e-02 | 0.0246 |
| 4636 | MYL5 | HCC2 | Human | Liver | HCC | 4.92e-02 | 3.25e+00 | 0.5341 |
| 4636 | MYL5 | S016 | Human | Liver | HCC | 2.21e-02 | 2.32e-02 | 0.2243 |
| 4636 | MYL5 | S027 | Human | Liver | HCC | 3.30e-04 | 3.32e-01 | 0.2446 |
| 4636 | MYL5 | S028 | Human | Liver | HCC | 3.49e-10 | 3.55e-01 | 0.2503 |
| 4636 | MYL5 | S029 | Human | Liver | HCC | 4.28e-12 | 5.09e-01 | 0.2581 |
| 4636 | MYL5 | C21 | Human | Oral cavity | OSCC | 1.64e-04 | 2.37e-01 | 0.2678 |
| 4636 | MYL5 | C30 | Human | Oral cavity | OSCC | 9.01e-06 | 4.63e-01 | 0.3055 |
| 4636 | MYL5 | C38 | Human | Oral cavity | OSCC | 4.41e-05 | 6.12e-01 | 0.172 |
| 4636 | MYL5 | C46 | Human | Oral cavity | OSCC | 3.98e-13 | 3.36e-01 | 0.1673 |
| 4636 | MYL5 | C57 | Human | Oral cavity | OSCC | 5.67e-03 | 1.70e-01 | 0.1679 |
| 4636 | MYL5 | LN46 | Human | Oral cavity | OSCC | 2.45e-02 | 3.48e-01 | 0.1666 |
| 4636 | MYL5 | LP15 | Human | Oral cavity | LP | 1.98e-03 | 5.99e-01 | 0.2174 |
| 4636 | MYL5 | SYSMH1 | Human | Oral cavity | OSCC | 2.34e-02 | 1.83e-01 | 0.1127 |
| 4636 | MYL5 | SYSMH2 | Human | Oral cavity | OSCC | 3.49e-09 | 3.52e-01 | 0.2326 |
| 4636 | MYL5 | SYSMH3 | Human | Oral cavity | OSCC | 4.51e-02 | 1.51e-01 | 0.2442 |
| Page: 1 |
| Tissue | Expression Dynamics | Abbreviation |
| Liver |  | HCC: Hepatocellular carcinoma |
| NAFLD: Non-alcoholic fatty liver disease | ||
| Oral Cavity | 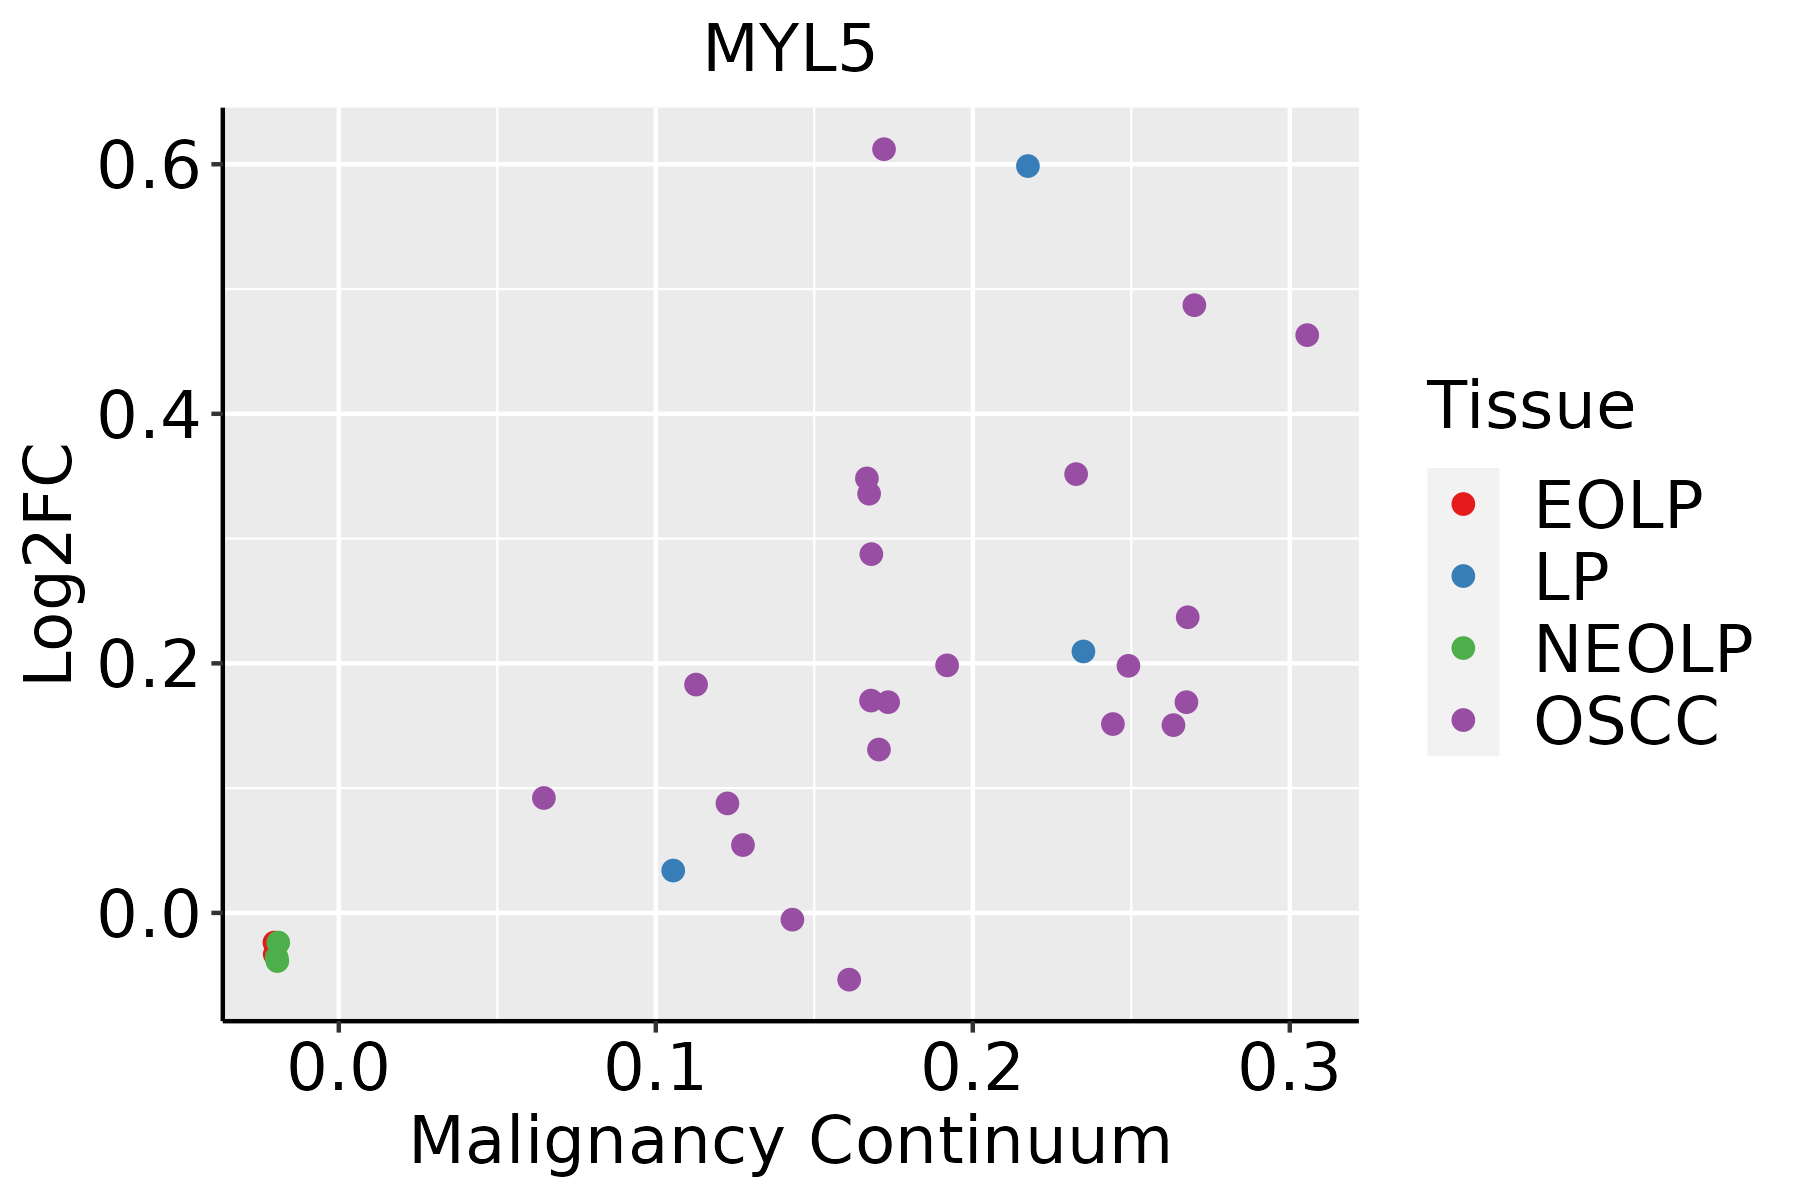 | EOLP: Erosive Oral lichen planus |
| LP: leukoplakia | ||
| NEOLP: Non-erosive oral lichen planus | ||
| OSCC: Oral squamous cell carcinoma |
| ∗log2FC in expression of this searched gene in stem-like cells from each diseased tissue sample relative to stem-like cells in normal samples in each tissue plotted against the malignancy continuum. Samples are colored based on if they are from different disease stage. |
Top |
Malignant transformation related pathway analysis |
| Find out the enriched GO biological processes and KEGG pathways involved in transition from healthy to precancer to cancer |
| Tissue | Disease Stage | Enriched GO biological Processes |
| Colorectum | AD |  |
| Colorectum | SER |  |
| Colorectum | MSS |  |
| Colorectum | MSI-H |  |
| Colorectum | FAP |  |
| ∗Top 15 enriched GO BP terms are showed in the bar plot of each disease state in each tissue. Each row represents a significant GO biological process which is colored according to the -log10(p.adjust). |
| Page: 1 2 3 4 5 6 7 8 9 |
| GO ID | Tissue | Disease Stage | Description | Gene Ratio | Bg Ratio | pvalue | p.adjust | Count |
| Page: 1 |
| Pathway ID | Tissue | Disease Stage | Description | Gene Ratio | Bg Ratio | pvalue | p.adjust | qvalue | Count |
| hsa0513242 | Liver | HCC | Salmonella infection | 178/4020 | 249/8465 | 5.90e-15 | 1.98e-13 | 1.10e-13 | 178 |
| hsa0452042 | Liver | HCC | Adherens junction | 68/4020 | 93/8465 | 3.99e-07 | 4.46e-06 | 2.48e-06 | 68 |
| hsa0513142 | Liver | HCC | Shigellosis | 150/4020 | 247/8465 | 1.53e-05 | 1.04e-04 | 5.81e-05 | 150 |
| hsa0451041 | Liver | HCC | Focal adhesion | 125/4020 | 203/8465 | 3.12e-05 | 1.88e-04 | 1.04e-04 | 125 |
| hsa0481041 | Liver | HCC | Regulation of actin cytoskeleton | 134/4020 | 229/8465 | 4.48e-04 | 1.94e-03 | 1.08e-03 | 134 |
| hsa0467042 | Liver | HCC | Leukocyte transendothelial migration | 68/4020 | 114/8465 | 5.79e-03 | 1.64e-02 | 9.15e-03 | 68 |
| hsa0513252 | Liver | HCC | Salmonella infection | 178/4020 | 249/8465 | 5.90e-15 | 1.98e-13 | 1.10e-13 | 178 |
| hsa0452052 | Liver | HCC | Adherens junction | 68/4020 | 93/8465 | 3.99e-07 | 4.46e-06 | 2.48e-06 | 68 |
| hsa0513152 | Liver | HCC | Shigellosis | 150/4020 | 247/8465 | 1.53e-05 | 1.04e-04 | 5.81e-05 | 150 |
| hsa0451051 | Liver | HCC | Focal adhesion | 125/4020 | 203/8465 | 3.12e-05 | 1.88e-04 | 1.04e-04 | 125 |
| hsa0481051 | Liver | HCC | Regulation of actin cytoskeleton | 134/4020 | 229/8465 | 4.48e-04 | 1.94e-03 | 1.08e-03 | 134 |
| hsa0467052 | Liver | HCC | Leukocyte transendothelial migration | 68/4020 | 114/8465 | 5.79e-03 | 1.64e-02 | 9.15e-03 | 68 |
| hsa0513230 | Oral cavity | OSCC | Salmonella infection | 174/3704 | 249/8465 | 2.67e-17 | 1.49e-15 | 7.58e-16 | 174 |
| hsa0451019 | Oral cavity | OSCC | Focal adhesion | 128/3704 | 203/8465 | 1.71e-08 | 1.63e-07 | 8.31e-08 | 128 |
| hsa0513130 | Oral cavity | OSCC | Shigellosis | 150/3704 | 247/8465 | 3.96e-08 | 3.12e-07 | 1.59e-07 | 150 |
| hsa0452029 | Oral cavity | OSCC | Adherens junction | 62/3704 | 93/8465 | 6.34e-06 | 3.12e-05 | 1.59e-05 | 62 |
| hsa0481026 | Oral cavity | OSCC | Regulation of actin cytoskeleton | 129/3704 | 229/8465 | 7.14e-05 | 2.74e-04 | 1.40e-04 | 129 |
| hsa0436014 | Oral cavity | OSCC | Axon guidance | 97/3704 | 182/8465 | 5.59e-03 | 1.33e-02 | 6.76e-03 | 97 |
| hsa0467030 | Oral cavity | OSCC | Leukocyte transendothelial migration | 63/3704 | 114/8465 | 8.46e-03 | 1.96e-02 | 9.95e-03 | 63 |
| hsa05132114 | Oral cavity | OSCC | Salmonella infection | 174/3704 | 249/8465 | 2.67e-17 | 1.49e-15 | 7.58e-16 | 174 |
| Page: 1 2 |
Top |
Cell-cell communication analysis |
| Identification of potential cell-cell interactions between two cell types and their ligand-receptor pairs for different disease states |
| Ligand | Receptor | LRpair | Pathway | Tissue | Disease Stage |
| Page: 1 |
Top |
Single-cell gene regulatory network inference analysis |
| Find out the significant the regulons (TFs) and the target genes of each regulon across cell types for different disease states |
| TF | Cell Type | Tissue | Disease Stage | Target Gene | RSS | Regulon Activity |
| ∗The dot plots of a searched regulon are shown for all cell subpopulations in each disease state of each tissue based on the regulon specific score inferred using pySCENIC and by calculating the average expression. |
| Page: 1 |
Top |
Somatic mutation of malignant transformation related genes |
| Annotation of somatic variants for genes involved in malignant transformation |
| Hugo Symbol | Variant Class | Variant Classification | dbSNP RS | HGVSc | HGVSp | HGVSp Short | SWISSPROT | BIOTYPE | SIFT | PolyPhen | Tumor Sample Barcode | Tissue | Histology | Sex | Age | Stage | Therapy Types | Drugs | Outcome |
| MYL5 | SNV | Missense_Mutation | novel | c.82G>A | p.Glu28Lys | p.E28K | Q02045 | protein_coding | deleterious(0) | benign(0.348) | TCGA-AC-A3TN-01 | Breast | breast invasive carcinoma | Female | >=65 | I/II | Hormone Therapy | arimidex | SD |
| MYL5 | SNV | Missense_Mutation | c.137G>C | p.Arg46Pro | p.R46P | Q02045 | protein_coding | deleterious(0) | possibly_damaging(0.842) | TCGA-AR-A2LE-01 | Breast | breast invasive carcinoma | Female | >=65 | I/II | Hormone Therapy | tamoxiphen | PD | |
| MYL5 | SNV | Missense_Mutation | c.137N>C | p.Arg46Pro | p.R46P | Q02045 | protein_coding | deleterious(0) | possibly_damaging(0.842) | TCGA-E9-A1R4-01 | Breast | breast invasive carcinoma | Female | >=65 | I/II | Chemotherapy | 5-fluorouracil | SD | |
| MYL5 | SNV | Missense_Mutation | novel | c.415N>A | p.Glu139Lys | p.E139K | Q02045 | protein_coding | deleterious(0) | benign(0.129) | TCGA-C5-A8XJ-01 | Cervix | cervical & endocervical cancer | Female | >=65 | I/II | Chemotherapy | cisplatin | SD |
| MYL5 | SNV | Missense_Mutation | c.62N>T | p.Ser21Phe | p.S21F | Q02045 | protein_coding | deleterious(0.01) | possibly_damaging(0.782) | TCGA-IR-A3LL-01 | Cervix | cervical & endocervical cancer | Female | <65 | I/II | Chemotherapy | cisplatin | CR | |
| MYL5 | SNV | Missense_Mutation | novel | c.206N>G | p.Asp69Gly | p.D69G | Q02045 | protein_coding | deleterious(0) | benign(0.08) | TCGA-AA-A00N-01 | Colorectum | colon adenocarcinoma | Male | >=65 | I/II | Unknown | Unknown | PD |
| MYL5 | SNV | Missense_Mutation | c.143N>A | p.Gly48Asp | p.G48D | Q02045 | protein_coding | deleterious(0) | probably_damaging(0.969) | TCGA-EI-6507-01 | Colorectum | rectum adenocarcinoma | Male | <65 | I/II | Unknown | Unknown | SD | |
| MYL5 | SNV | Missense_Mutation | novel | c.147C>A | p.Phe49Leu | p.F49L | Q02045 | protein_coding | deleterious(0.04) | benign(0.26) | TCGA-F5-6814-01 | Colorectum | rectum adenocarcinoma | Male | <65 | I/II | Unknown | Unknown | SD |
| MYL5 | deletion | Frame_Shift_Del | novel | c.31delN | p.Gly12ValfsTer44 | p.G12Vfs*44 | Q02045 | protein_coding | TCGA-AD-A5EJ-01 | Colorectum | colon adenocarcinoma | Female | >=65 | I/II | Unknown | Unknown | SD | ||
| MYL5 | SNV | Missense_Mutation | novel | c.70N>G | p.Phe24Val | p.F24V | Q02045 | protein_coding | deleterious(0) | possibly_damaging(0.619) | TCGA-AJ-A3EL-01 | Endometrium | uterine corpus endometrioid carcinoma | Female | <65 | I/II | Unknown | Unknown | SD |
| Page: 1 2 |
Top |
Related drugs of malignant transformation related genes |
| Identification of chemicals and drugs interact with genes involved in malignant transfromation |
| (DGIdb 4.0) |
| Entrez ID | Symbol | Category | Interaction Types | Drug Claim Name | Drug Name | PMIDs |
| Page: 1 |

Copyright 2023-Present -The University of Texas Health Science Center at Houston |