
|
|||||
|
 | |
| |
| |
| |
| |
| |
|
Gene: MYL12B |
Gene summary for MYL12B |
| Gene information | Species | Human | Gene symbol | MYL12B | Gene ID | 103910 |
| Gene name | myosin light chain 12B | |
| Gene Alias | MLC-B | |
| Cytomap | 18p11.31 | |
| Gene Type | protein-coding | GO ID | GO:0000902 | UniProtAcc | O14950 |
Top |
Malignant transformation analysis |
| Identification of the aberrant gene expression in precancerous and cancerous lesions by comparing the gene expression of stem-like cells in diseased tissues with normal stem cells |
| Entrez ID | Symbol | Replicates | Species | Organ | Tissue | Adj P-value | Log2FC | Malignancy |
| 103910 | MYL12B | GSM4909282 | Human | Breast | IDC | 8.41e-09 | 2.53e-01 | -0.0288 |
| 103910 | MYL12B | GSM4909286 | Human | Breast | IDC | 8.11e-11 | -1.82e-01 | 0.1081 |
| 103910 | MYL12B | GSM4909287 | Human | Breast | IDC | 3.59e-04 | -2.86e-01 | 0.2057 |
| 103910 | MYL12B | GSM4909288 | Human | Breast | IDC | 2.85e-02 | -1.36e-01 | 0.0988 |
| 103910 | MYL12B | GSM4909292 | Human | Breast | IDC | 8.76e-04 | -7.23e-01 | 0.1236 |
| 103910 | MYL12B | GSM4909293 | Human | Breast | IDC | 1.24e-08 | -2.04e-01 | 0.1581 |
| 103910 | MYL12B | GSM4909297 | Human | Breast | IDC | 8.21e-11 | -2.24e-01 | 0.1517 |
| 103910 | MYL12B | GSM4909298 | Human | Breast | IDC | 7.55e-06 | -1.99e-01 | 0.1551 |
| 103910 | MYL12B | GSM4909306 | Human | Breast | IDC | 7.78e-03 | -2.09e-01 | 0.1564 |
| 103910 | MYL12B | GSM4909307 | Human | Breast | IDC | 1.58e-06 | -4.67e-01 | 0.1569 |
| 103910 | MYL12B | GSM4909308 | Human | Breast | IDC | 5.70e-27 | -6.22e-01 | 0.158 |
| 103910 | MYL12B | GSM4909311 | Human | Breast | IDC | 7.25e-50 | -9.70e-01 | 0.1534 |
| 103910 | MYL12B | GSM4909312 | Human | Breast | IDC | 2.44e-18 | -5.87e-01 | 0.1552 |
| 103910 | MYL12B | GSM4909313 | Human | Breast | IDC | 2.58e-06 | -3.26e-01 | 0.0391 |
| 103910 | MYL12B | GSM4909315 | Human | Breast | IDC | 2.12e-06 | 1.41e-01 | 0.21 |
| 103910 | MYL12B | GSM4909316 | Human | Breast | IDC | 6.76e-03 | 3.05e-01 | 0.21 |
| 103910 | MYL12B | GSM4909319 | Human | Breast | IDC | 3.13e-51 | -6.07e-01 | 0.1563 |
| 103910 | MYL12B | GSM4909320 | Human | Breast | IDC | 6.81e-11 | -5.08e-01 | 0.1575 |
| 103910 | MYL12B | GSM4909321 | Human | Breast | IDC | 6.41e-08 | -3.82e-01 | 0.1559 |
| 103910 | MYL12B | ctrl6 | Human | Breast | Precancer | 1.00e-18 | 5.71e-01 | -0.0061 |
| Page: 1 2 3 4 5 6 7 8 9 10 11 12 13 14 15 16 17 18 19 |
| Tissue | Expression Dynamics | Abbreviation |
| Breast | 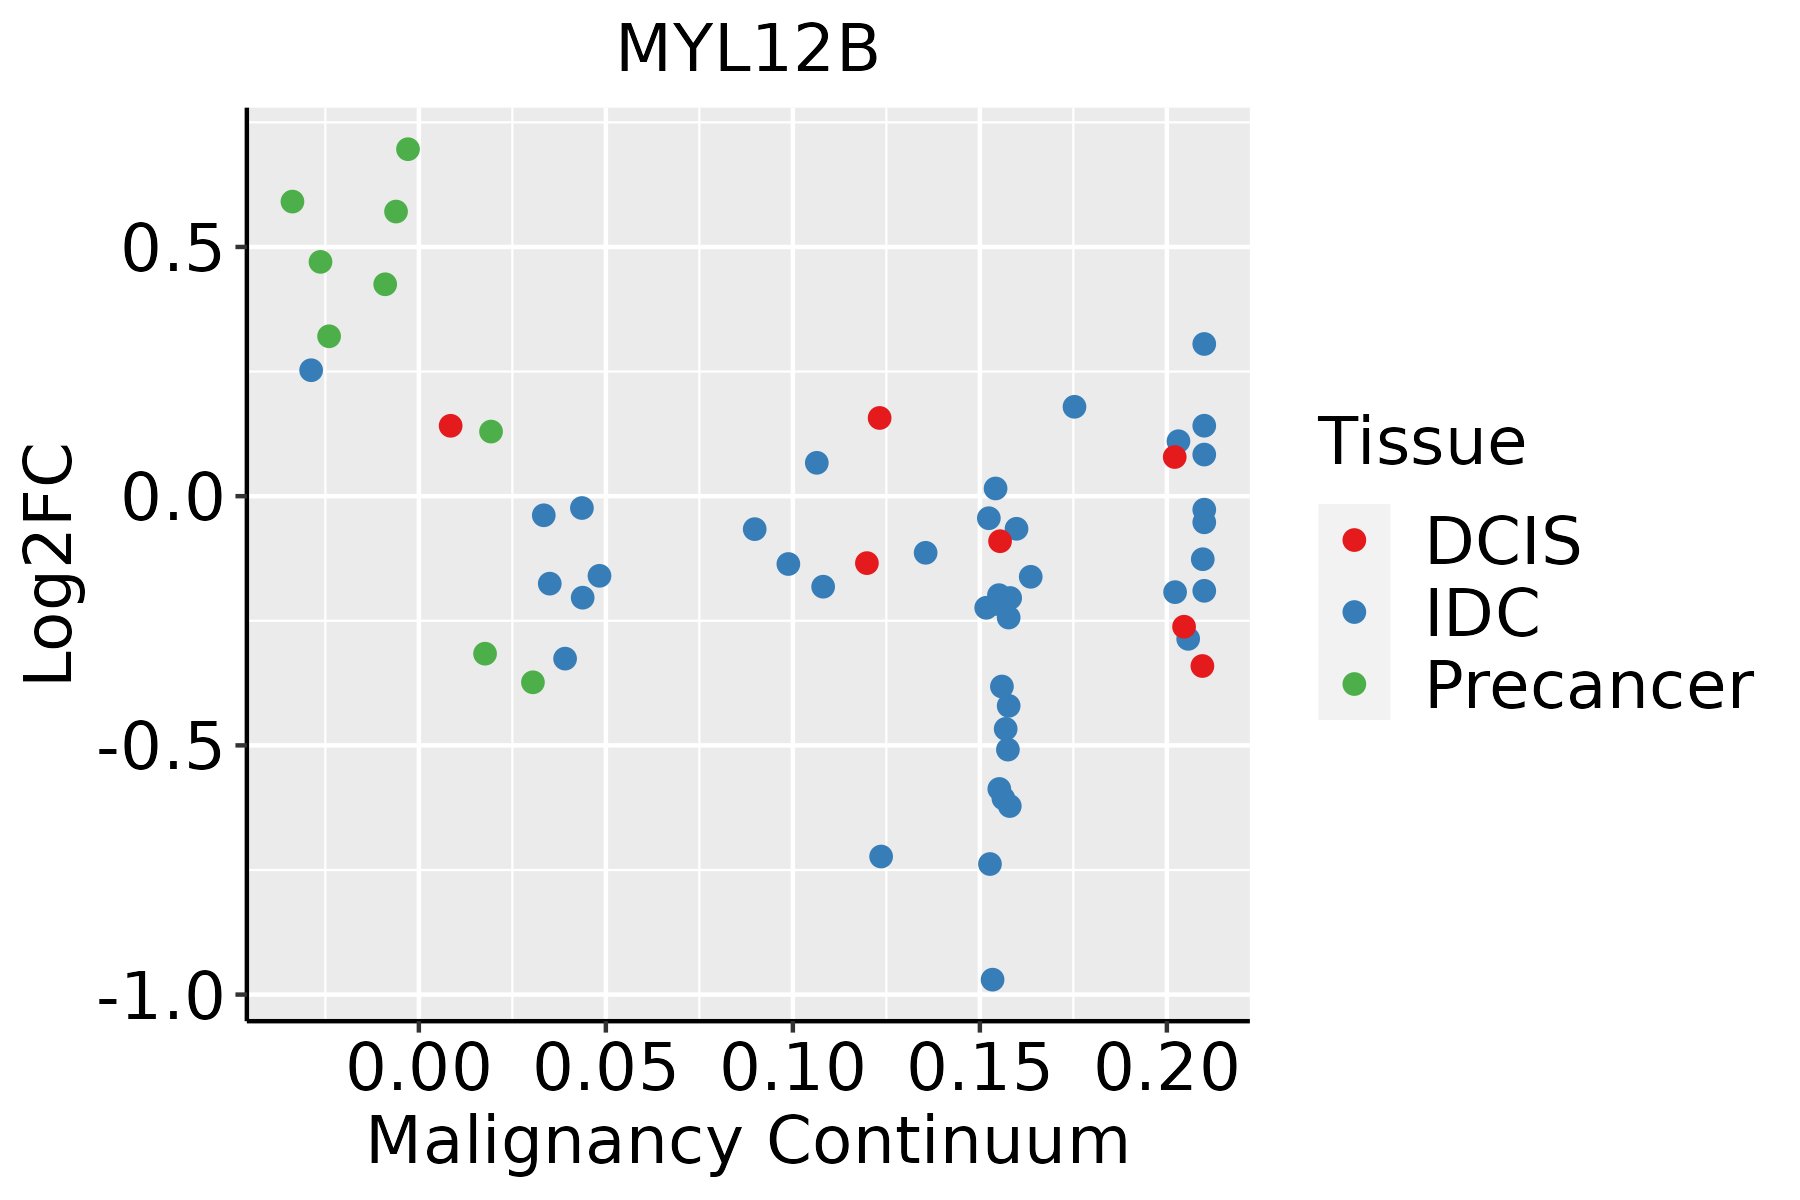 | IDC: Invasive ductal carcinoma |
| DCIS: Ductal carcinoma in situ | ||
| Precancer(BRCA1-mut): Precancerous lesion from BRCA1 mutation carriers | ||
| Cervix |  | CC: Cervix cancer |
| HSIL_HPV: HPV-infected high-grade squamous intraepithelial lesions | ||
| N_HPV: HPV-infected normal cervix | ||
| Colorectum (GSE201348) |  | FAP: Familial adenomatous polyposis |
| CRC: Colorectal cancer | ||
| Colorectum (HTA11) |  | AD: Adenomas |
| SER: Sessile serrated lesions | ||
| MSI-H: Microsatellite-high colorectal cancer | ||
| MSS: Microsatellite stable colorectal cancer | ||
| Endometrium |  | AEH: Atypical endometrial hyperplasia |
| EEC: Endometrioid Cancer | ||
| Esophagus | 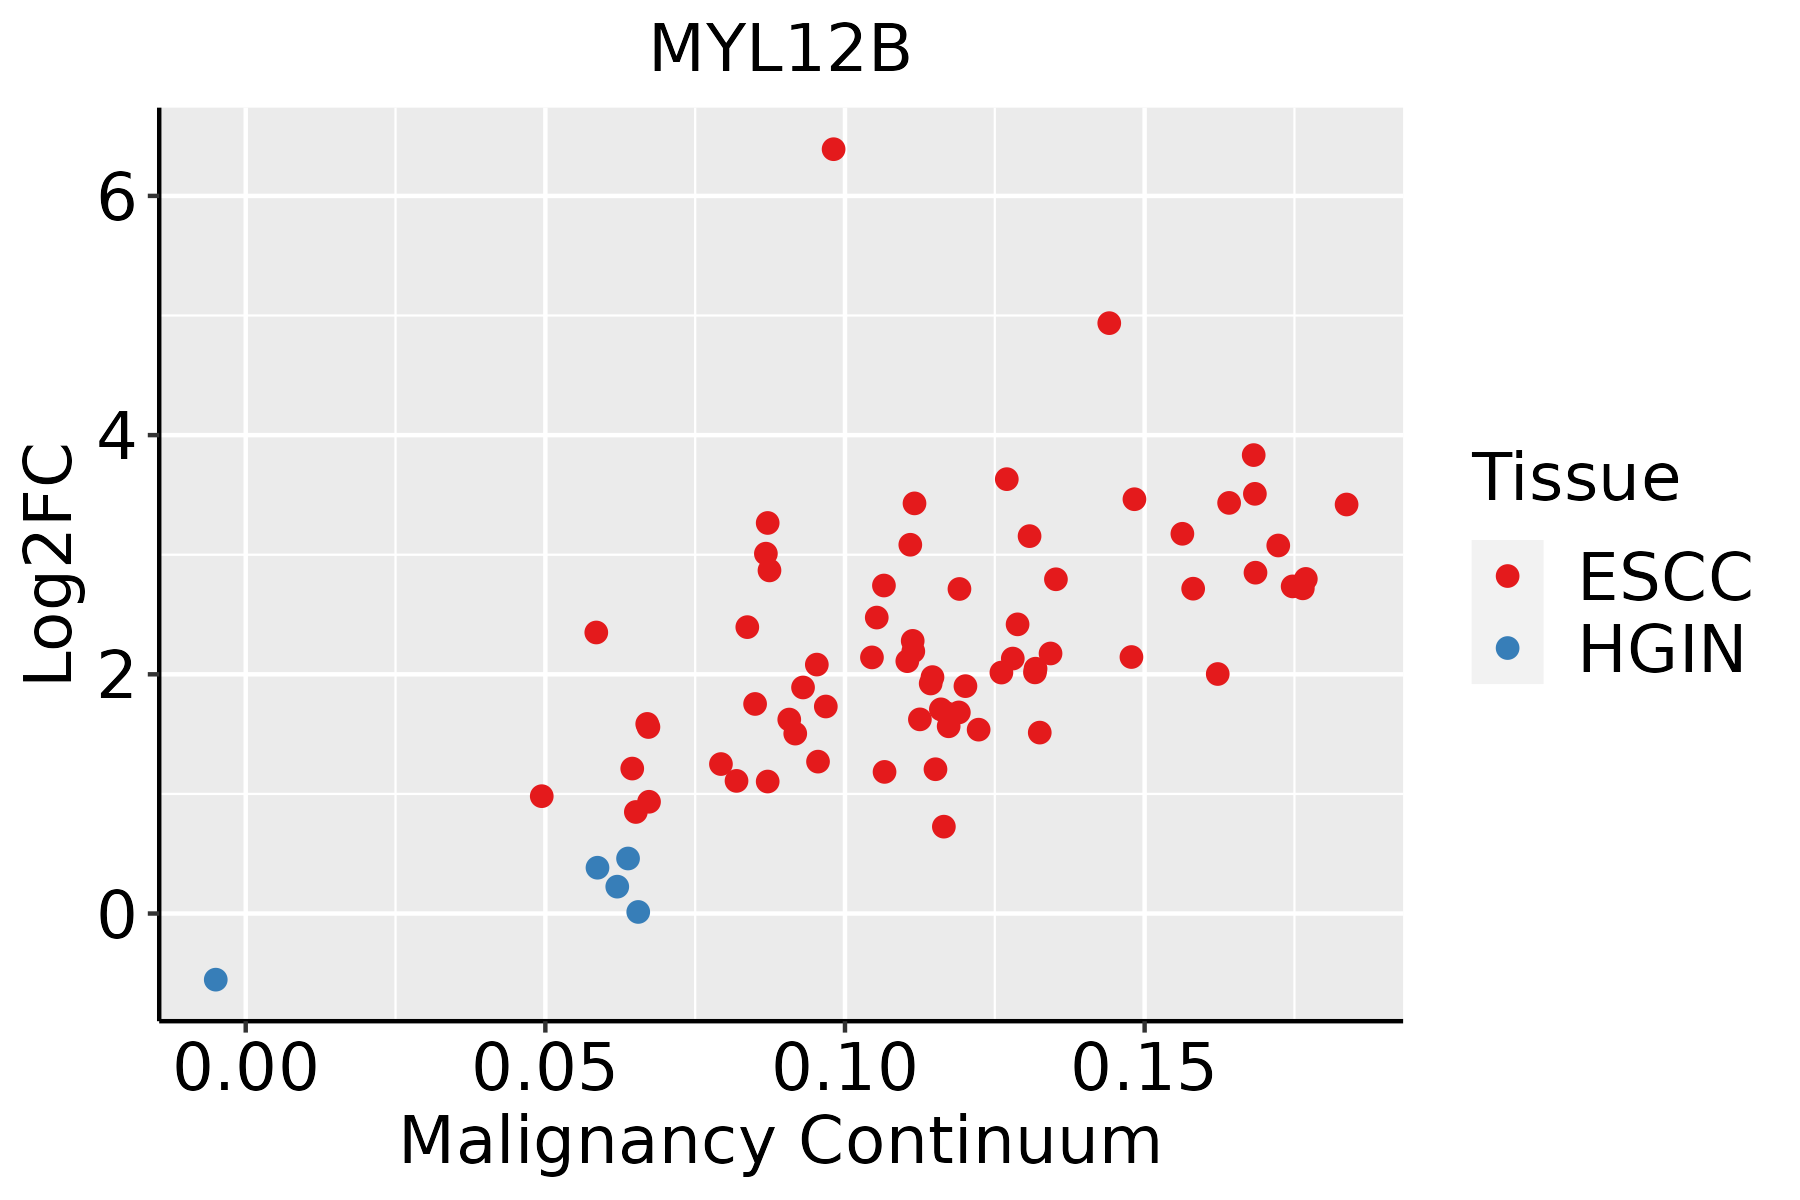 | ESCC: Esophageal squamous cell carcinoma |
| HGIN: High-grade intraepithelial neoplasias | ||
| LGIN: Low-grade intraepithelial neoplasias | ||
| GC | 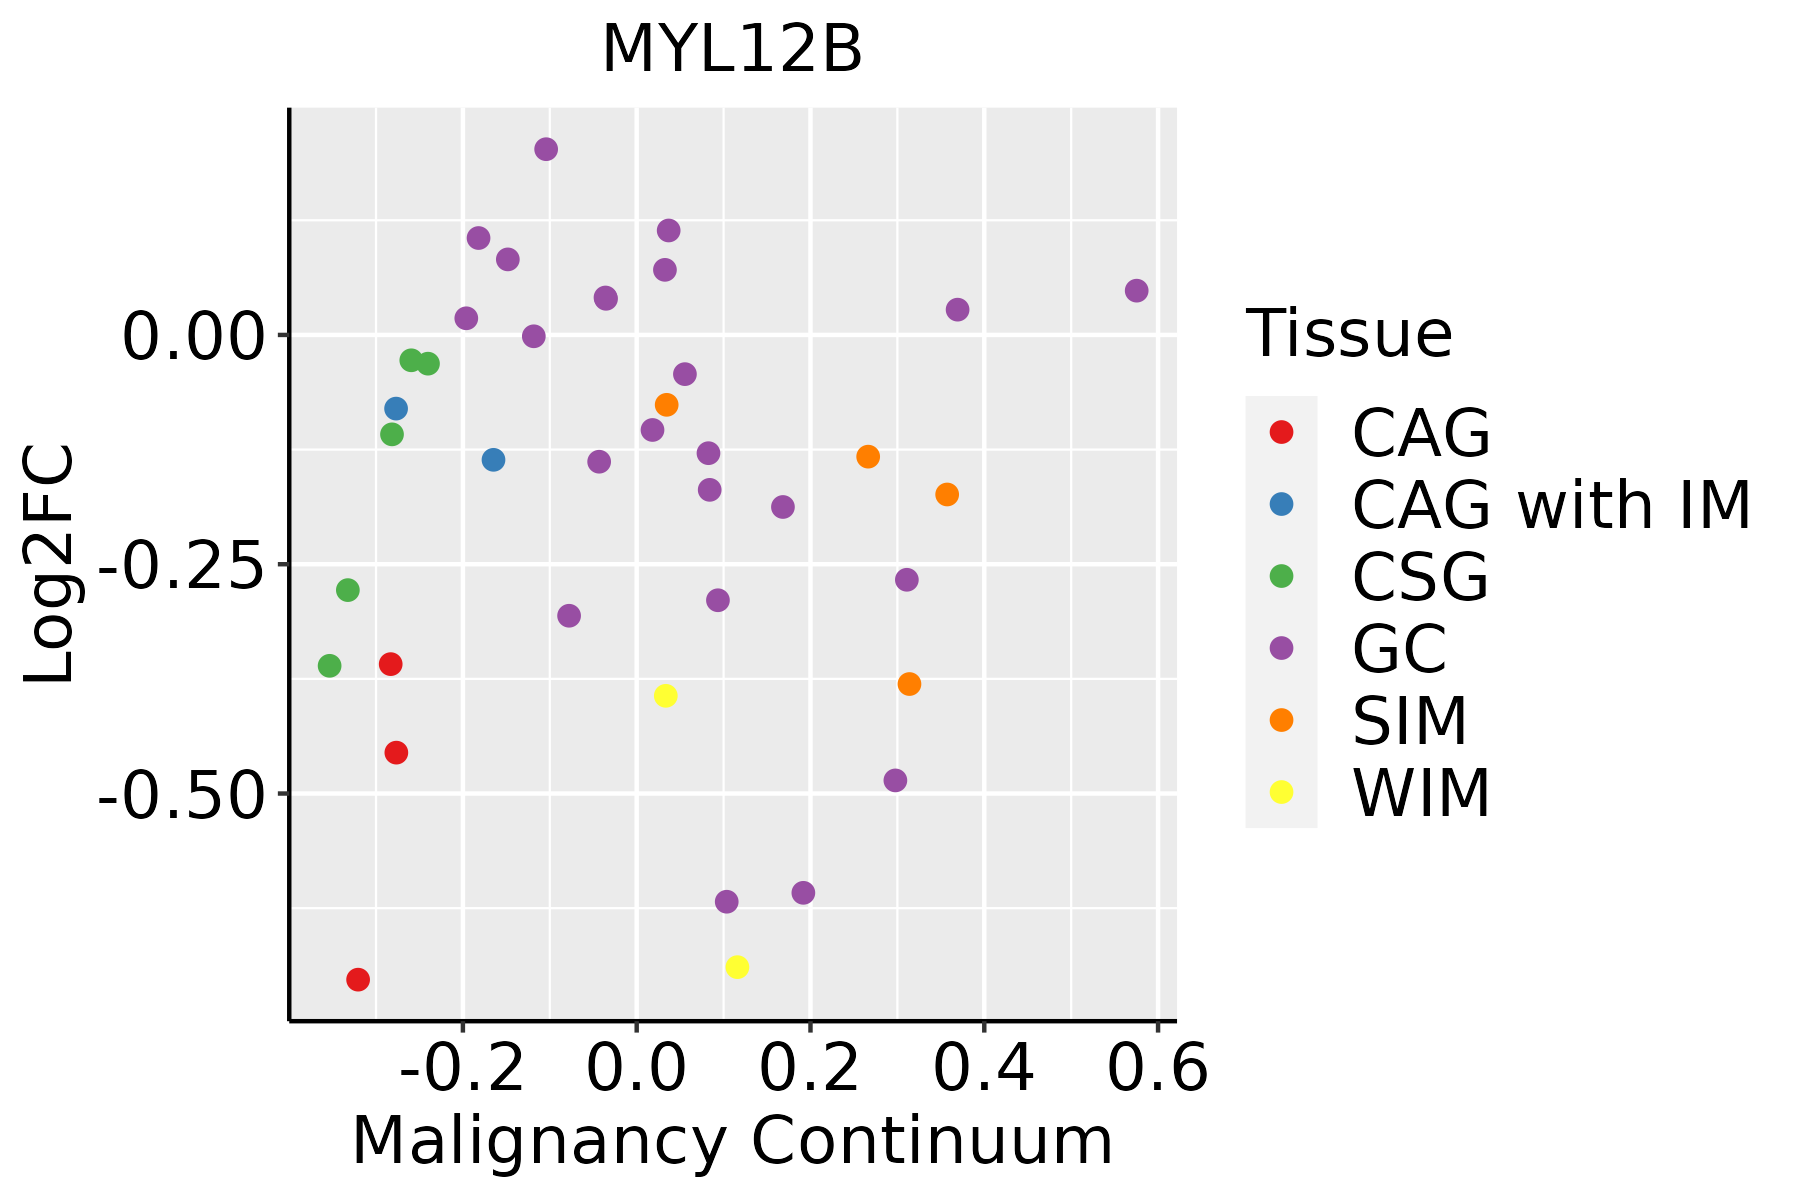 | CAG: Chronic atrophic gastritis |
| CAG with IM: Chronic atrophic gastritis with intestinal metaplasia | ||
| CSG: Chronic superficial gastritis | ||
| GC: Gastric cancer | ||
| SIM: Severe intestinal metaplasia | ||
| WIM: Wild intestinal metaplasia | ||
| Liver | 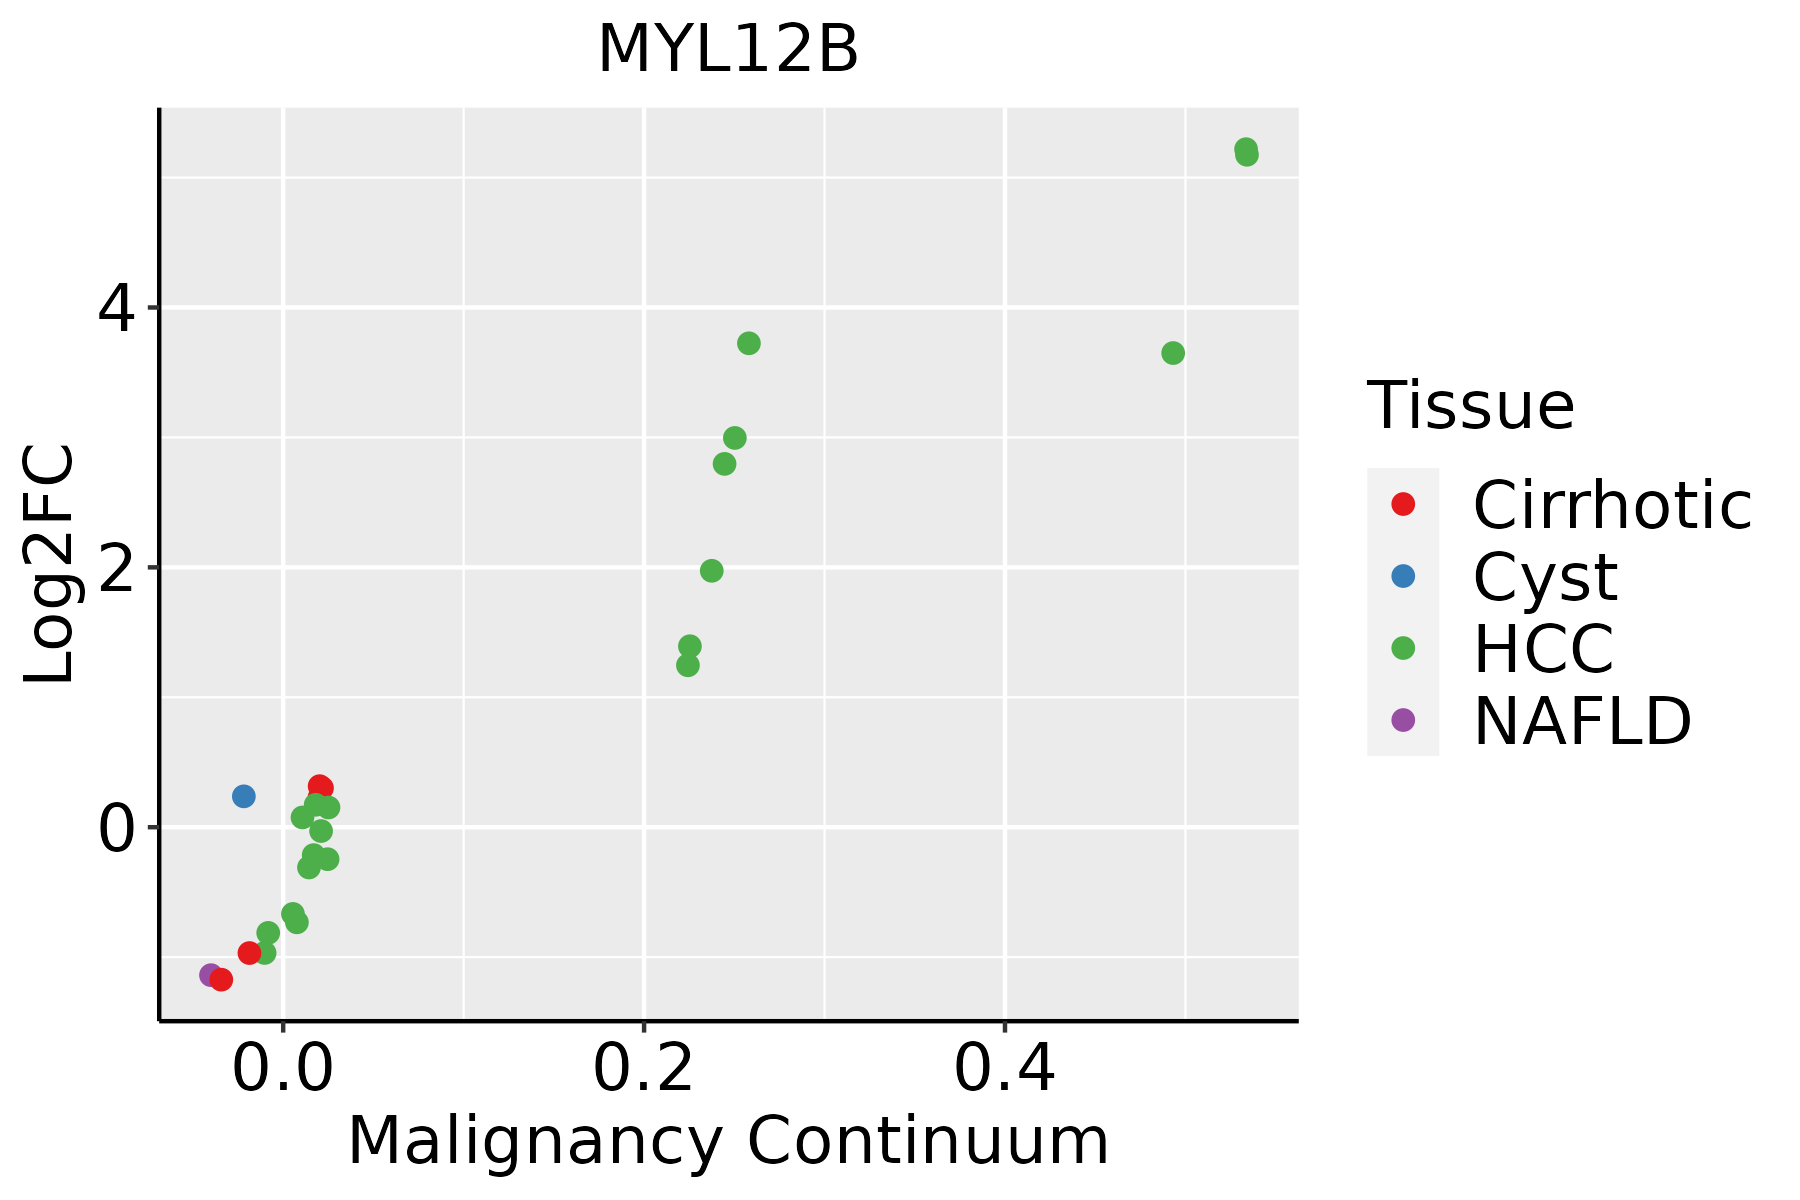 | HCC: Hepatocellular carcinoma |
| NAFLD: Non-alcoholic fatty liver disease | ||
| Lung | 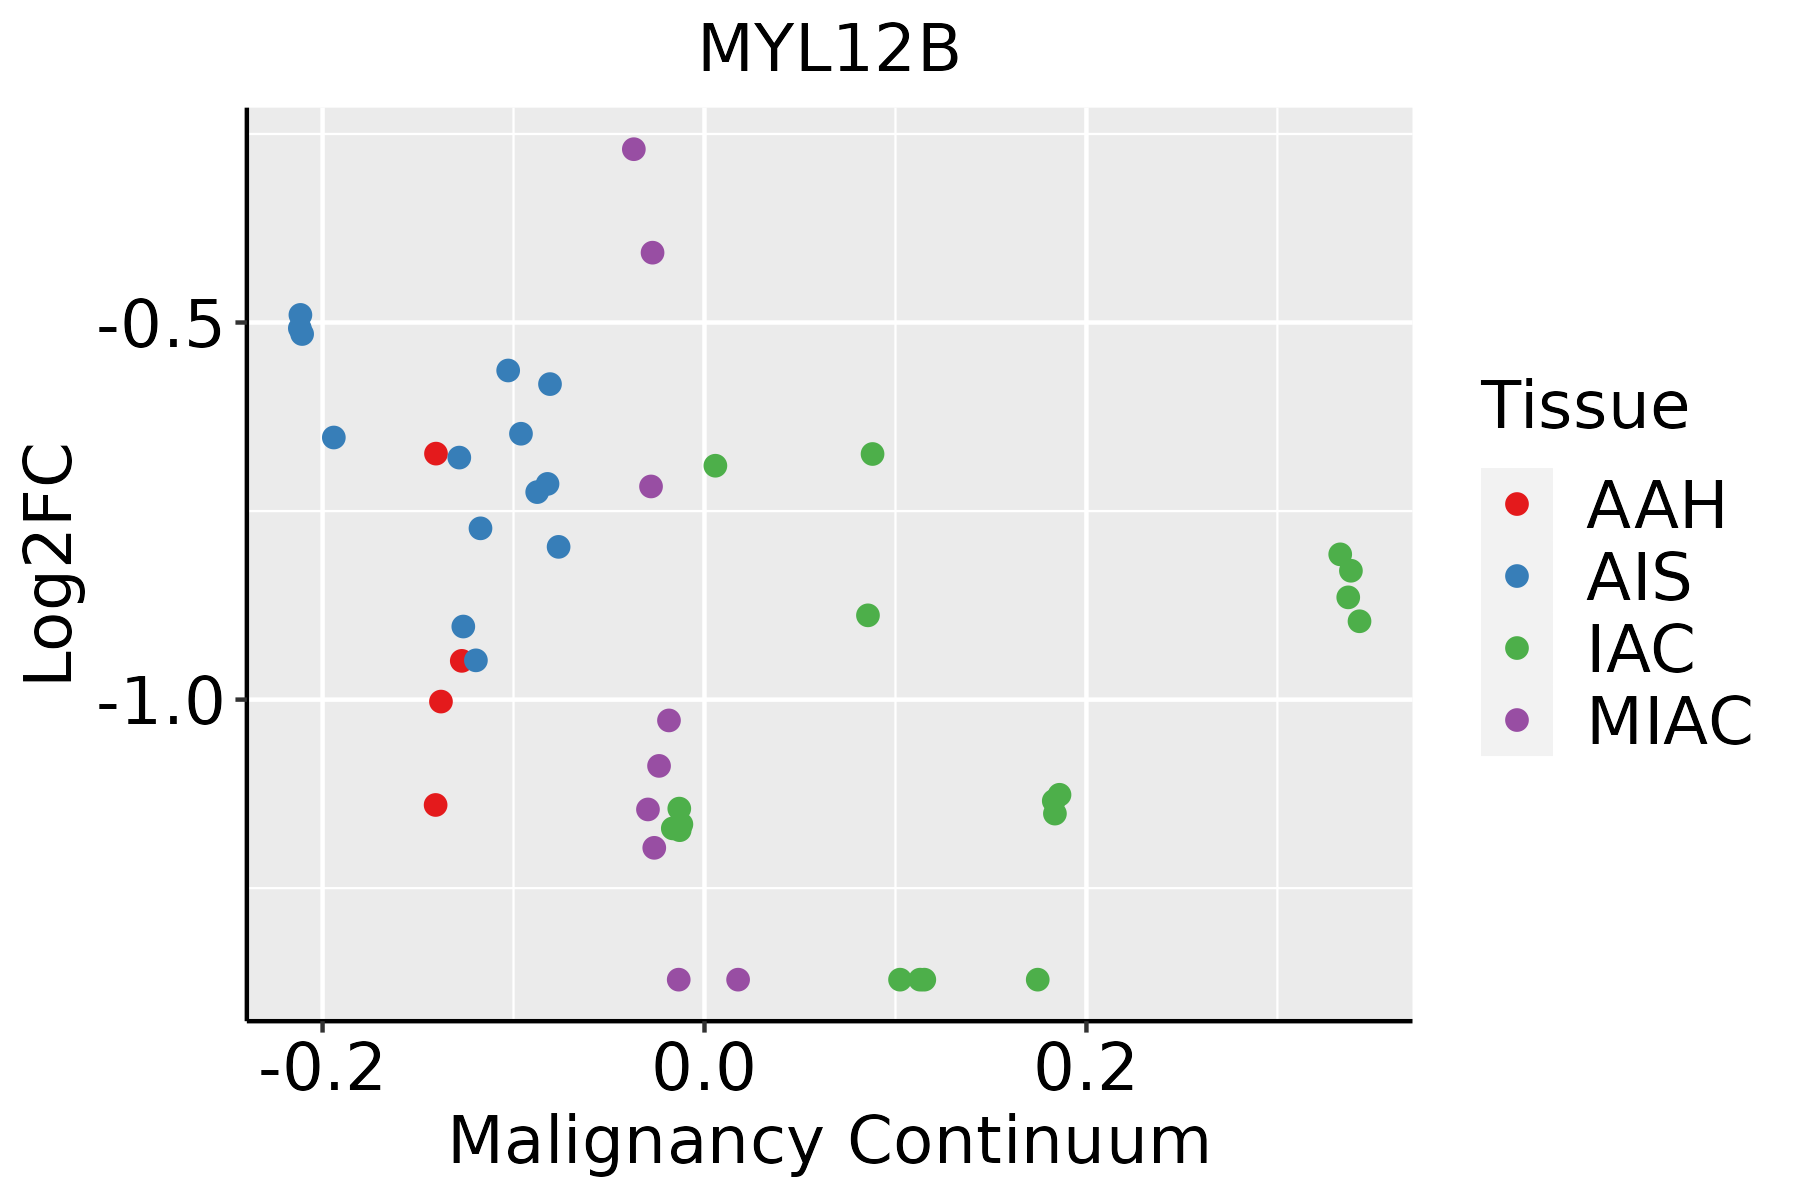 | AAH: Atypical adenomatous hyperplasia |
| AIS: Adenocarcinoma in situ | ||
| IAC: Invasive lung adenocarcinoma | ||
| MIA: Minimally invasive adenocarcinoma | ||
| Oral Cavity | 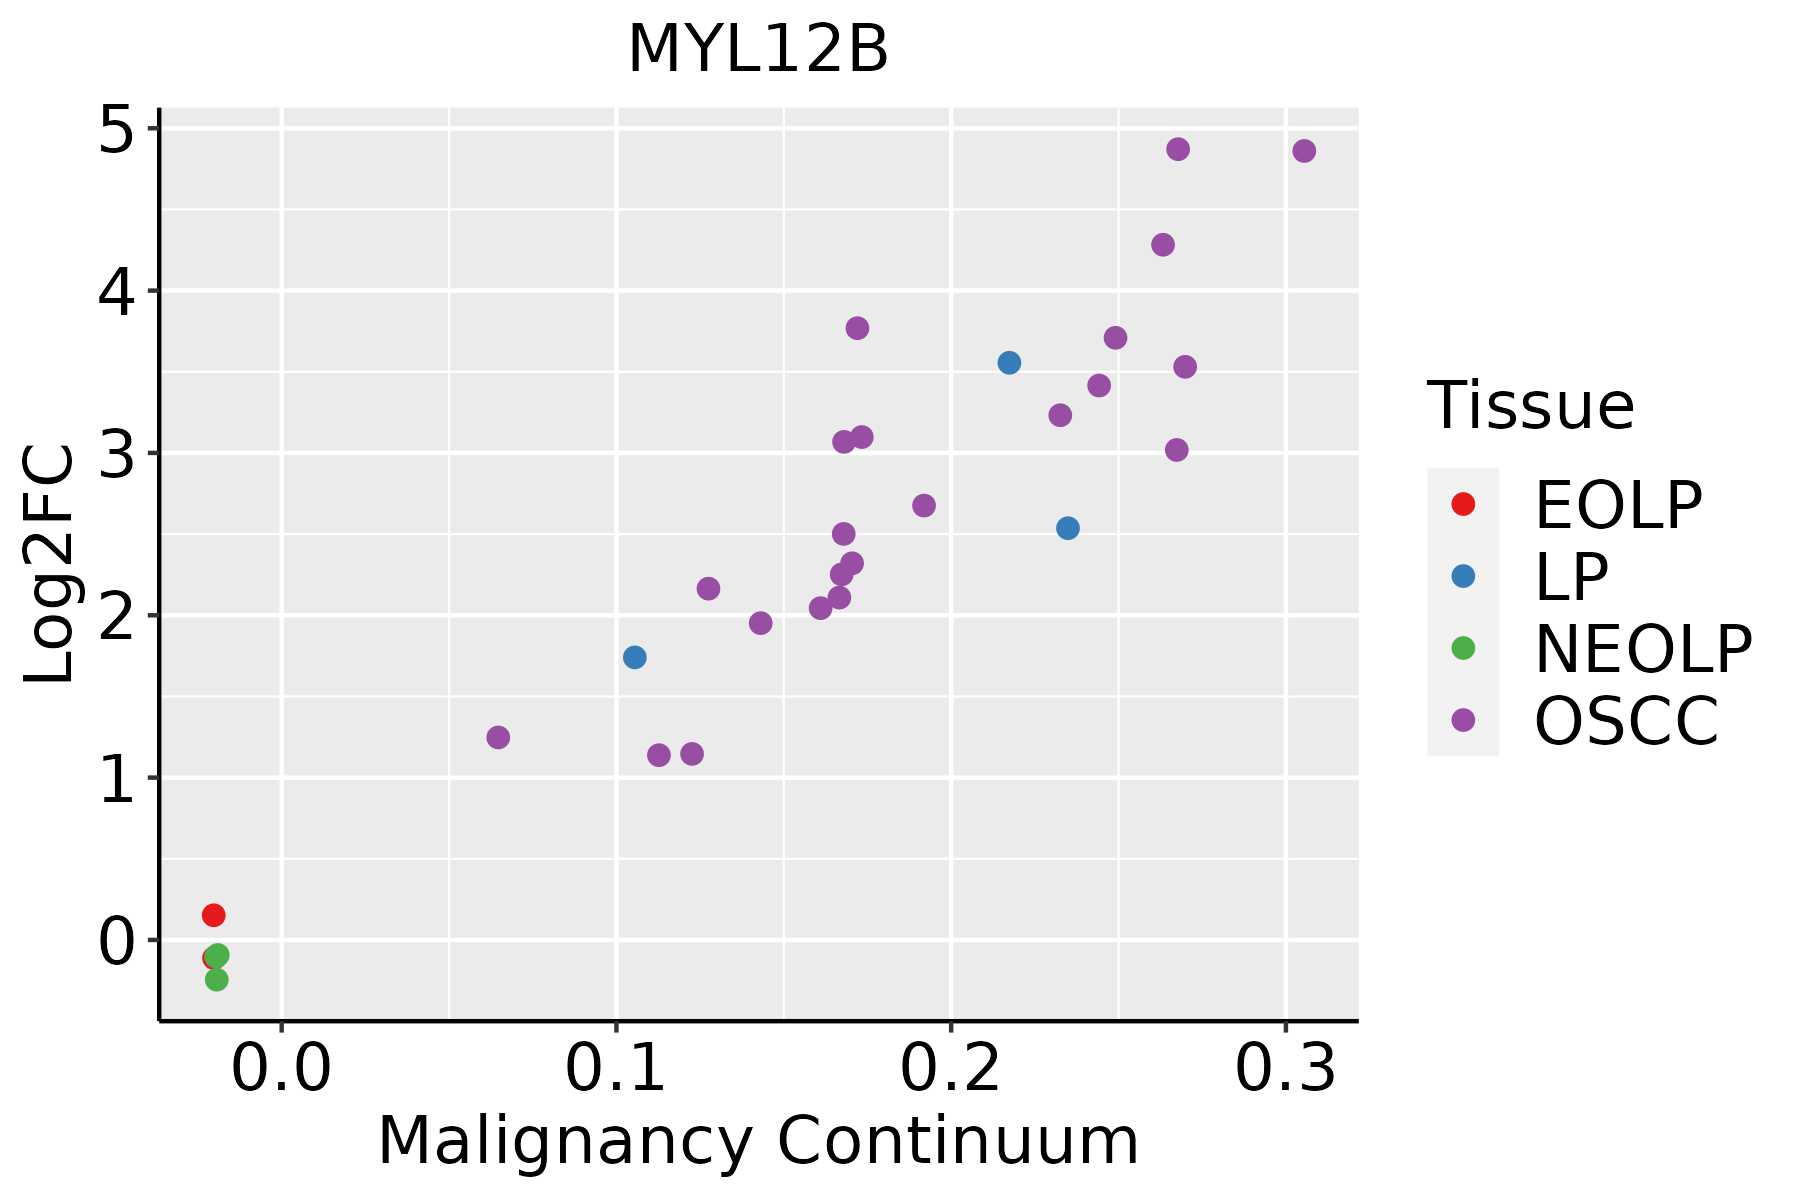 | EOLP: Erosive Oral lichen planus |
| LP: leukoplakia | ||
| NEOLP: Non-erosive oral lichen planus | ||
| OSCC: Oral squamous cell carcinoma | ||
| Prostate |  | BPH: Benign Prostatic Hyperplasia |
| Skin | 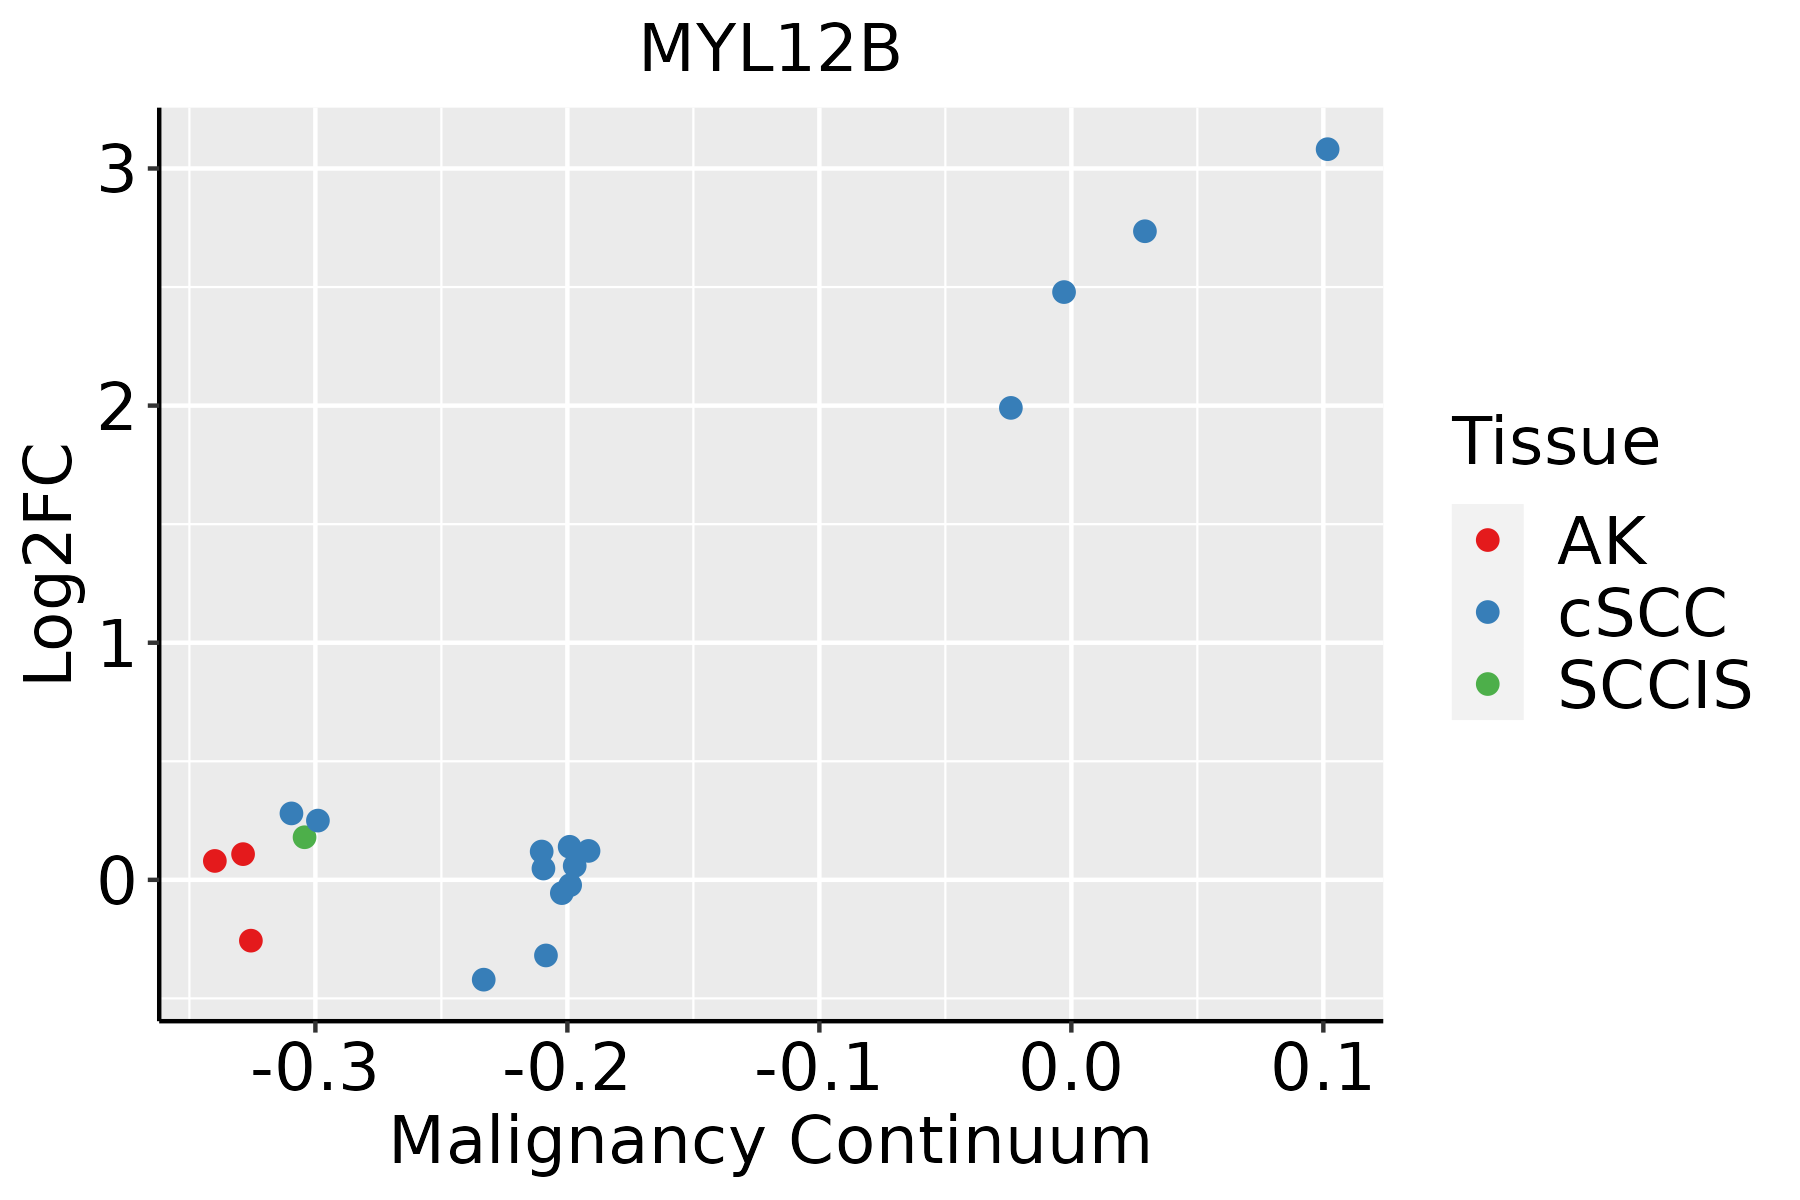 | AK: Actinic keratosis |
| cSCC: Cutaneous squamous cell carcinoma | ||
| SCCIS:squamous cell carcinoma in situ | ||
| Thyroid | 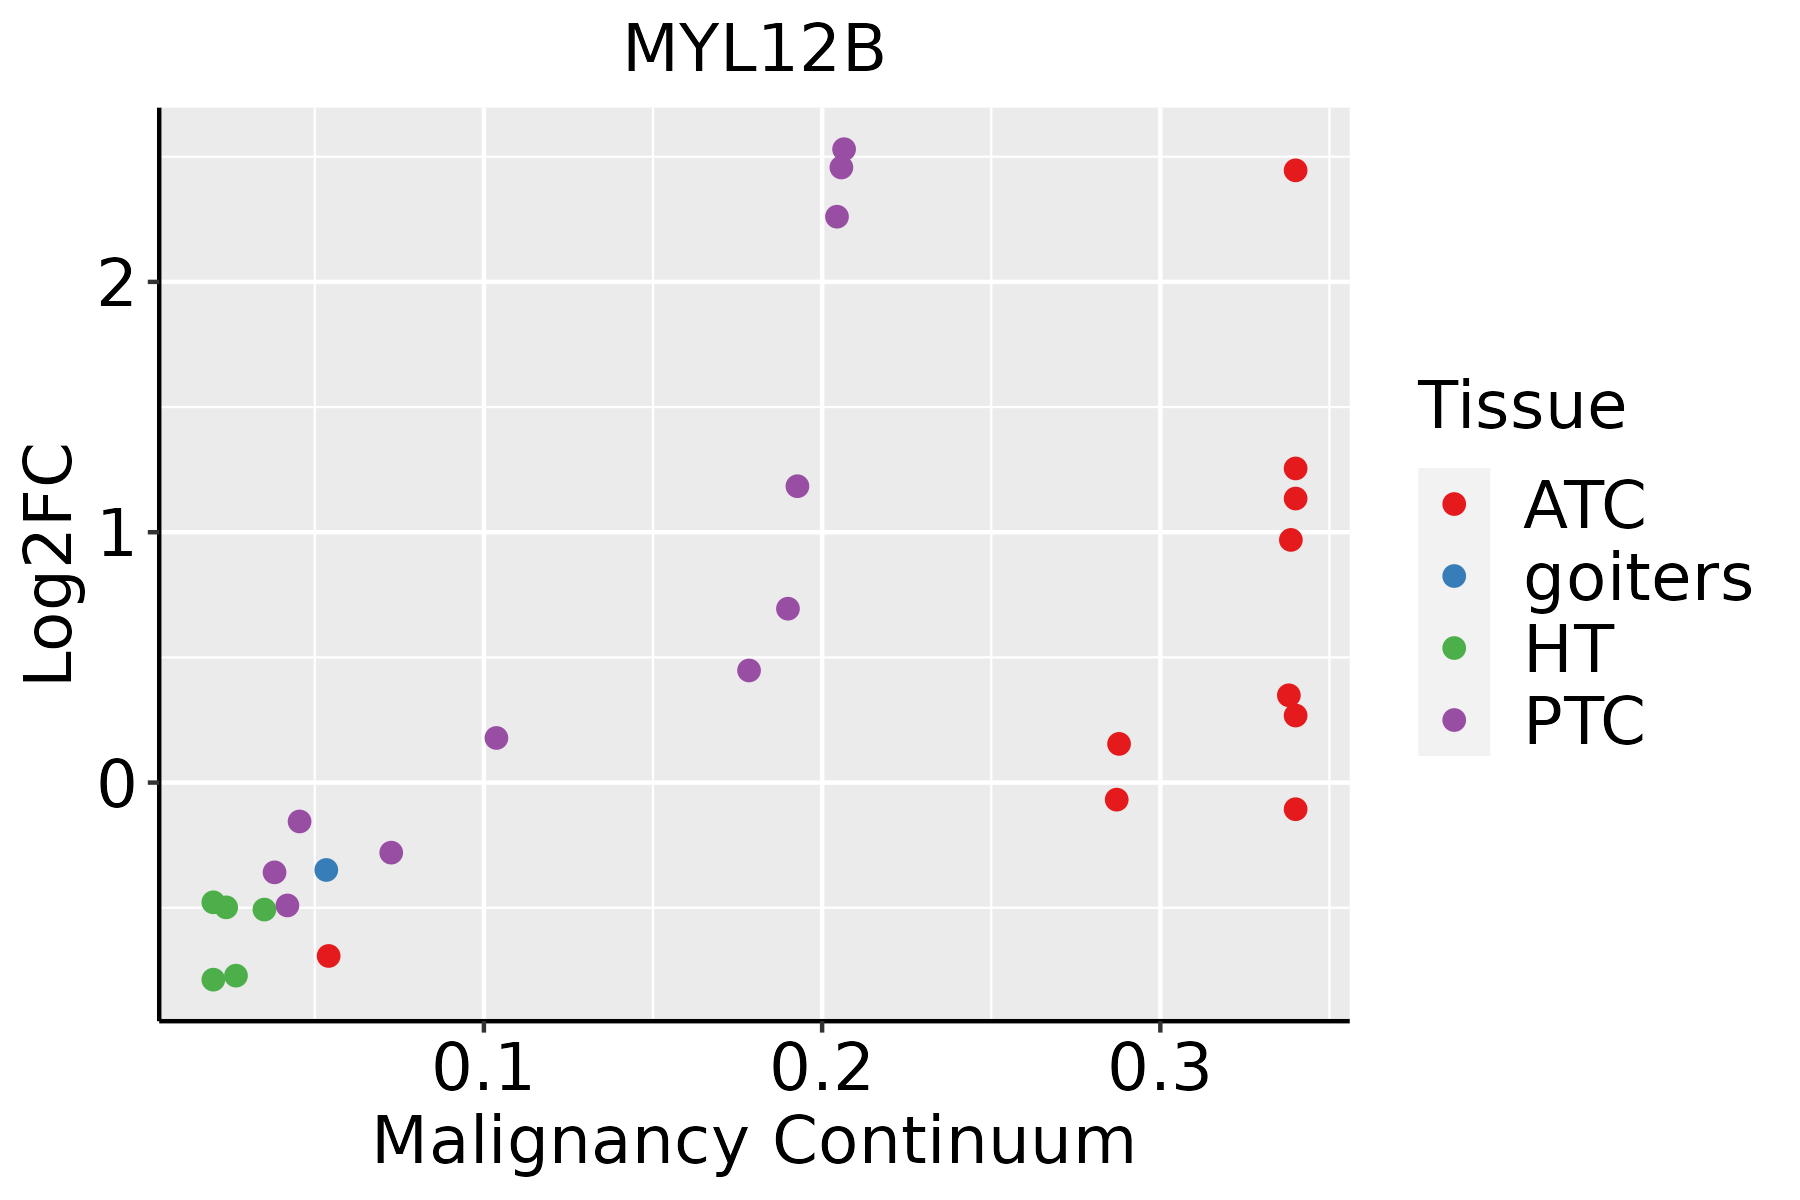 | ATC: Anaplastic thyroid cancer |
| HT: Hashimoto's thyroiditis | ||
| PTC: Papillary thyroid cancer |
| ∗log2FC in expression of this searched gene in stem-like cells from each diseased tissue sample relative to stem-like cells in normal samples in each tissue plotted against the malignancy continuum. Samples are colored based on if they are from different disease stage. |
Top |
Malignant transformation related pathway analysis |
| Find out the enriched GO biological processes and KEGG pathways involved in transition from healthy to precancer to cancer |
| Tissue | Disease Stage | Enriched GO biological Processes |
| Colorectum | AD |  |
| Colorectum | SER |  |
| Colorectum | MSS |  |
| Colorectum | MSI-H |  |
| Colorectum | FAP |  |
| ∗Top 15 enriched GO BP terms are showed in the bar plot of each disease state in each tissue. Each row represents a significant GO biological process which is colored according to the -log10(p.adjust). |
| Page: 1 2 3 4 5 6 7 8 9 |
| GO ID | Tissue | Disease Stage | Description | Gene Ratio | Bg Ratio | pvalue | p.adjust | Count |
| GO:00226049 | Breast | Precancer | regulation of cell morphogenesis | 29/1080 | 309/18723 | 6.88e-03 | 4.67e-02 | 29 |
| GO:002260410 | Cervix | CC | regulation of cell morphogenesis | 84/2311 | 309/18723 | 1.00e-12 | 4.29e-10 | 84 |
| GO:00083608 | Cervix | CC | regulation of cell shape | 38/2311 | 154/18723 | 1.86e-05 | 3.46e-04 | 38 |
| GO:002260414 | Cervix | HSIL_HPV | regulation of cell morphogenesis | 25/737 | 309/18723 | 5.58e-04 | 7.93e-03 | 25 |
| GO:0022604 | Colorectum | AD | regulation of cell morphogenesis | 109/3918 | 309/18723 | 3.08e-09 | 2.07e-07 | 109 |
| GO:0008360 | Colorectum | AD | regulation of cell shape | 56/3918 | 154/18723 | 7.01e-06 | 1.73e-04 | 56 |
| GO:00226041 | Colorectum | SER | regulation of cell morphogenesis | 89/2897 | 309/18723 | 1.51e-09 | 1.52e-07 | 89 |
| GO:00083601 | Colorectum | SER | regulation of cell shape | 43/2897 | 154/18723 | 5.47e-05 | 1.30e-03 | 43 |
| GO:00226042 | Colorectum | MSS | regulation of cell morphogenesis | 103/3467 | 309/18723 | 2.70e-10 | 2.56e-08 | 103 |
| GO:00083602 | Colorectum | MSS | regulation of cell shape | 52/3467 | 154/18723 | 4.40e-06 | 1.24e-04 | 52 |
| GO:00226043 | Colorectum | MSI-H | regulation of cell morphogenesis | 45/1319 | 309/18723 | 2.70e-06 | 1.54e-04 | 45 |
| GO:00226044 | Colorectum | FAP | regulation of cell morphogenesis | 87/2622 | 309/18723 | 4.89e-11 | 1.87e-08 | 87 |
| GO:00083603 | Colorectum | FAP | regulation of cell shape | 43/2622 | 154/18723 | 4.55e-06 | 1.52e-04 | 43 |
| GO:00226045 | Colorectum | CRC | regulation of cell morphogenesis | 74/2078 | 309/18723 | 9.25e-11 | 5.04e-08 | 74 |
| GO:00083604 | Colorectum | CRC | regulation of cell shape | 38/2078 | 154/18723 | 1.51e-06 | 8.15e-05 | 38 |
| GO:002260415 | Endometrium | AEH | regulation of cell morphogenesis | 79/2100 | 309/18723 | 1.04e-12 | 2.24e-10 | 79 |
| GO:00083609 | Endometrium | AEH | regulation of cell shape | 34/2100 | 154/18723 | 7.85e-05 | 1.18e-03 | 34 |
| GO:002260416 | Endometrium | EEC | regulation of cell morphogenesis | 78/2168 | 309/18723 | 1.45e-11 | 2.28e-09 | 78 |
| GO:000836014 | Endometrium | EEC | regulation of cell shape | 34/2168 | 154/18723 | 1.47e-04 | 1.87e-03 | 34 |
| GO:002260420 | Esophagus | ESCC | regulation of cell morphogenesis | 180/8552 | 309/18723 | 5.19e-06 | 5.45e-05 | 180 |
| Page: 1 2 3 4 |
| Pathway ID | Tissue | Disease Stage | Description | Gene Ratio | Bg Ratio | pvalue | p.adjust | qvalue | Count |
| hsa0513218 | Breast | Precancer | Salmonella infection | 49/684 | 249/8465 | 2.92e-09 | 6.15e-08 | 4.71e-08 | 49 |
| hsa0513118 | Breast | Precancer | Shigellosis | 44/684 | 247/8465 | 3.91e-07 | 6.86e-06 | 5.26e-06 | 44 |
| hsa0453018 | Breast | Precancer | Tight junction | 31/684 | 169/8465 | 1.13e-05 | 1.26e-04 | 9.64e-05 | 31 |
| hsa0467018 | Breast | Precancer | Leukocyte transendothelial migration | 20/684 | 114/8465 | 7.26e-04 | 5.33e-03 | 4.09e-03 | 20 |
| hsa0452018 | Breast | Precancer | Adherens junction | 17/684 | 93/8465 | 1.11e-03 | 7.57e-03 | 5.80e-03 | 17 |
| hsa0513219 | Breast | Precancer | Salmonella infection | 49/684 | 249/8465 | 2.92e-09 | 6.15e-08 | 4.71e-08 | 49 |
| hsa0513119 | Breast | Precancer | Shigellosis | 44/684 | 247/8465 | 3.91e-07 | 6.86e-06 | 5.26e-06 | 44 |
| hsa0453019 | Breast | Precancer | Tight junction | 31/684 | 169/8465 | 1.13e-05 | 1.26e-04 | 9.64e-05 | 31 |
| hsa0467019 | Breast | Precancer | Leukocyte transendothelial migration | 20/684 | 114/8465 | 7.26e-04 | 5.33e-03 | 4.09e-03 | 20 |
| hsa0452019 | Breast | Precancer | Adherens junction | 17/684 | 93/8465 | 1.11e-03 | 7.57e-03 | 5.80e-03 | 17 |
| hsa0513224 | Breast | IDC | Salmonella infection | 55/867 | 249/8465 | 2.07e-08 | 4.49e-07 | 3.36e-07 | 55 |
| hsa0453024 | Breast | IDC | Tight junction | 38/867 | 169/8465 | 2.07e-06 | 3.20e-05 | 2.39e-05 | 38 |
| hsa0513124 | Breast | IDC | Shigellosis | 47/867 | 247/8465 | 1.78e-05 | 2.00e-04 | 1.49e-04 | 47 |
| hsa0467024 | Breast | IDC | Leukocyte transendothelial migration | 21/867 | 114/8465 | 5.41e-03 | 3.13e-02 | 2.34e-02 | 21 |
| hsa0481014 | Breast | IDC | Regulation of actin cytoskeleton | 36/867 | 229/8465 | 5.79e-03 | 3.13e-02 | 2.34e-02 | 36 |
| hsa045109 | Breast | IDC | Focal adhesion | 32/867 | 203/8465 | 8.60e-03 | 4.23e-02 | 3.17e-02 | 32 |
| hsa0513234 | Breast | IDC | Salmonella infection | 55/867 | 249/8465 | 2.07e-08 | 4.49e-07 | 3.36e-07 | 55 |
| hsa0453034 | Breast | IDC | Tight junction | 38/867 | 169/8465 | 2.07e-06 | 3.20e-05 | 2.39e-05 | 38 |
| hsa0513134 | Breast | IDC | Shigellosis | 47/867 | 247/8465 | 1.78e-05 | 2.00e-04 | 1.49e-04 | 47 |
| hsa0467034 | Breast | IDC | Leukocyte transendothelial migration | 21/867 | 114/8465 | 5.41e-03 | 3.13e-02 | 2.34e-02 | 21 |
| Page: 1 2 3 4 5 6 7 8 9 10 11 12 13 14 15 16 17 18 19 20 21 22 |
Top |
Cell-cell communication analysis |
| Identification of potential cell-cell interactions between two cell types and their ligand-receptor pairs for different disease states |
| Ligand | Receptor | LRpair | Pathway | Tissue | Disease Stage |
| Page: 1 |
Top |
Single-cell gene regulatory network inference analysis |
| Find out the significant the regulons (TFs) and the target genes of each regulon across cell types for different disease states |
| TF | Cell Type | Tissue | Disease Stage | Target Gene | RSS | Regulon Activity |
| ∗The dot plots of a searched regulon are shown for all cell subpopulations in each disease state of each tissue based on the regulon specific score inferred using pySCENIC and by calculating the average expression. |
| Page: 1 |
Top |
Somatic mutation of malignant transformation related genes |
| Annotation of somatic variants for genes involved in malignant transformation |
| Hugo Symbol | Variant Class | Variant Classification | dbSNP RS | HGVSc | HGVSp | HGVSp Short | SWISSPROT | BIOTYPE | SIFT | PolyPhen | Tumor Sample Barcode | Tissue | Histology | Sex | Age | Stage | Therapy Types | Drugs | Outcome |
| MYL12B | SNV | Missense_Mutation | rs752956376 | c.176N>T | p.Ala59Val | p.A59V | O14950 | protein_coding | tolerated(0.06) | benign(0.018) | TCGA-AN-A0AK-01 | Breast | breast invasive carcinoma | Female | >=65 | I/II | Unknown | Unknown | SD |
| MYL12B | SNV | Missense_Mutation | c.292N>T | p.Asp98Tyr | p.D98Y | O14950 | protein_coding | deleterious(0) | probably_damaging(0.999) | TCGA-AN-A0XN-01 | Breast | breast invasive carcinoma | Female | >=65 | III/IV | Unknown | Unknown | SD | |
| MYL12B | SNV | Missense_Mutation | novel | c.21N>T | p.Lys7Asn | p.K7N | O14950 | protein_coding | tolerated(0.06) | possibly_damaging(0.701) | TCGA-AZ-4315-01 | Colorectum | colon adenocarcinoma | Male | <65 | I/II | Unknown | Unknown | SD |
| MYL12B | SNV | Missense_Mutation | c.272N>A | p.Gly91Asp | p.G91D | O14950 | protein_coding | deleterious(0) | probably_damaging(0.992) | TCGA-AZ-6598-01 | Colorectum | colon adenocarcinoma | Female | >=65 | I/II | Unknown | Unknown | SD | |
| MYL12B | SNV | Missense_Mutation | novel | c.101T>G | p.Phe34Cys | p.F34C | O14950 | protein_coding | deleterious(0) | probably_damaging(1) | TCGA-A5-A0G2-01 | Endometrium | uterine corpus endometrioid carcinoma | Female | <65 | III/IV | Unknown | Unknown | SD |
| MYL12B | SNV | Missense_Mutation | novel | c.179N>A | p.Ser60Tyr | p.S60Y | O14950 | protein_coding | deleterious(0) | probably_damaging(0.995) | TCGA-A5-A1OF-01 | Endometrium | uterine corpus endometrioid carcinoma | Female | <65 | I/II | Unknown | Unknown | SD |
| MYL12B | SNV | Missense_Mutation | c.5C>T | p.Ser2Leu | p.S2L | O14950 | protein_coding | tolerated(0.08) | probably_damaging(0.996) | TCGA-AP-A0LM-01 | Endometrium | uterine corpus endometrioid carcinoma | Female | <65 | III/IV | Chemotherapy | cisplatin | SD | |
| MYL12B | SNV | Missense_Mutation | novel | c.386N>T | p.Thr129Ile | p.T129I | O14950 | protein_coding | deleterious(0) | possibly_damaging(0.601) | TCGA-AX-A06F-01 | Endometrium | uterine corpus endometrioid carcinoma | Female | <65 | III/IV | Chemotherapy | carboplatin | SD |
| MYL12B | SNV | Missense_Mutation | c.472N>A | p.Glu158Lys | p.E158K | O14950 | protein_coding | tolerated(0.2) | benign(0.007) | TCGA-BS-A0UF-01 | Endometrium | uterine corpus endometrioid carcinoma | Female | >=65 | I/II | Unknown | Unknown | SD | |
| MYL12B | SNV | Missense_Mutation | novel | c.431G>T | p.Arg144Ile | p.R144I | O14950 | protein_coding | deleterious(0.03) | benign(0.197) | TCGA-SL-A6JA-01 | Endometrium | uterine corpus endometrioid carcinoma | Female | >=65 | I/II | Unknown | Unknown | SD |
| Page: 1 2 |
Top |
Related drugs of malignant transformation related genes |
| Identification of chemicals and drugs interact with genes involved in malignant transfromation |
| (DGIdb 4.0) |
| Entrez ID | Symbol | Category | Interaction Types | Drug Claim Name | Drug Name | PMIDs |
| Page: 1 |

Copyright 2023-Present -The University of Texas Health Science Center at Houston |