| Tissue | Expression Dynamics | Abbreviation |
| Endometrium | 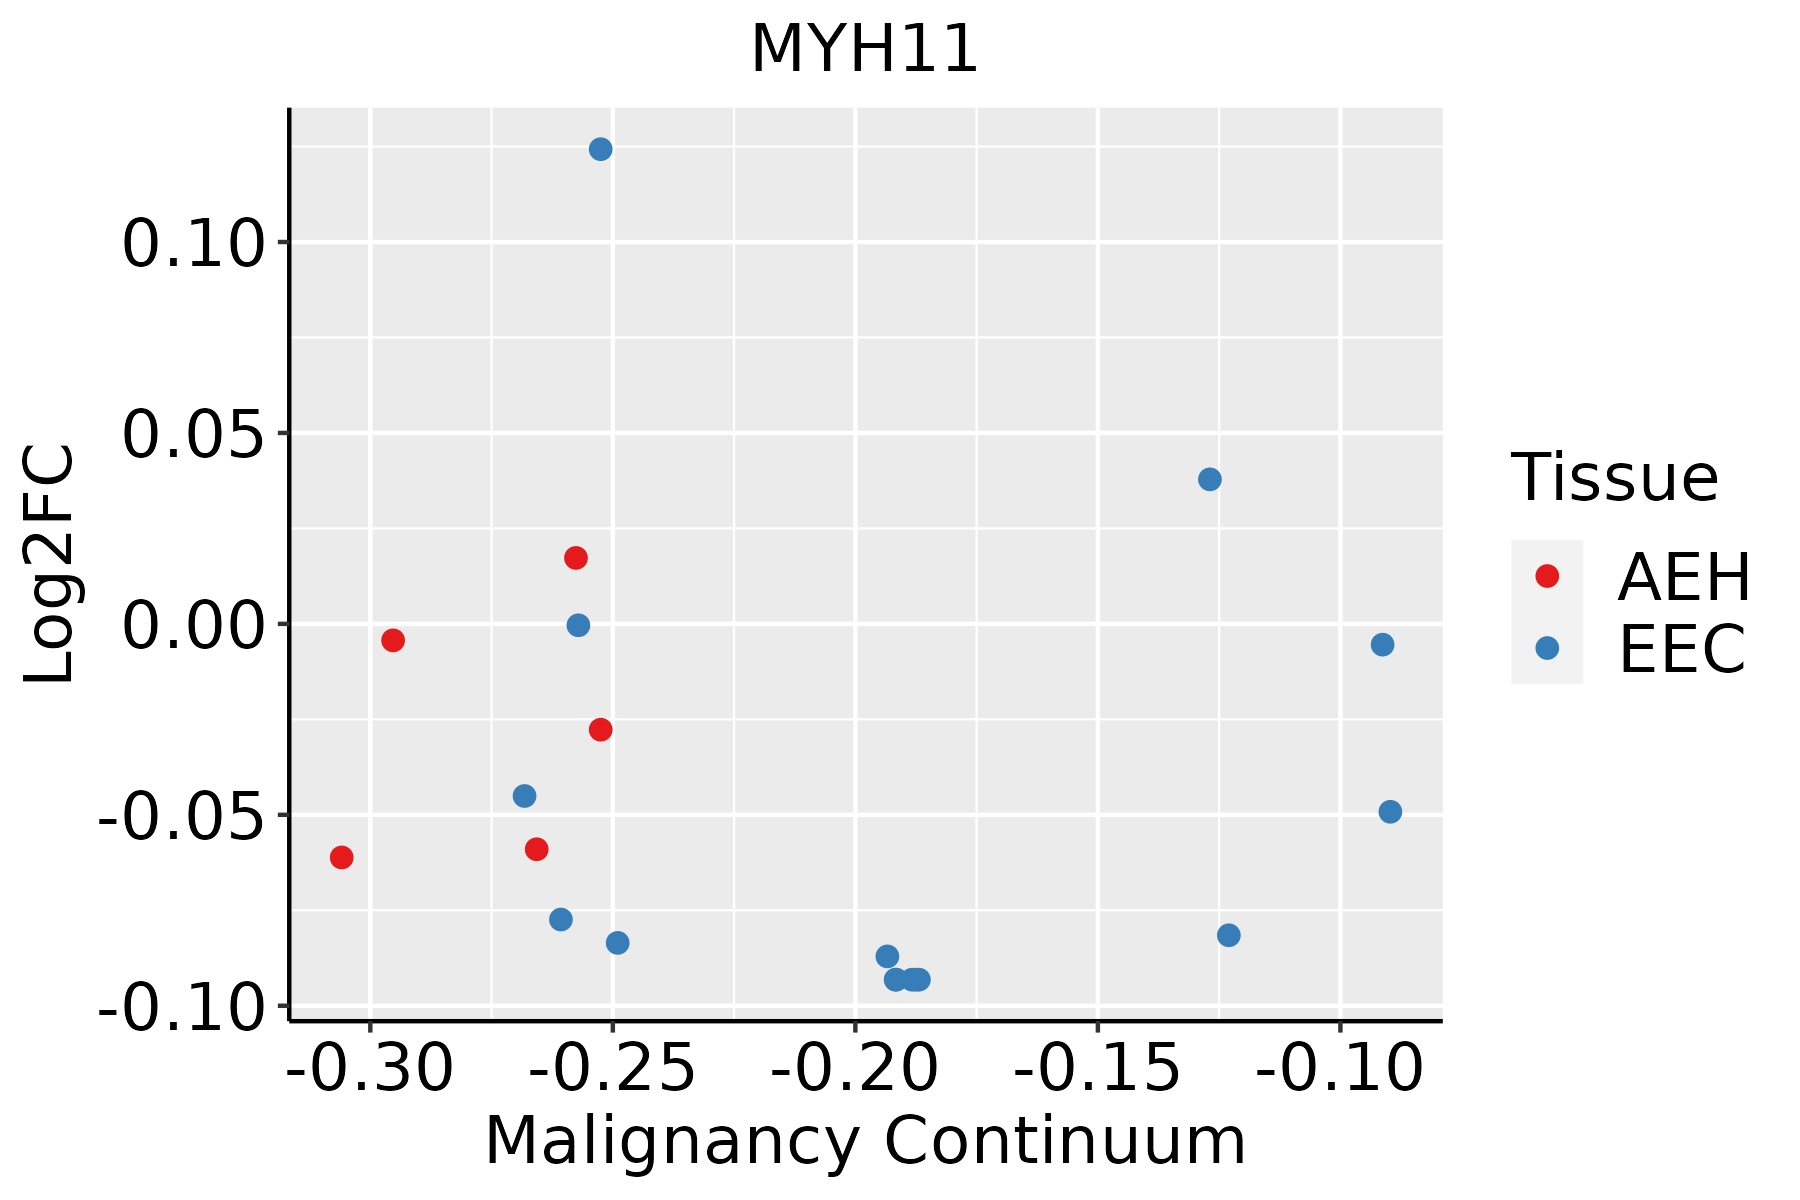 | AEH: Atypical endometrial hyperplasia |
| EEC: Endometrioid Cancer |
| Esophagus | 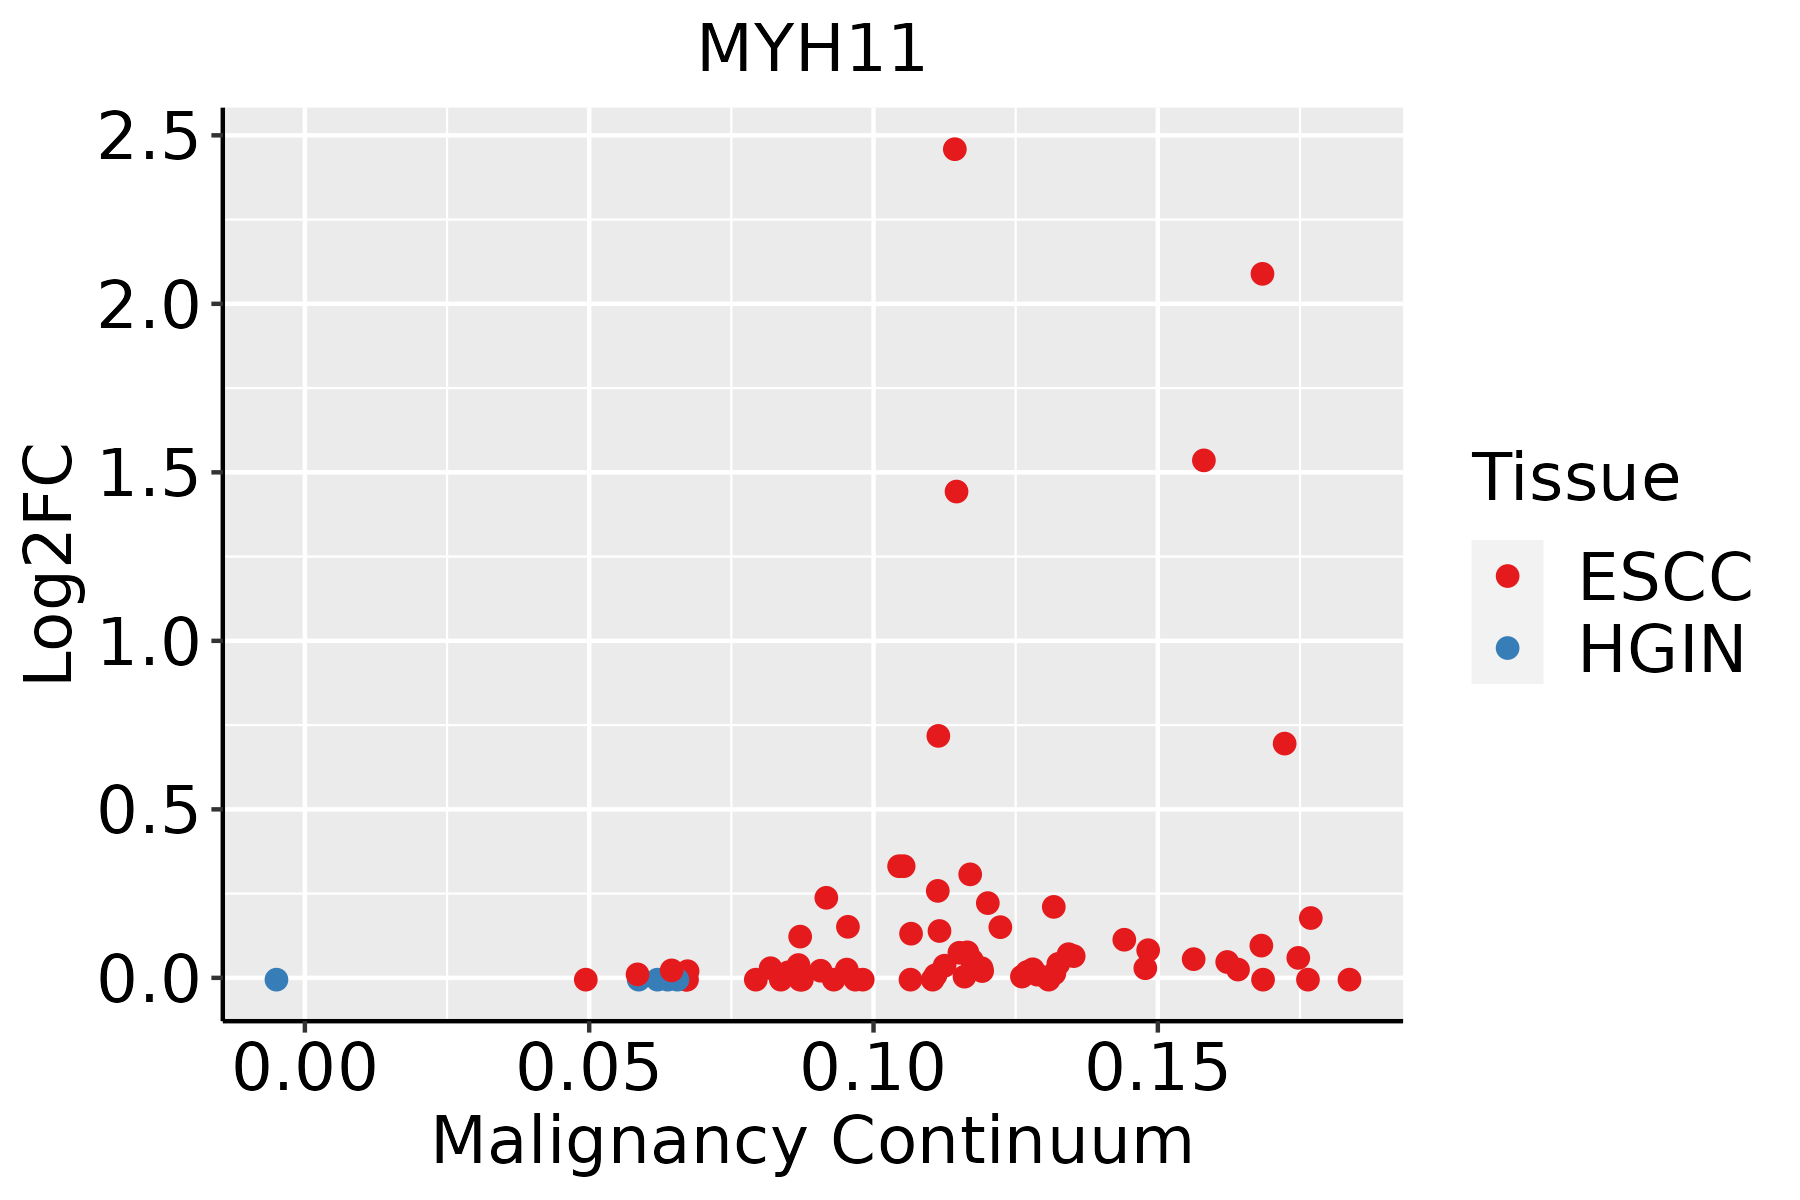 | ESCC: Esophageal squamous cell carcinoma |
| HGIN: High-grade intraepithelial neoplasias |
| LGIN: Low-grade intraepithelial neoplasias |
| Liver | 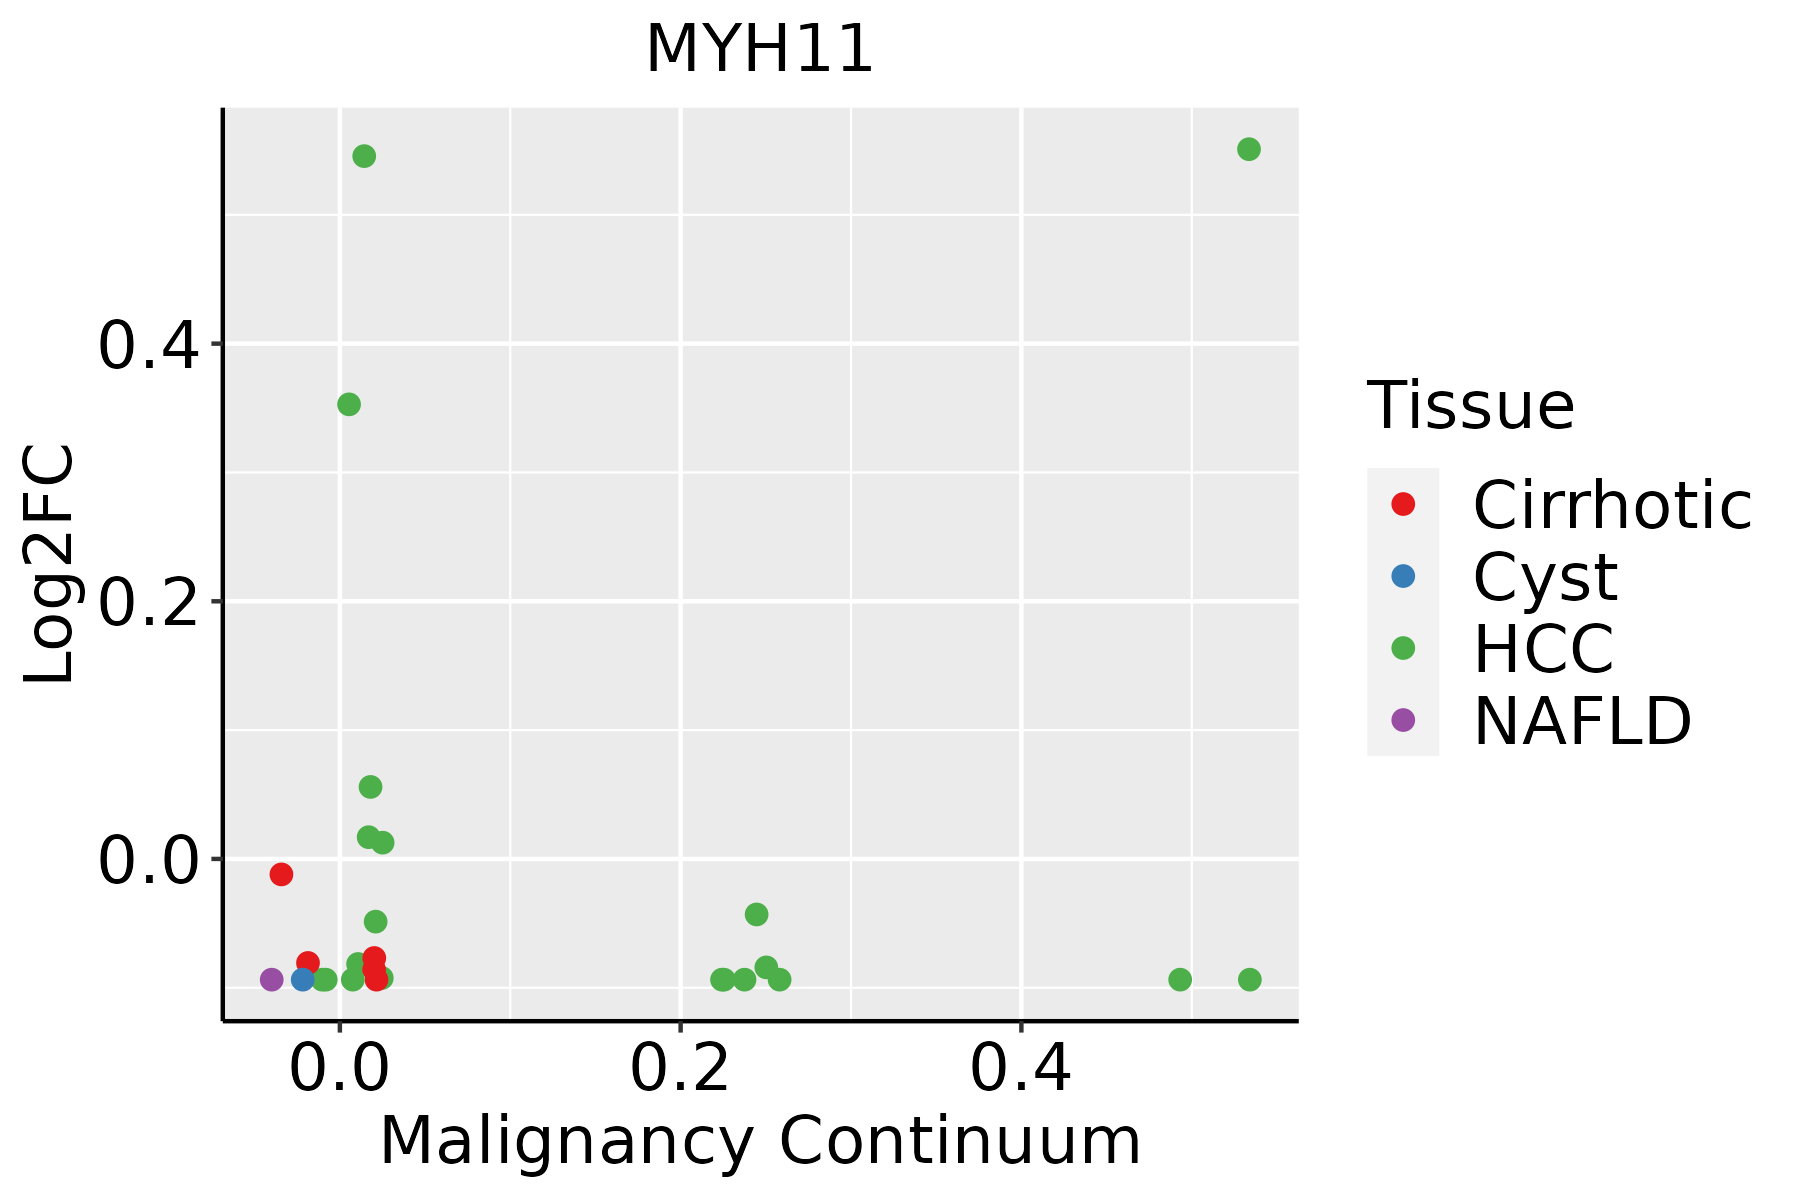 | HCC: Hepatocellular carcinoma |
| NAFLD: Non-alcoholic fatty liver disease |
| Oral Cavity |  | EOLP: Erosive Oral lichen planus |
| LP: leukoplakia |
| NEOLP: Non-erosive oral lichen planus |
| OSCC: Oral squamous cell carcinoma |
| GO ID | Tissue | Disease Stage | Description | Gene Ratio | Bg Ratio | pvalue | p.adjust | Count |
| GO:00301984 | Esophagus | ESCC | extracellular matrix organization | 171/8552 | 301/18723 | 6.08e-05 | 4.67e-04 | 171 |
| GO:00430624 | Esophagus | ESCC | extracellular structure organization | 171/8552 | 302/18723 | 7.73e-05 | 5.76e-04 | 171 |
| GO:00452294 | Esophagus | ESCC | external encapsulating structure organization | 172/8552 | 304/18723 | 7.80e-05 | 5.80e-04 | 172 |
| GO:006053716 | Esophagus | ESCC | muscle tissue development | 211/8552 | 403/18723 | 3.84e-03 | 1.56e-02 | 211 |
| GO:003103219 | Esophagus | ESCC | actomyosin structure organization | 108/8552 | 196/18723 | 4.86e-03 | 1.88e-02 | 108 |
| GO:00850292 | Esophagus | ESCC | extracellular matrix assembly | 29/8552 | 45/18723 | 8.63e-03 | 3.04e-02 | 29 |
| GO:00350512 | Esophagus | ESCC | cardiocyte differentiation | 86/8552 | 156/18723 | 1.09e-02 | 3.68e-02 | 86 |
| GO:001470615 | Esophagus | ESCC | striated muscle tissue development | 197/8552 | 384/18723 | 1.46e-02 | 4.74e-02 | 197 |
| GO:003103222 | Liver | HCC | actomyosin structure organization | 109/7958 | 196/18723 | 1.39e-04 | 1.13e-03 | 109 |
| GO:00301983 | Oral cavity | OSCC | extracellular matrix organization | 146/7305 | 301/18723 | 4.67e-04 | 2.77e-03 | 146 |
| GO:0085029 | Oral cavity | OSCC | extracellular matrix assembly | 29/7305 | 45/18723 | 4.85e-04 | 2.86e-03 | 29 |
| GO:00452293 | Oral cavity | OSCC | external encapsulating structure organization | 147/7305 | 304/18723 | 5.30e-04 | 3.08e-03 | 147 |
| GO:00430623 | Oral cavity | OSCC | extracellular structure organization | 146/7305 | 302/18723 | 5.59e-04 | 3.23e-03 | 146 |
| GO:00605378 | Oral cavity | OSCC | muscle tissue development | 185/7305 | 403/18723 | 2.60e-03 | 1.14e-02 | 185 |
| GO:00426927 | Oral cavity | OSCC | muscle cell differentiation | 175/7305 | 384/18723 | 4.79e-03 | 1.92e-02 | 175 |
| GO:00147067 | Oral cavity | OSCC | striated muscle tissue development | 174/7305 | 384/18723 | 6.45e-03 | 2.40e-02 | 174 |
| GO:003103217 | Oral cavity | OSCC | actomyosin structure organization | 93/7305 | 196/18723 | 9.63e-03 | 3.41e-02 | 93 |
| GO:0048251 | Oral cavity | OSCC | elastic fiber assembly | 8/7305 | 10/18723 | 1.03e-02 | 3.53e-02 | 8 |
| Pathway ID | Tissue | Disease Stage | Description | Gene Ratio | Bg Ratio | pvalue | p.adjust | qvalue | Count |
| hsa05130211 | Esophagus | ESCC | Pathogenic Escherichia coli infection | 142/4205 | 197/8465 | 8.21e-11 | 1.06e-09 | 5.42e-10 | 142 |
| hsa04530211 | Esophagus | ESCC | Tight junction | 105/4205 | 169/8465 | 6.73e-04 | 2.23e-03 | 1.14e-03 | 105 |
| hsa0481028 | Esophagus | ESCC | Regulation of actin cytoskeleton | 133/4205 | 229/8465 | 5.94e-03 | 1.48e-02 | 7.56e-03 | 133 |
| hsa05130310 | Esophagus | ESCC | Pathogenic Escherichia coli infection | 142/4205 | 197/8465 | 8.21e-11 | 1.06e-09 | 5.42e-10 | 142 |
| hsa04530310 | Esophagus | ESCC | Tight junction | 105/4205 | 169/8465 | 6.73e-04 | 2.23e-03 | 1.14e-03 | 105 |
| hsa04810112 | Esophagus | ESCC | Regulation of actin cytoskeleton | 133/4205 | 229/8465 | 5.94e-03 | 1.48e-02 | 7.56e-03 | 133 |
| hsa0513042 | Liver | HCC | Pathogenic Escherichia coli infection | 129/4020 | 197/8465 | 2.02e-07 | 2.50e-06 | 1.39e-06 | 129 |
| hsa0453042 | Liver | HCC | Tight junction | 110/4020 | 169/8465 | 2.45e-06 | 2.28e-05 | 1.27e-05 | 110 |
| hsa0481041 | Liver | HCC | Regulation of actin cytoskeleton | 134/4020 | 229/8465 | 4.48e-04 | 1.94e-03 | 1.08e-03 | 134 |
| hsa0513052 | Liver | HCC | Pathogenic Escherichia coli infection | 129/4020 | 197/8465 | 2.02e-07 | 2.50e-06 | 1.39e-06 | 129 |
| hsa0453052 | Liver | HCC | Tight junction | 110/4020 | 169/8465 | 2.45e-06 | 2.28e-05 | 1.27e-05 | 110 |
| hsa0481051 | Liver | HCC | Regulation of actin cytoskeleton | 134/4020 | 229/8465 | 4.48e-04 | 1.94e-03 | 1.08e-03 | 134 |
| hsa0513030 | Oral cavity | OSCC | Pathogenic Escherichia coli infection | 129/3704 | 197/8465 | 4.32e-10 | 5.17e-09 | 2.63e-09 | 129 |
| hsa0453030 | Oral cavity | OSCC | Tight junction | 102/3704 | 169/8465 | 8.68e-06 | 3.93e-05 | 2.00e-05 | 102 |
| hsa0481026 | Oral cavity | OSCC | Regulation of actin cytoskeleton | 129/3704 | 229/8465 | 7.14e-05 | 2.74e-04 | 1.40e-04 | 129 |
| hsa05130114 | Oral cavity | OSCC | Pathogenic Escherichia coli infection | 129/3704 | 197/8465 | 4.32e-10 | 5.17e-09 | 2.63e-09 | 129 |
| hsa04530114 | Oral cavity | OSCC | Tight junction | 102/3704 | 169/8465 | 8.68e-06 | 3.93e-05 | 2.00e-05 | 102 |
| hsa04810111 | Oral cavity | OSCC | Regulation of actin cytoskeleton | 129/3704 | 229/8465 | 7.14e-05 | 2.74e-04 | 1.40e-04 | 129 |
| Hugo Symbol | Variant Class | Variant Classification | dbSNP RS | HGVSc | HGVSp | HGVSp Short | SWISSPROT | BIOTYPE | SIFT | PolyPhen | Tumor Sample Barcode | Tissue | Histology | Sex | Age | Stage | Therapy Types | Drugs | Outcome |
| MYH11 | SNV | Missense_Mutation | rs778694636 | c.4119N>G | p.Ile1373Met | p.I1373M | P35749 | protein_coding | tolerated(0.15) | benign(0.02) | TCGA-A2-A0CT-01 | Breast | breast invasive carcinoma | Female | >=65 | I/II | Chemotherapy | cytoxan | SD |
| MYH11 | SNV | Missense_Mutation | | c.2971N>C | p.Glu991Gln | p.E991Q | P35749 | protein_coding | deleterious(0) | possibly_damaging(0.725) | TCGA-A2-A0T0-01 | Breast | breast invasive carcinoma | Female | <65 | I/II | Chemotherapy | taxotere | SD |
| MYH11 | SNV | Missense_Mutation | | c.1652N>A | p.Ala551Asp | p.A551D | P35749 | protein_coding | deleterious(0) | probably_damaging(1) | TCGA-A2-A0T0-01 | Breast | breast invasive carcinoma | Female | <65 | I/II | Chemotherapy | taxotere | SD |
| MYH11 | SNV | Missense_Mutation | | c.1199N>A | p.Thr400Asn | p.T400N | P35749 | protein_coding | deleterious(0.02) | possibly_damaging(0.849) | TCGA-A8-A08L-01 | Breast | breast invasive carcinoma | Female | >=65 | III/IV | Unknown | Unknown | SD |
| MYH11 | SNV | Missense_Mutation | | c.3367N>A | p.Leu1123Met | p.L1123M | P35749 | protein_coding | tolerated(0.06) | possibly_damaging(0.513) | TCGA-A8-A09M-01 | Breast | breast invasive carcinoma | Female | >=65 | III/IV | Chemotherapy | paclitaxel | CR |
| MYH11 | SNV | Missense_Mutation | | c.1403N>A | p.Ala468Asp | p.A468D | P35749 | protein_coding | deleterious(0) | probably_damaging(0.986) | TCGA-BH-A0HY-01 | Breast | breast invasive carcinoma | Female | <65 | I/II | Hormone Therapy | taxotere | CR |
| MYH11 | SNV | Missense_Mutation | rs771297865 | c.3146G>A | p.Arg1049Gln | p.R1049Q | P35749 | protein_coding | deleterious(0.05) | possibly_damaging(0.83) | TCGA-BH-A18G-01 | Breast | breast invasive carcinoma | Female | >=65 | I/II | Unknown | Unknown | SD |
| MYH11 | SNV | Missense_Mutation | | c.5024N>A | p.Arg1675Lys | p.R1675K | P35749 | protein_coding | tolerated(0.27) | possibly_damaging(0.803) | TCGA-D8-A1J8-01 | Breast | breast invasive carcinoma | Female | >=65 | I/II | Hormone Therapy | nolvadex | SD |
| MYH11 | SNV | Missense_Mutation | | c.1411G>A | p.Glu471Lys | p.E471K | P35749 | protein_coding | deleterious(0) | probably_damaging(0.999) | TCGA-D8-A1JA-01 | Breast | breast invasive carcinoma | Female | <65 | III/IV | Chemotherapy | adriamycin | PD |
| MYH11 | SNV | Missense_Mutation | | c.2417N>A | p.Gly806Asp | p.G806D | P35749 | protein_coding | deleterious(0) | probably_damaging(1) | TCGA-D8-A1JJ-01 | Breast | breast invasive carcinoma | Female | <65 | I/II | Chemotherapy | doxorubicine | SD |


