| Tissue | Expression Dynamics | Abbreviation |
| Endometrium |  | AEH: Atypical endometrial hyperplasia |
| EEC: Endometrioid Cancer |
| Esophagus |  | ESCC: Esophageal squamous cell carcinoma |
| HGIN: High-grade intraepithelial neoplasias |
| LGIN: Low-grade intraepithelial neoplasias |
| Liver | 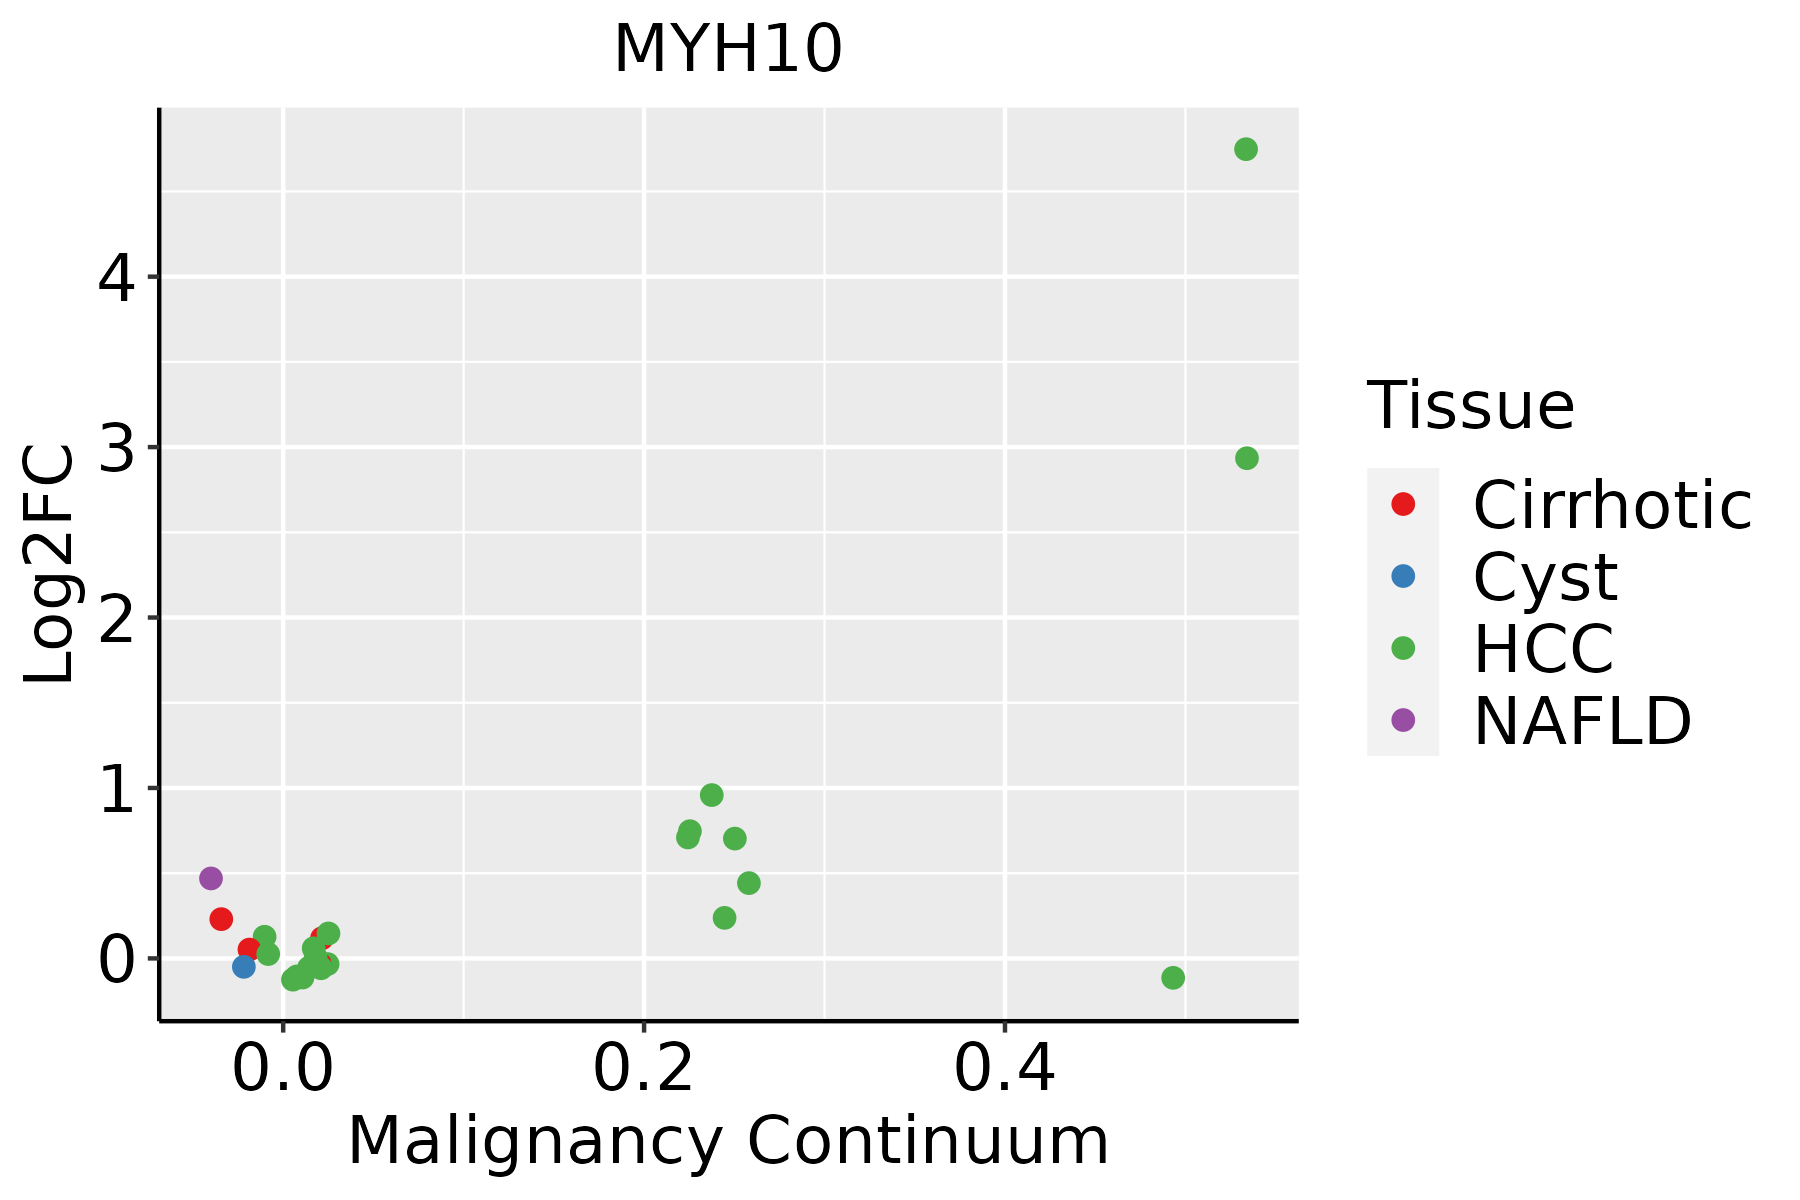 | HCC: Hepatocellular carcinoma |
| NAFLD: Non-alcoholic fatty liver disease |
| Oral Cavity | 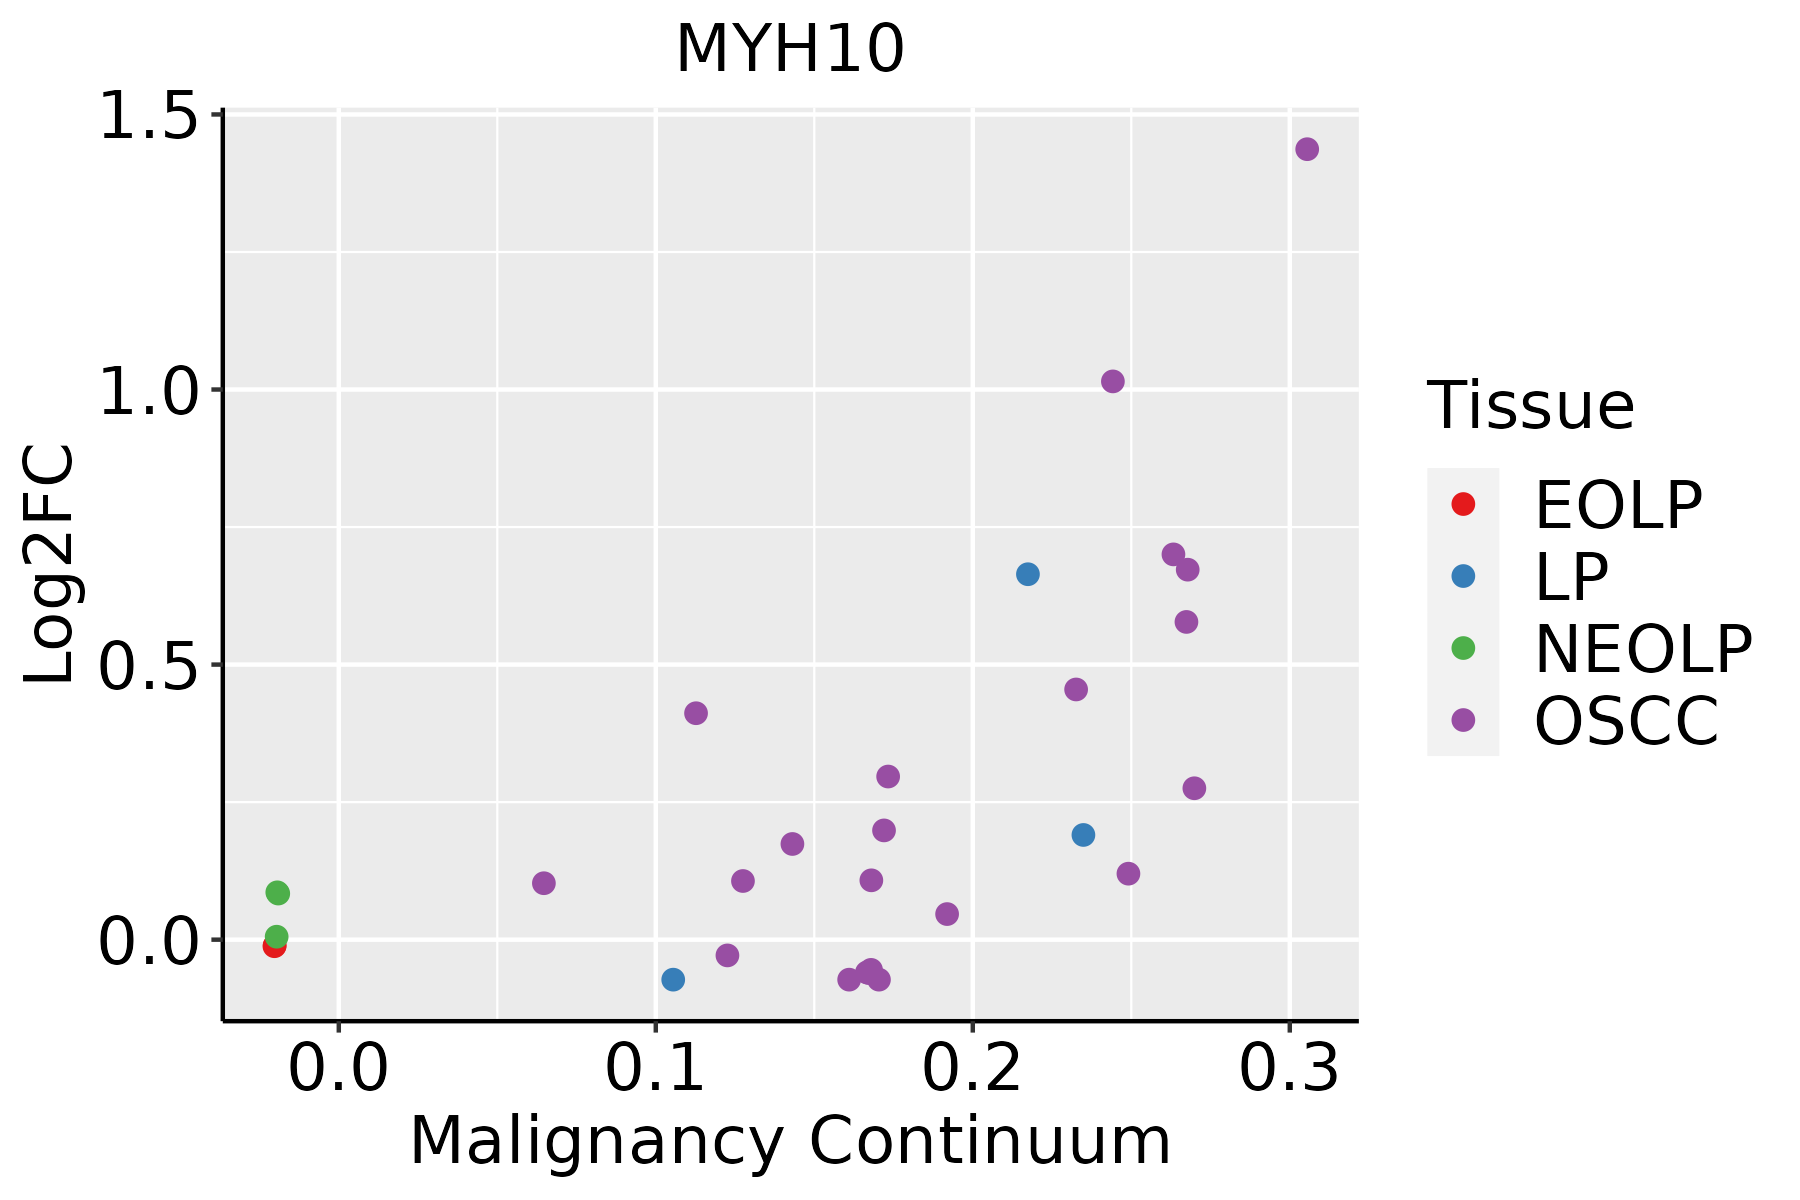 | EOLP: Erosive Oral lichen planus |
| LP: leukoplakia |
| NEOLP: Non-erosive oral lichen planus |
| OSCC: Oral squamous cell carcinoma |
| Prostate | 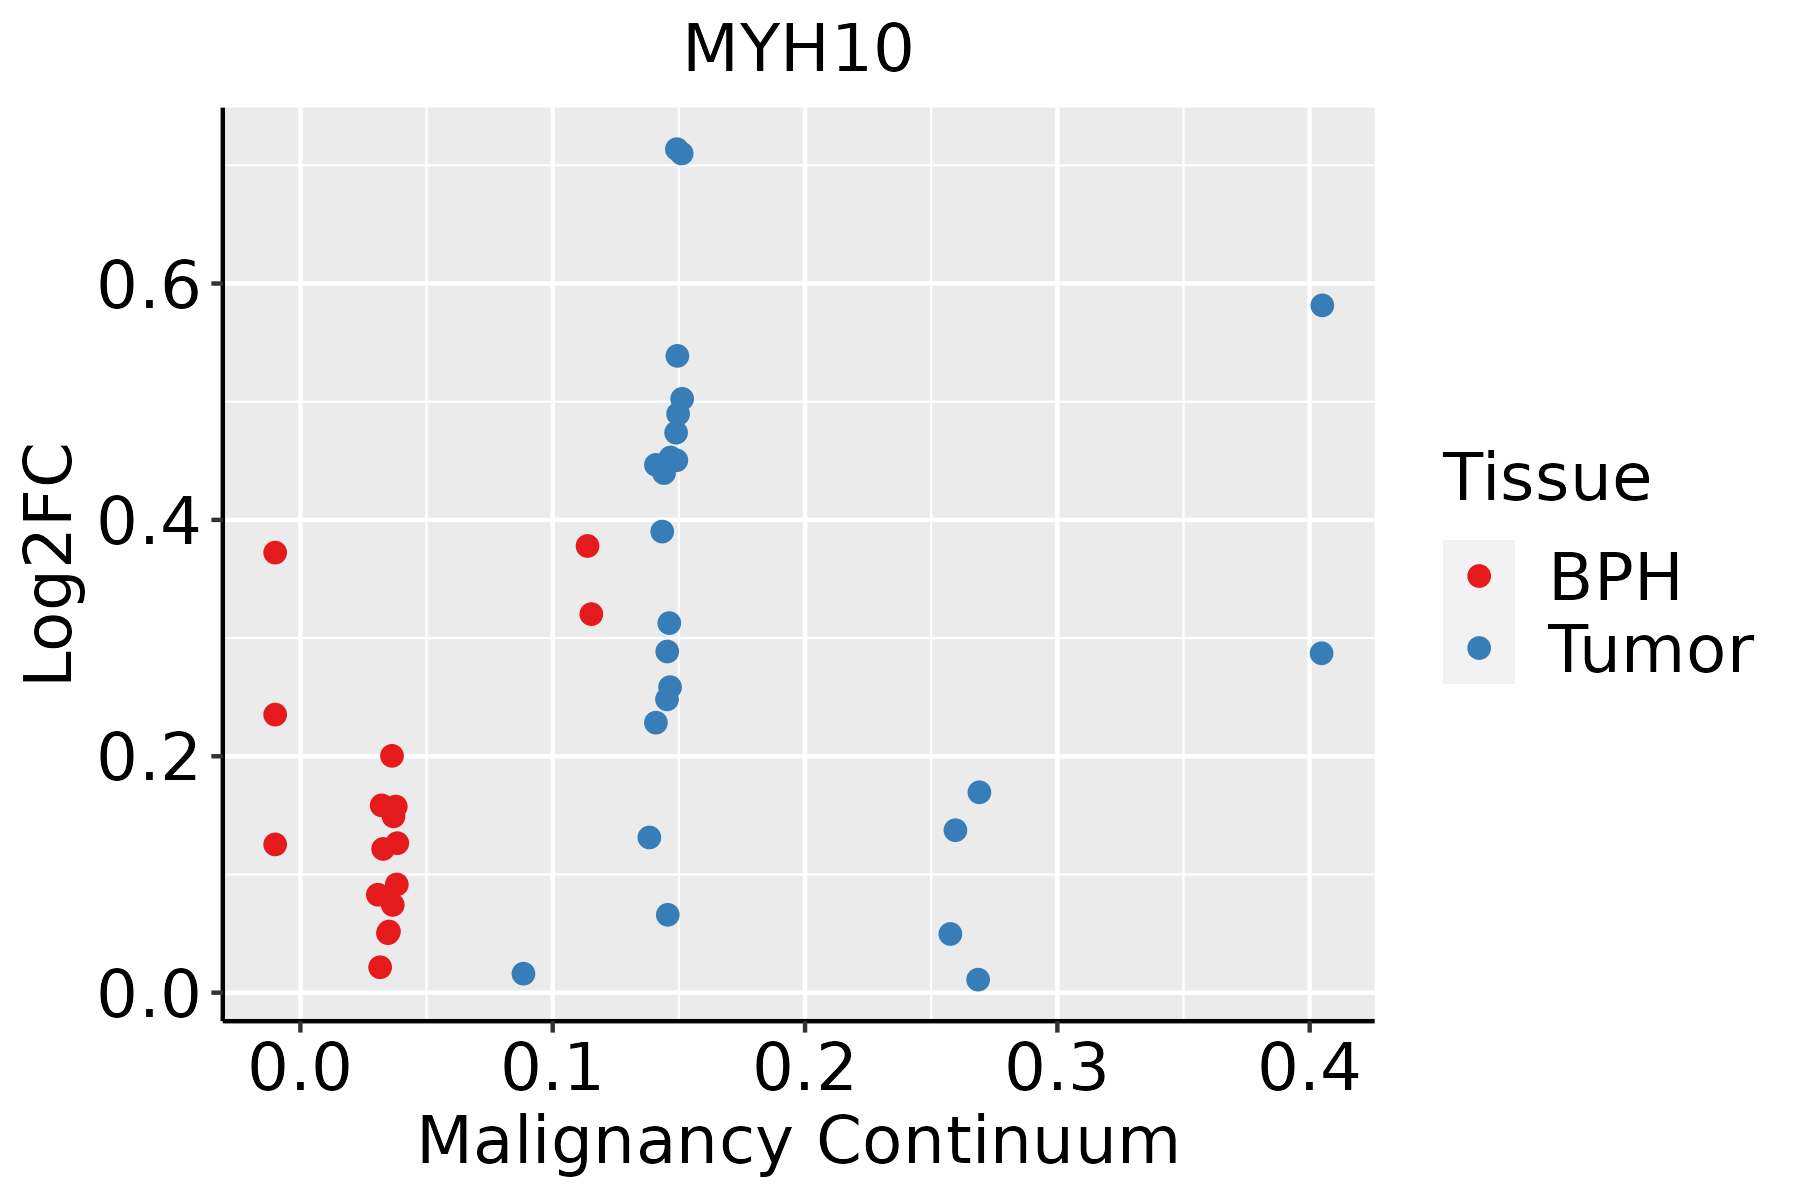 | BPH: Benign Prostatic Hyperplasia |
| Skin | 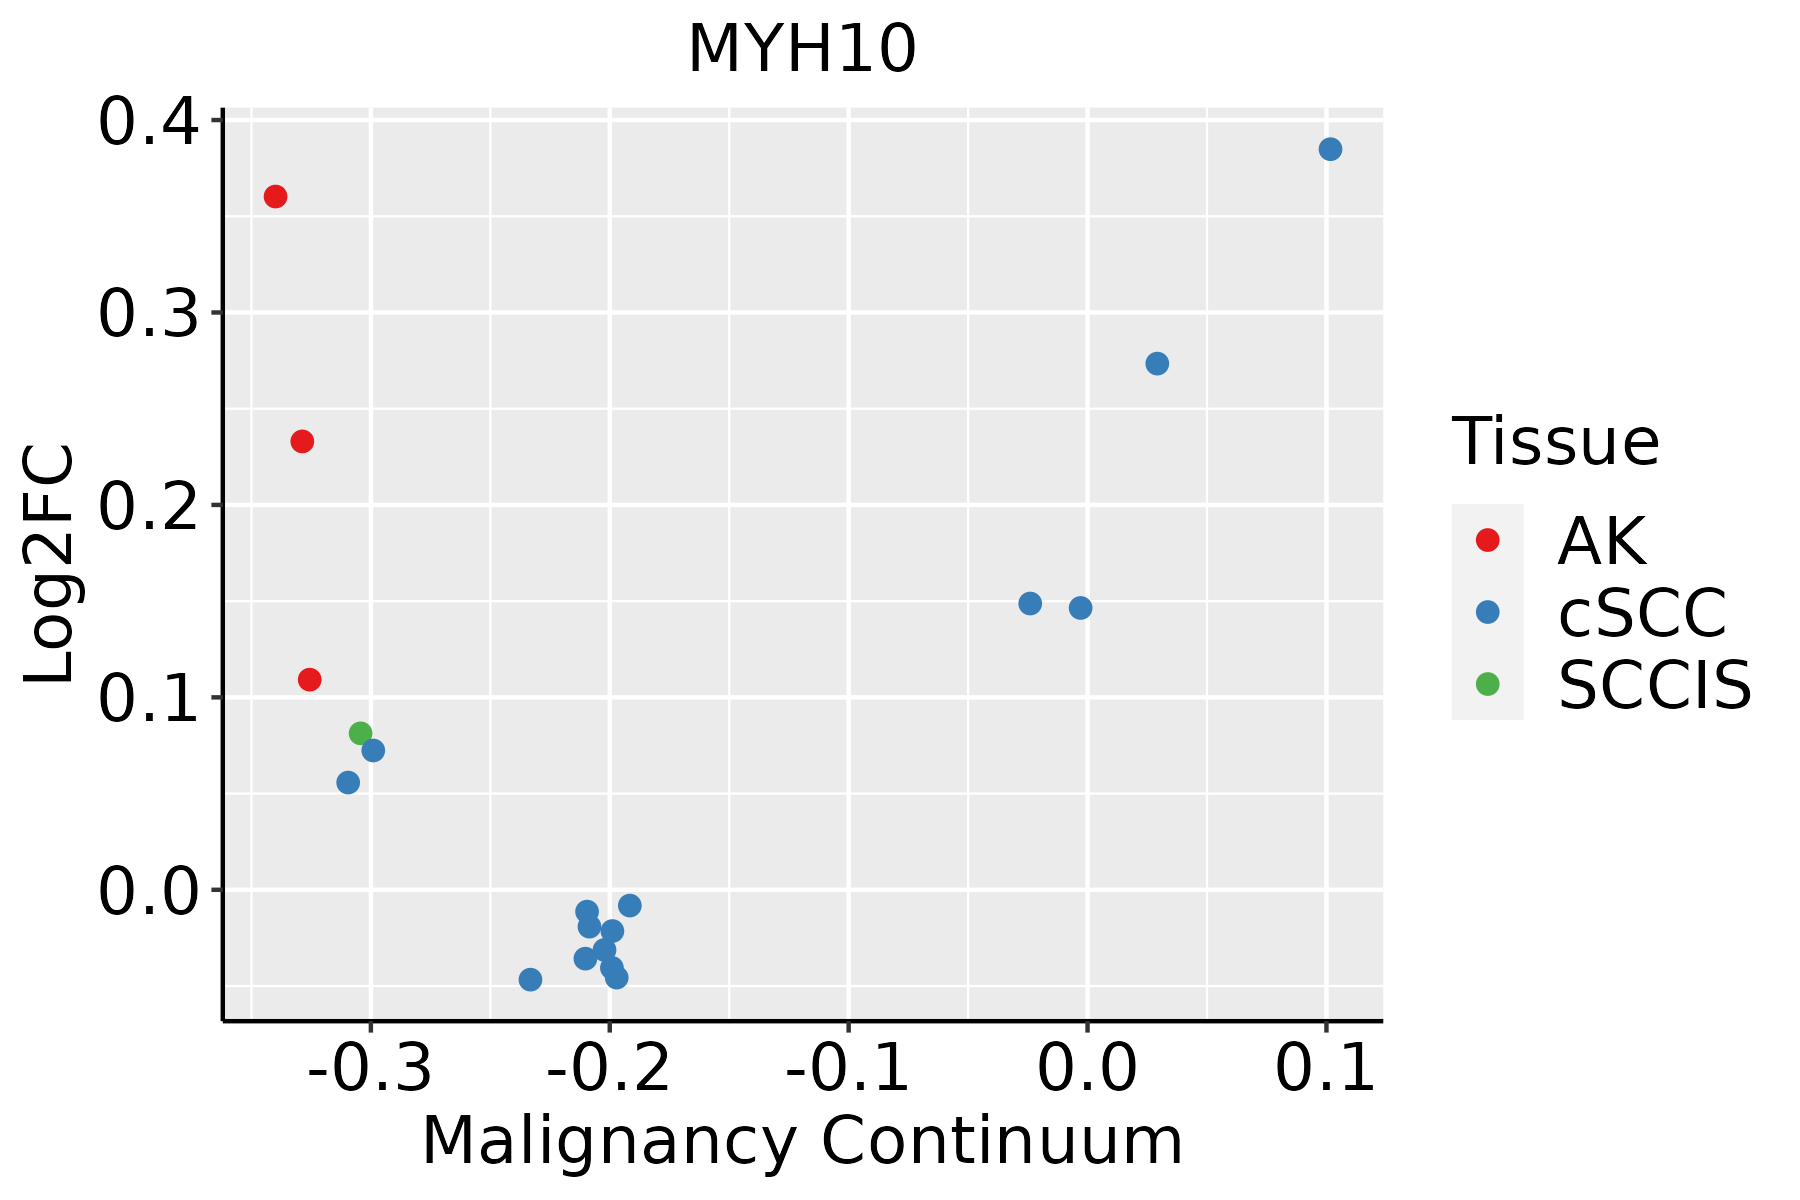 | AK: Actinic keratosis |
| cSCC: Cutaneous squamous cell carcinoma |
| SCCIS:squamous cell carcinoma in situ |
| Thyroid | 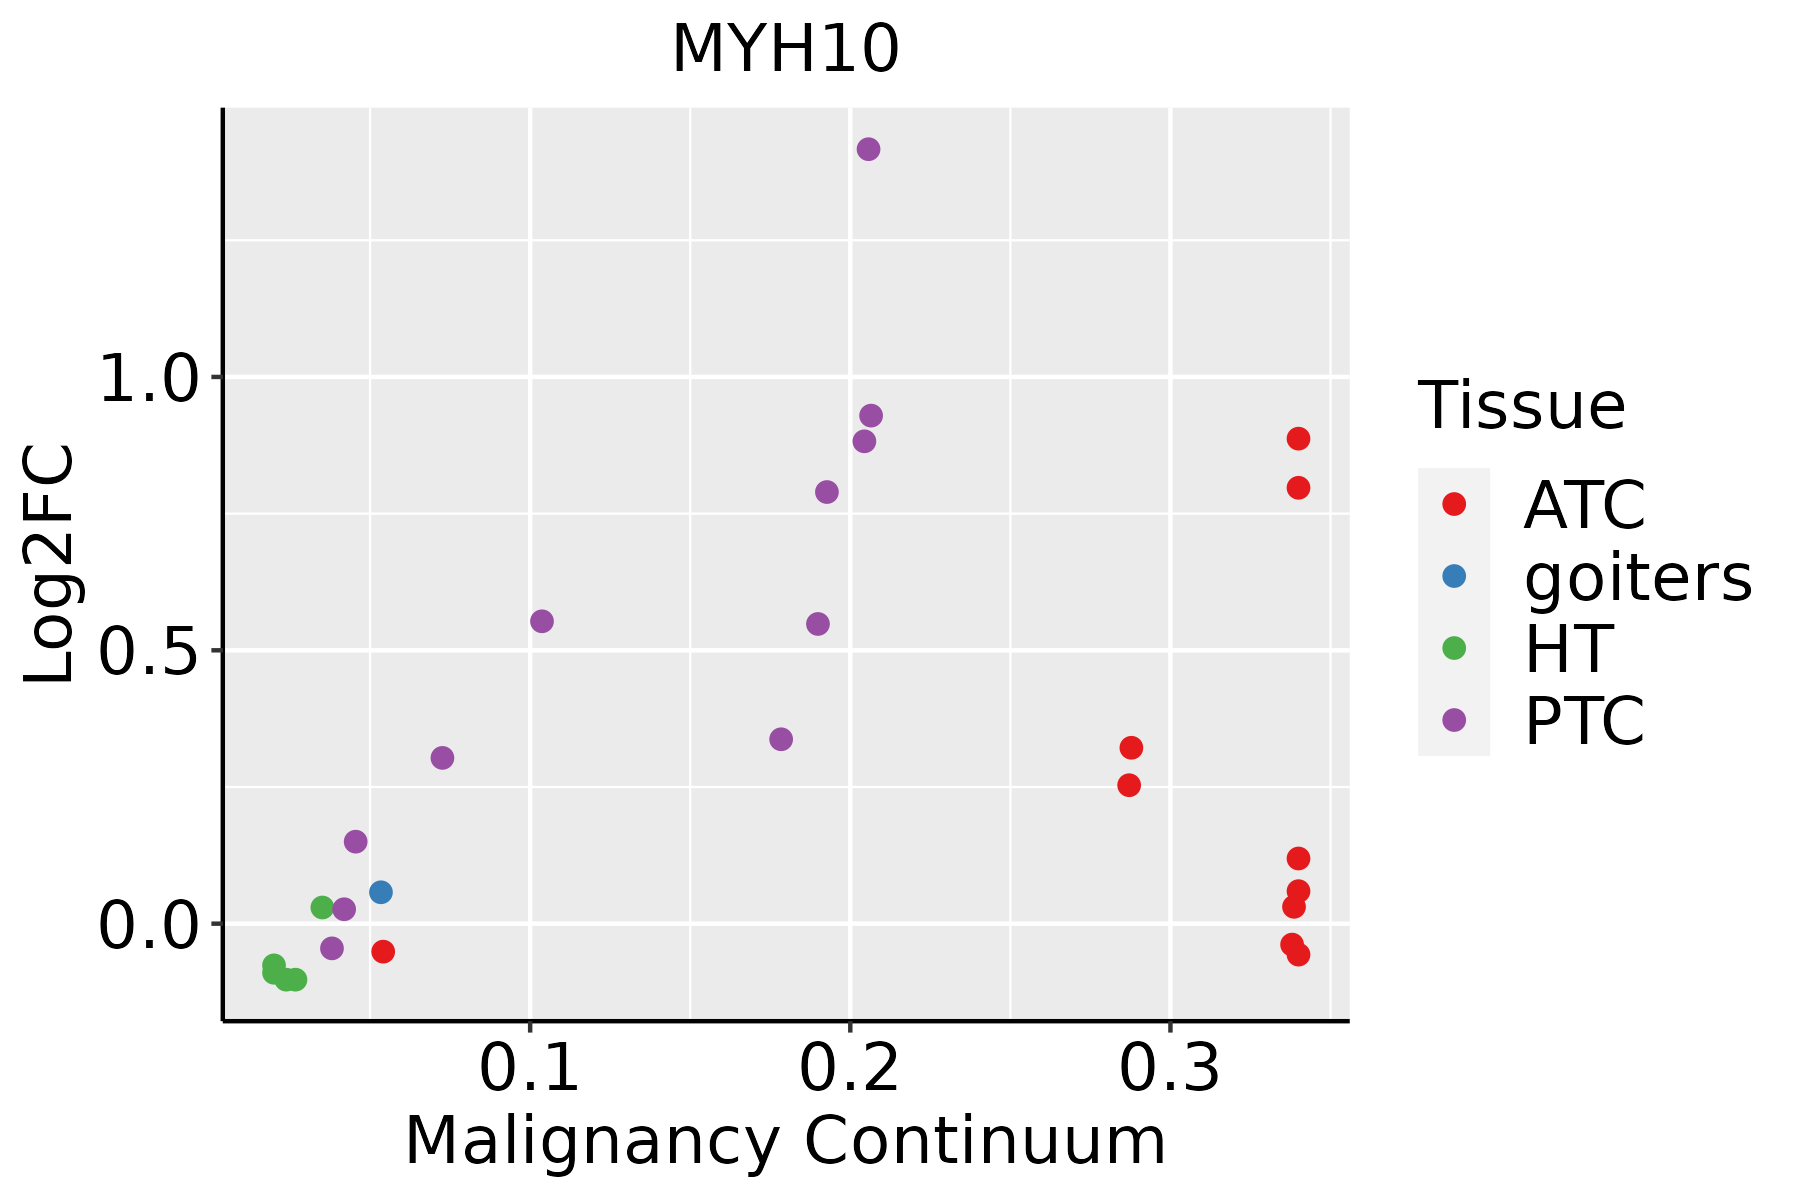 | ATC: Anaplastic thyroid cancer |
| HT: Hashimoto's thyroiditis |
| PTC: Papillary thyroid cancer |
| GO ID | Tissue | Disease Stage | Description | Gene Ratio | Bg Ratio | pvalue | p.adjust | Count |
| GO:002260415 | Endometrium | AEH | regulation of cell morphogenesis | 79/2100 | 309/18723 | 1.04e-12 | 2.24e-10 | 79 |
| GO:190495115 | Endometrium | AEH | positive regulation of establishment of protein localization | 74/2100 | 319/18723 | 7.05e-10 | 6.51e-08 | 74 |
| GO:005122215 | Endometrium | AEH | positive regulation of protein transport | 66/2100 | 303/18723 | 7.79e-08 | 3.99e-06 | 66 |
| GO:003103210 | Endometrium | AEH | actomyosin structure organization | 46/2100 | 196/18723 | 8.00e-07 | 2.91e-05 | 46 |
| GO:00009108 | Endometrium | AEH | cytokinesis | 40/2100 | 173/18723 | 6.01e-06 | 1.49e-04 | 40 |
| GO:00300488 | Endometrium | AEH | actin filament-based movement | 31/2100 | 127/18723 | 2.10e-05 | 4.14e-04 | 31 |
| GO:00083609 | Endometrium | AEH | regulation of cell shape | 34/2100 | 154/18723 | 7.85e-05 | 1.18e-03 | 34 |
| GO:00616403 | Endometrium | AEH | cytoskeleton-dependent cytokinesis | 24/2100 | 100/18723 | 2.27e-04 | 2.75e-03 | 24 |
| GO:00507087 | Endometrium | AEH | regulation of protein secretion | 49/2100 | 268/18723 | 3.83e-04 | 4.12e-03 | 49 |
| GO:00507149 | Endometrium | AEH | positive regulation of protein secretion | 28/2100 | 137/18723 | 1.17e-03 | 1.01e-02 | 28 |
| GO:00002813 | Endometrium | AEH | mitotic cytokinesis | 17/2100 | 71/18723 | 1.82e-03 | 1.45e-02 | 17 |
| GO:00508086 | Endometrium | AEH | synapse organization | 67/2100 | 426/18723 | 2.67e-03 | 1.94e-02 | 67 |
| GO:00716927 | Endometrium | AEH | protein localization to extracellular region | 58/2100 | 368/18723 | 4.72e-03 | 3.00e-02 | 58 |
| GO:00093068 | Endometrium | AEH | protein secretion | 56/2100 | 359/18723 | 6.71e-03 | 3.94e-02 | 56 |
| GO:00355928 | Endometrium | AEH | establishment of protein localization to extracellular region | 56/2100 | 360/18723 | 7.10e-03 | 4.09e-02 | 56 |
| GO:002260416 | Endometrium | EEC | regulation of cell morphogenesis | 78/2168 | 309/18723 | 1.45e-11 | 2.28e-09 | 78 |
| GO:190495116 | Endometrium | EEC | positive regulation of establishment of protein localization | 74/2168 | 319/18723 | 2.90e-09 | 2.10e-07 | 74 |
| GO:005122216 | Endometrium | EEC | positive regulation of protein transport | 66/2168 | 303/18723 | 2.55e-07 | 1.09e-05 | 66 |
| GO:003103214 | Endometrium | EEC | actomyosin structure organization | 46/2168 | 196/18723 | 1.94e-06 | 5.80e-05 | 46 |
| GO:000091013 | Endometrium | EEC | cytokinesis | 40/2168 | 173/18723 | 1.29e-05 | 2.60e-04 | 40 |
| Pathway ID | Tissue | Disease Stage | Description | Gene Ratio | Bg Ratio | pvalue | p.adjust | qvalue | Count |
| hsa0453026 | Endometrium | AEH | Tight junction | 54/1197 | 169/8465 | 1.99e-09 | 3.80e-08 | 2.78e-08 | 54 |
| hsa0513026 | Endometrium | AEH | Pathogenic Escherichia coli infection | 50/1197 | 197/8465 | 1.72e-05 | 1.86e-04 | 1.36e-04 | 50 |
| hsa0481018 | Endometrium | AEH | Regulation of actin cytoskeleton | 50/1197 | 229/8465 | 9.08e-04 | 5.78e-03 | 4.23e-03 | 50 |
| hsa048144 | Endometrium | AEH | Motor proteins | 42/1197 | 193/8465 | 2.41e-03 | 1.42e-02 | 1.04e-02 | 42 |
| hsa04530112 | Endometrium | AEH | Tight junction | 54/1197 | 169/8465 | 1.99e-09 | 3.80e-08 | 2.78e-08 | 54 |
| hsa05130112 | Endometrium | AEH | Pathogenic Escherichia coli infection | 50/1197 | 197/8465 | 1.72e-05 | 1.86e-04 | 1.36e-04 | 50 |
| hsa0481019 | Endometrium | AEH | Regulation of actin cytoskeleton | 50/1197 | 229/8465 | 9.08e-04 | 5.78e-03 | 4.23e-03 | 50 |
| hsa0481411 | Endometrium | AEH | Motor proteins | 42/1197 | 193/8465 | 2.41e-03 | 1.42e-02 | 1.04e-02 | 42 |
| hsa0453027 | Endometrium | EEC | Tight junction | 54/1237 | 169/8465 | 6.56e-09 | 1.27e-07 | 9.46e-08 | 54 |
| hsa0513027 | Endometrium | EEC | Pathogenic Escherichia coli infection | 51/1237 | 197/8465 | 1.98e-05 | 2.28e-04 | 1.70e-04 | 51 |
| hsa0481024 | Endometrium | EEC | Regulation of actin cytoskeleton | 49/1237 | 229/8465 | 3.20e-03 | 1.78e-02 | 1.33e-02 | 49 |
| hsa048142 | Endometrium | EEC | Motor proteins | 42/1237 | 193/8465 | 4.43e-03 | 2.39e-02 | 1.78e-02 | 42 |
| hsa0453036 | Endometrium | EEC | Tight junction | 54/1237 | 169/8465 | 6.56e-09 | 1.27e-07 | 9.46e-08 | 54 |
| hsa0513036 | Endometrium | EEC | Pathogenic Escherichia coli infection | 51/1237 | 197/8465 | 1.98e-05 | 2.28e-04 | 1.70e-04 | 51 |
| hsa0481034 | Endometrium | EEC | Regulation of actin cytoskeleton | 49/1237 | 229/8465 | 3.20e-03 | 1.78e-02 | 1.33e-02 | 49 |
| hsa048143 | Endometrium | EEC | Motor proteins | 42/1237 | 193/8465 | 4.43e-03 | 2.39e-02 | 1.78e-02 | 42 |
| hsa05130211 | Esophagus | ESCC | Pathogenic Escherichia coli infection | 142/4205 | 197/8465 | 8.21e-11 | 1.06e-09 | 5.42e-10 | 142 |
| hsa04530211 | Esophagus | ESCC | Tight junction | 105/4205 | 169/8465 | 6.73e-04 | 2.23e-03 | 1.14e-03 | 105 |
| hsa0481028 | Esophagus | ESCC | Regulation of actin cytoskeleton | 133/4205 | 229/8465 | 5.94e-03 | 1.48e-02 | 7.56e-03 | 133 |
| hsa05130310 | Esophagus | ESCC | Pathogenic Escherichia coli infection | 142/4205 | 197/8465 | 8.21e-11 | 1.06e-09 | 5.42e-10 | 142 |
| Hugo Symbol | Variant Class | Variant Classification | dbSNP RS | HGVSc | HGVSp | HGVSp Short | SWISSPROT | BIOTYPE | SIFT | PolyPhen | Tumor Sample Barcode | Tissue | Histology | Sex | Age | Stage | Therapy Types | Drugs | Outcome |
| MYH10 | SNV | Missense_Mutation | | c.5258C>T | p.Ser1753Phe | p.S1753F | P35580 | protein_coding | deleterious(0.01) | benign(0.067) | TCGA-A2-A0CT-01 | Breast | breast invasive carcinoma | Female | >=65 | I/II | Chemotherapy | cytoxan | SD |
| MYH10 | SNV | Missense_Mutation | rs778892637 | c.1999G>A | p.Glu667Lys | p.E667K | P35580 | protein_coding | deleterious(0.03) | possibly_damaging(0.757) | TCGA-A2-A0CT-01 | Breast | breast invasive carcinoma | Female | >=65 | I/II | Chemotherapy | cytoxan | SD |
| MYH10 | SNV | Missense_Mutation | | c.2581C>T | p.Arg861Trp | p.R861W | P35580 | protein_coding | deleterious(0) | probably_damaging(0.999) | TCGA-A8-A09Q-01 | Breast | breast invasive carcinoma | Female | >=65 | III/IV | Hormone Therapy | anastrozole | SD |
| MYH10 | SNV | Missense_Mutation | | c.1750G>T | p.Asp584Tyr | p.D584Y | P35580 | protein_coding | deleterious(0) | possibly_damaging(0.845) | TCGA-A8-A0AB-01 | Breast | breast invasive carcinoma | Female | <65 | I/II | Chemotherapy | 5-fluorouracil | CR |
| MYH10 | SNV | Missense_Mutation | | c.4484N>G | p.Ser1495Cys | p.S1495C | P35580 | protein_coding | deleterious(0.02) | probably_damaging(0.981) | TCGA-AC-A23H-01 | Breast | breast invasive carcinoma | Female | >=65 | I/II | Unknown | Unknown | PD |
| MYH10 | SNV | Missense_Mutation | novel | c.4007N>C | p.Lys1336Thr | p.K1336T | P35580 | protein_coding | tolerated(0.05) | probably_damaging(0.962) | TCGA-AN-A046-01 | Breast | breast invasive carcinoma | Female | >=65 | I/II | Unknown | Unknown | SD |
| MYH10 | SNV | Missense_Mutation | | c.4396N>A | p.Asp1466Asn | p.D1466N | P35580 | protein_coding | tolerated(0.09) | benign(0.105) | TCGA-AN-A0XN-01 | Breast | breast invasive carcinoma | Female | >=65 | III/IV | Unknown | Unknown | SD |
| MYH10 | SNV | Missense_Mutation | | c.615A>T | p.Arg205Ser | p.R205S | P35580 | protein_coding | tolerated(0.2) | benign(0.015) | TCGA-AR-A24Q-01 | Breast | breast invasive carcinoma | Female | <65 | I/II | Chemotherapy | doxorubicin | SD |
| MYH10 | SNV | Missense_Mutation | | c.614G>A | p.Arg205Lys | p.R205K | P35580 | protein_coding | tolerated(1) | benign(0.001) | TCGA-AR-A24Q-01 | Breast | breast invasive carcinoma | Female | <65 | I/II | Chemotherapy | doxorubicin | SD |
| MYH10 | SNV | Missense_Mutation | rs776217752 | c.4927N>T | p.Arg1643Trp | p.R1643W | P35580 | protein_coding | deleterious(0) | probably_damaging(0.998) | TCGA-AR-A256-01 | Breast | breast invasive carcinoma | Female | <65 | I/II | Chemotherapy | doxorubicin | PD |


