
|
|||||
|
 | |
| |
| |
| |
| |
| |
|
Gene: MYEOV |
Gene summary for MYEOV |
| Gene information | Species | Human | Gene symbol | MYEOV | Gene ID | 26579 |
| Gene name | myeloma overexpressed | |
| Gene Alias | OCIM | |
| Cytomap | 11q13.3 | |
| Gene Type | protein-coding | GO ID | GO:0003674 | UniProtAcc | A0A024R5F1 |
Top |
Malignant transformation analysis |
| Identification of the aberrant gene expression in precancerous and cancerous lesions by comparing the gene expression of stem-like cells in diseased tissues with normal stem cells |
| Entrez ID | Symbol | Replicates | Species | Organ | Tissue | Adj P-value | Log2FC | Malignancy |
| 26579 | MYEOV | LZE8T | Human | Esophagus | ESCC | 1.06e-18 | 1.29e+00 | 0.067 |
| 26579 | MYEOV | LZE20T | Human | Esophagus | ESCC | 1.97e-04 | 3.80e-01 | 0.0662 |
| 26579 | MYEOV | LZE24T | Human | Esophagus | ESCC | 1.09e-06 | 3.91e-01 | 0.0596 |
| 26579 | MYEOV | LZE21T | Human | Esophagus | ESCC | 6.52e-03 | 4.49e-01 | 0.0655 |
| 26579 | MYEOV | P1T-E | Human | Esophagus | ESCC | 1.05e-09 | 1.12e+00 | 0.0875 |
| 26579 | MYEOV | P5T-E | Human | Esophagus | ESCC | 3.50e-02 | 9.36e-02 | 0.1327 |
| 26579 | MYEOV | P8T-E | Human | Esophagus | ESCC | 6.56e-15 | 4.66e-01 | 0.0889 |
| 26579 | MYEOV | P10T-E | Human | Esophagus | ESCC | 8.28e-115 | 1.71e+00 | 0.116 |
| 26579 | MYEOV | P17T-E | Human | Esophagus | ESCC | 2.60e-06 | 4.29e-01 | 0.1278 |
| 26579 | MYEOV | P23T-E | Human | Esophagus | ESCC | 2.27e-24 | 2.06e+00 | 0.108 |
| 26579 | MYEOV | P24T-E | Human | Esophagus | ESCC | 4.44e-08 | 2.48e-01 | 0.1287 |
| 26579 | MYEOV | P32T-E | Human | Esophagus | ESCC | 4.40e-09 | 3.48e-01 | 0.1666 |
| 26579 | MYEOV | P36T-E | Human | Esophagus | ESCC | 3.61e-22 | 1.37e+00 | 0.1187 |
| 26579 | MYEOV | P37T-E | Human | Esophagus | ESCC | 1.84e-22 | 5.14e-01 | 0.1371 |
| 26579 | MYEOV | P38T-E | Human | Esophagus | ESCC | 4.17e-18 | 5.68e-01 | 0.127 |
| 26579 | MYEOV | P39T-E | Human | Esophagus | ESCC | 4.41e-07 | 4.04e-01 | 0.0894 |
| 26579 | MYEOV | P47T-E | Human | Esophagus | ESCC | 3.50e-02 | 1.90e-01 | 0.1067 |
| 26579 | MYEOV | P52T-E | Human | Esophagus | ESCC | 2.08e-40 | 1.07e+00 | 0.1555 |
| 26579 | MYEOV | P54T-E | Human | Esophagus | ESCC | 1.34e-09 | 5.05e-01 | 0.0975 |
| 26579 | MYEOV | P56T-E | Human | Esophagus | ESCC | 3.37e-32 | 2.81e+00 | 0.1613 |
| Page: 1 2 3 |
| Tissue | Expression Dynamics | Abbreviation |
| Esophagus | 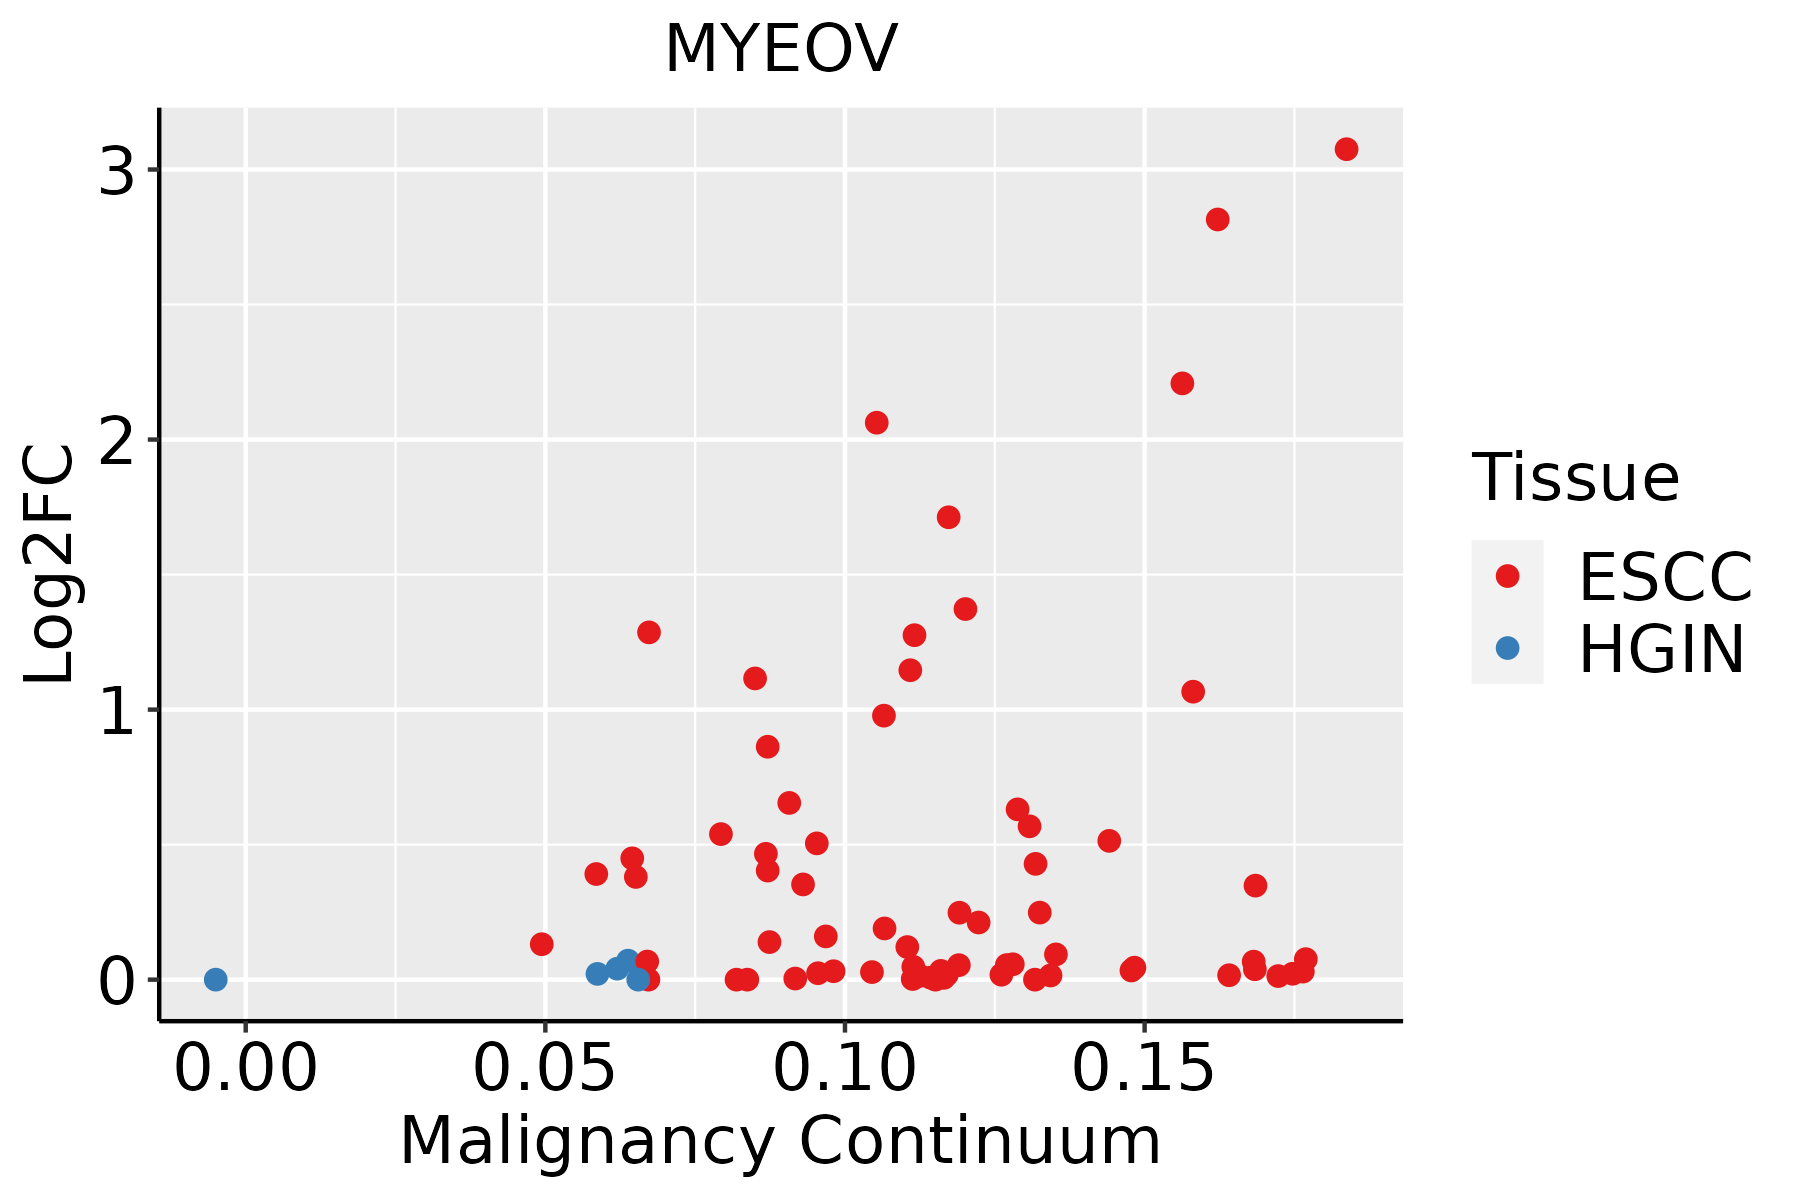 | ESCC: Esophageal squamous cell carcinoma |
| HGIN: High-grade intraepithelial neoplasias | ||
| LGIN: Low-grade intraepithelial neoplasias | ||
| Liver | 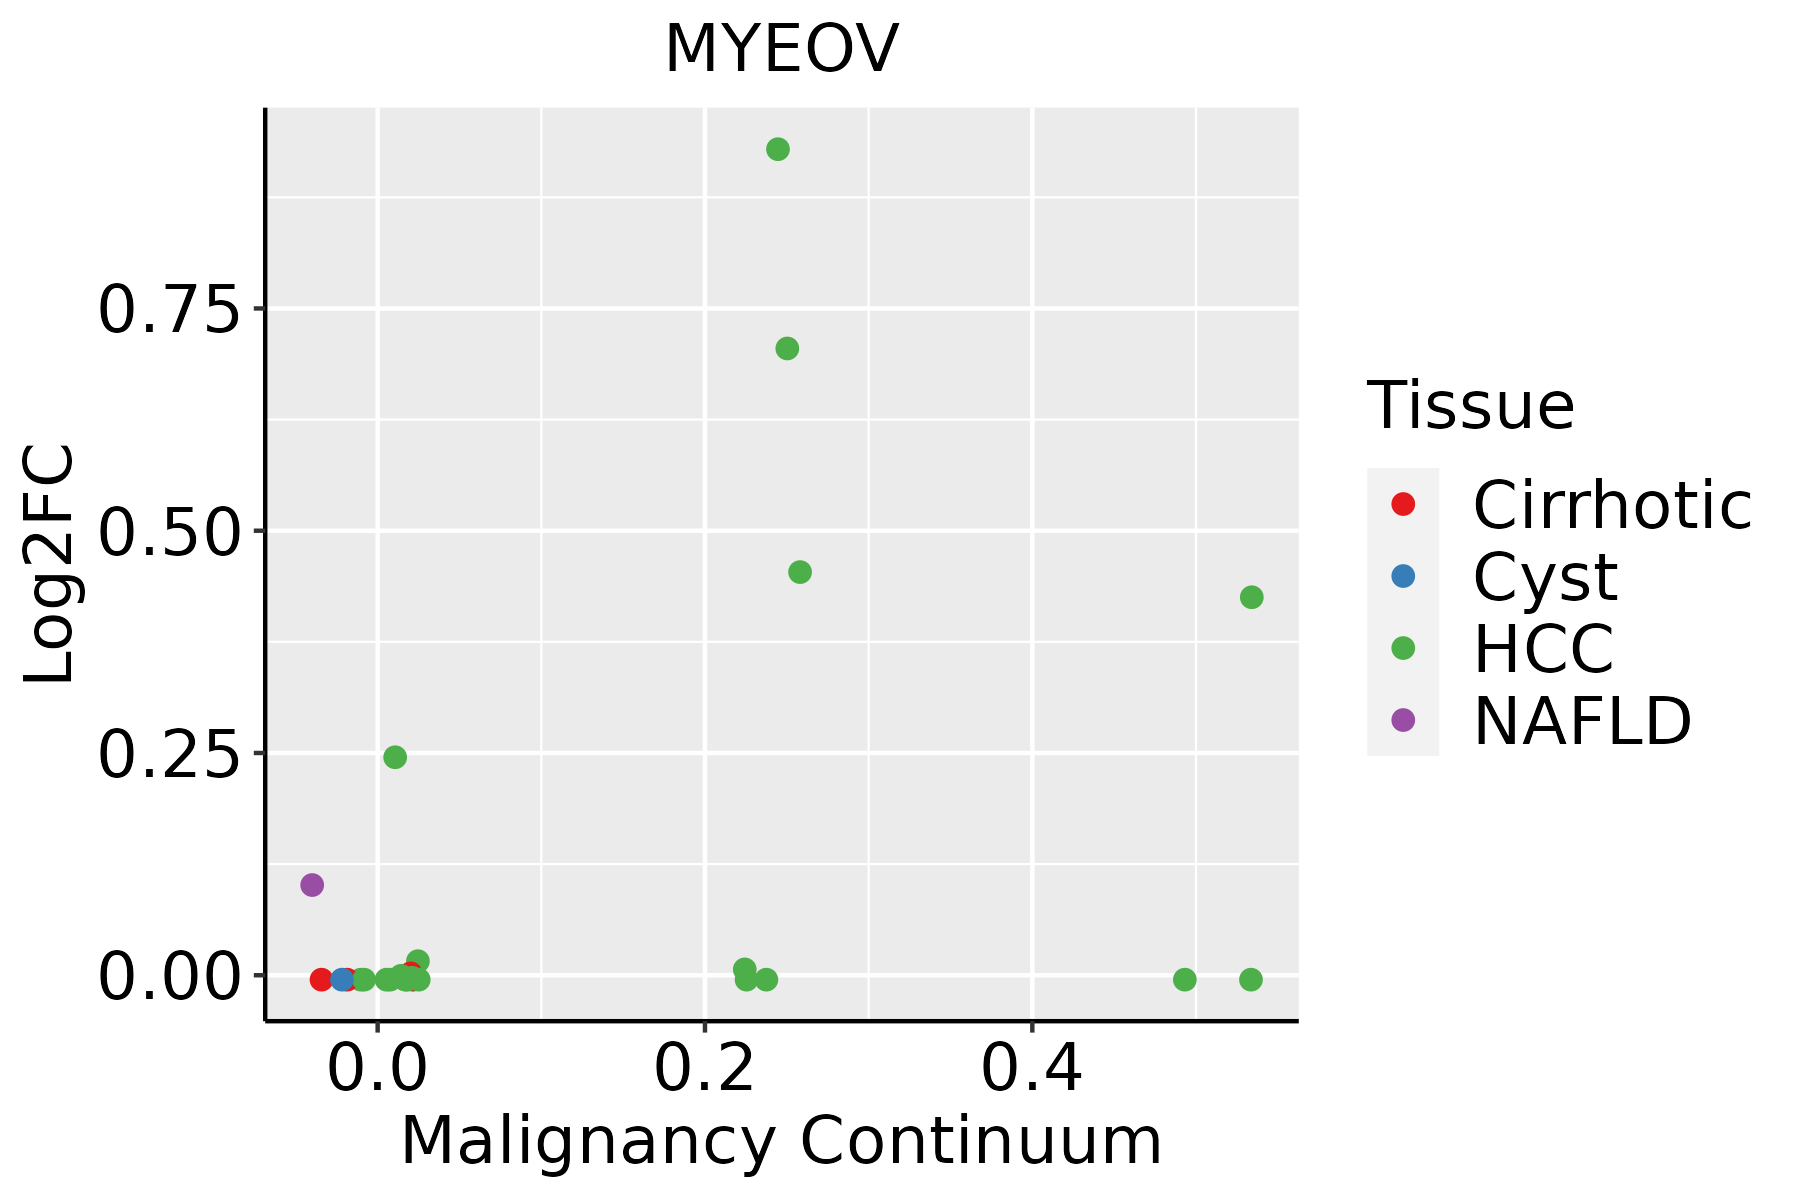 | HCC: Hepatocellular carcinoma |
| NAFLD: Non-alcoholic fatty liver disease | ||
| Oral Cavity | 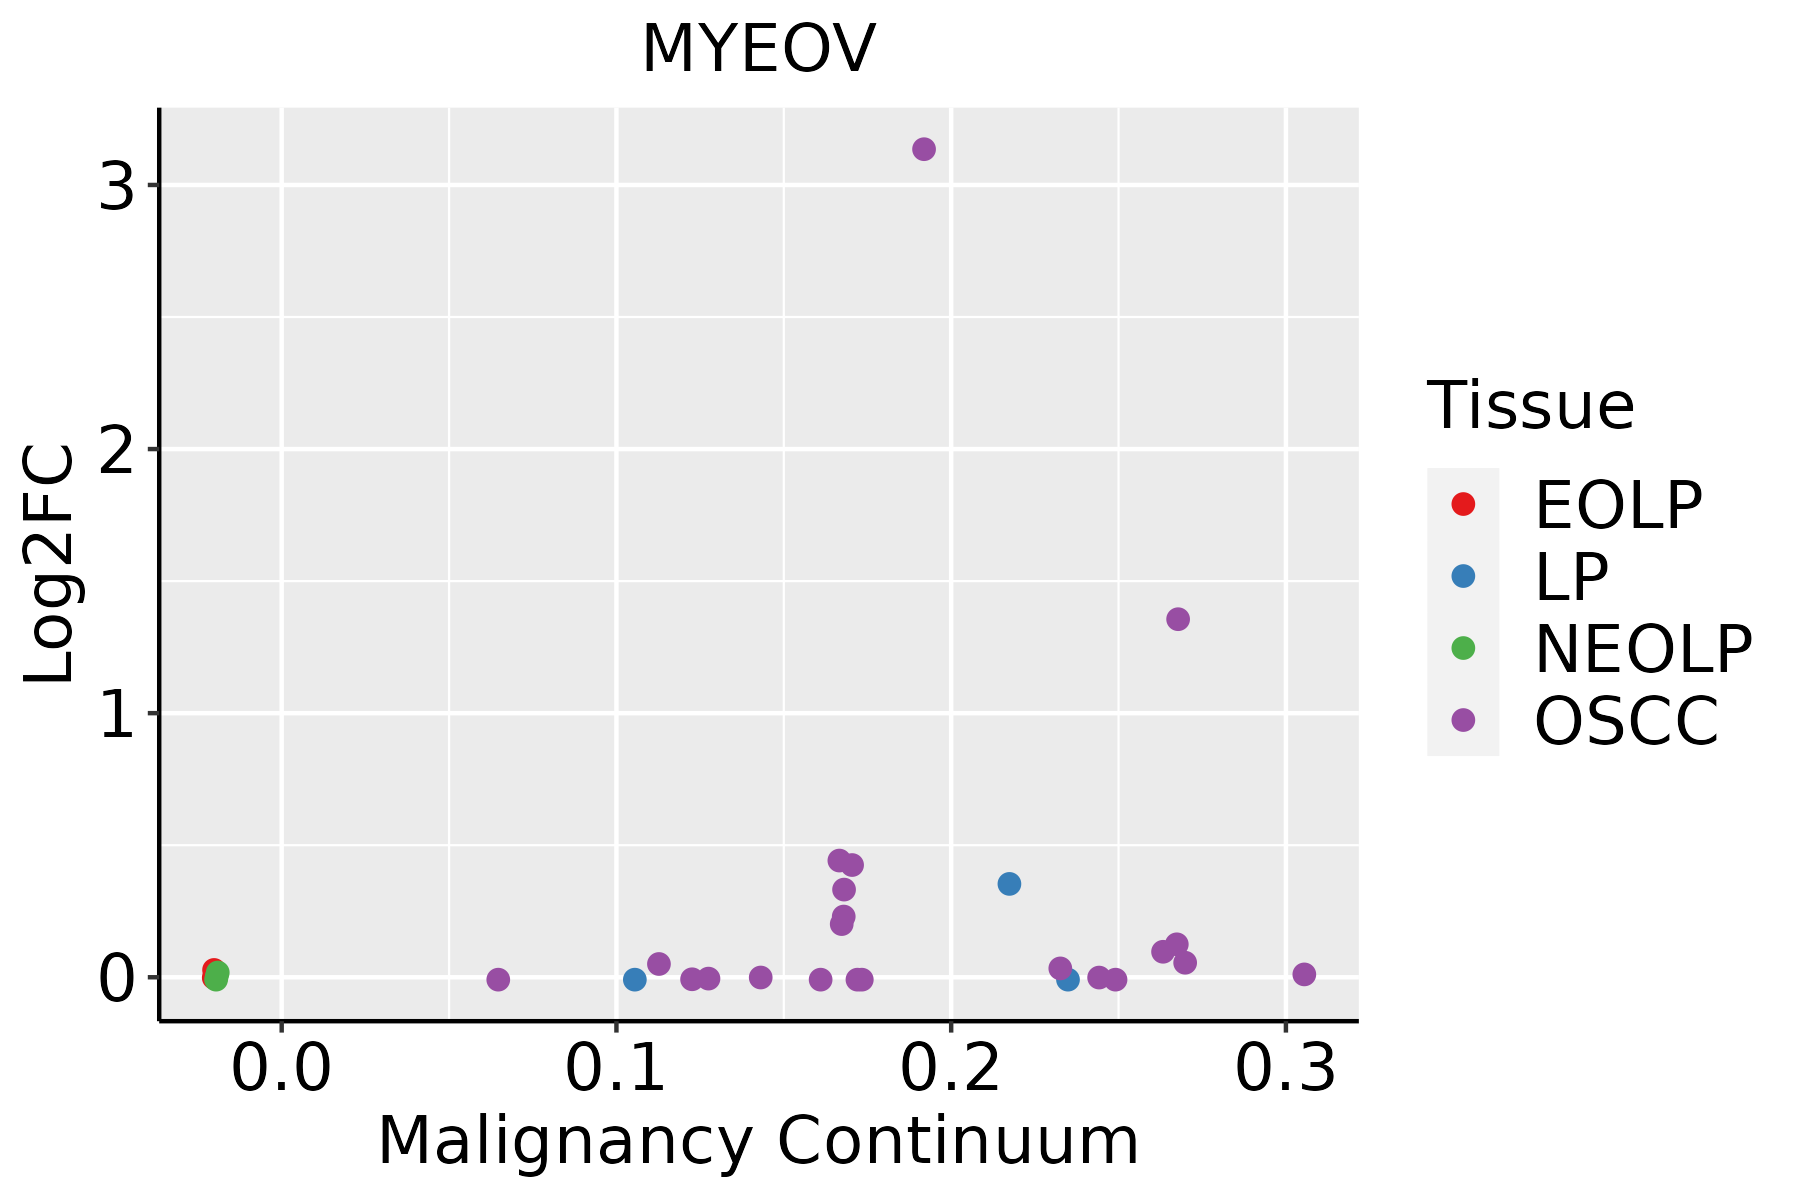 | EOLP: Erosive Oral lichen planus |
| LP: leukoplakia | ||
| NEOLP: Non-erosive oral lichen planus | ||
| OSCC: Oral squamous cell carcinoma | ||
| Thyroid | 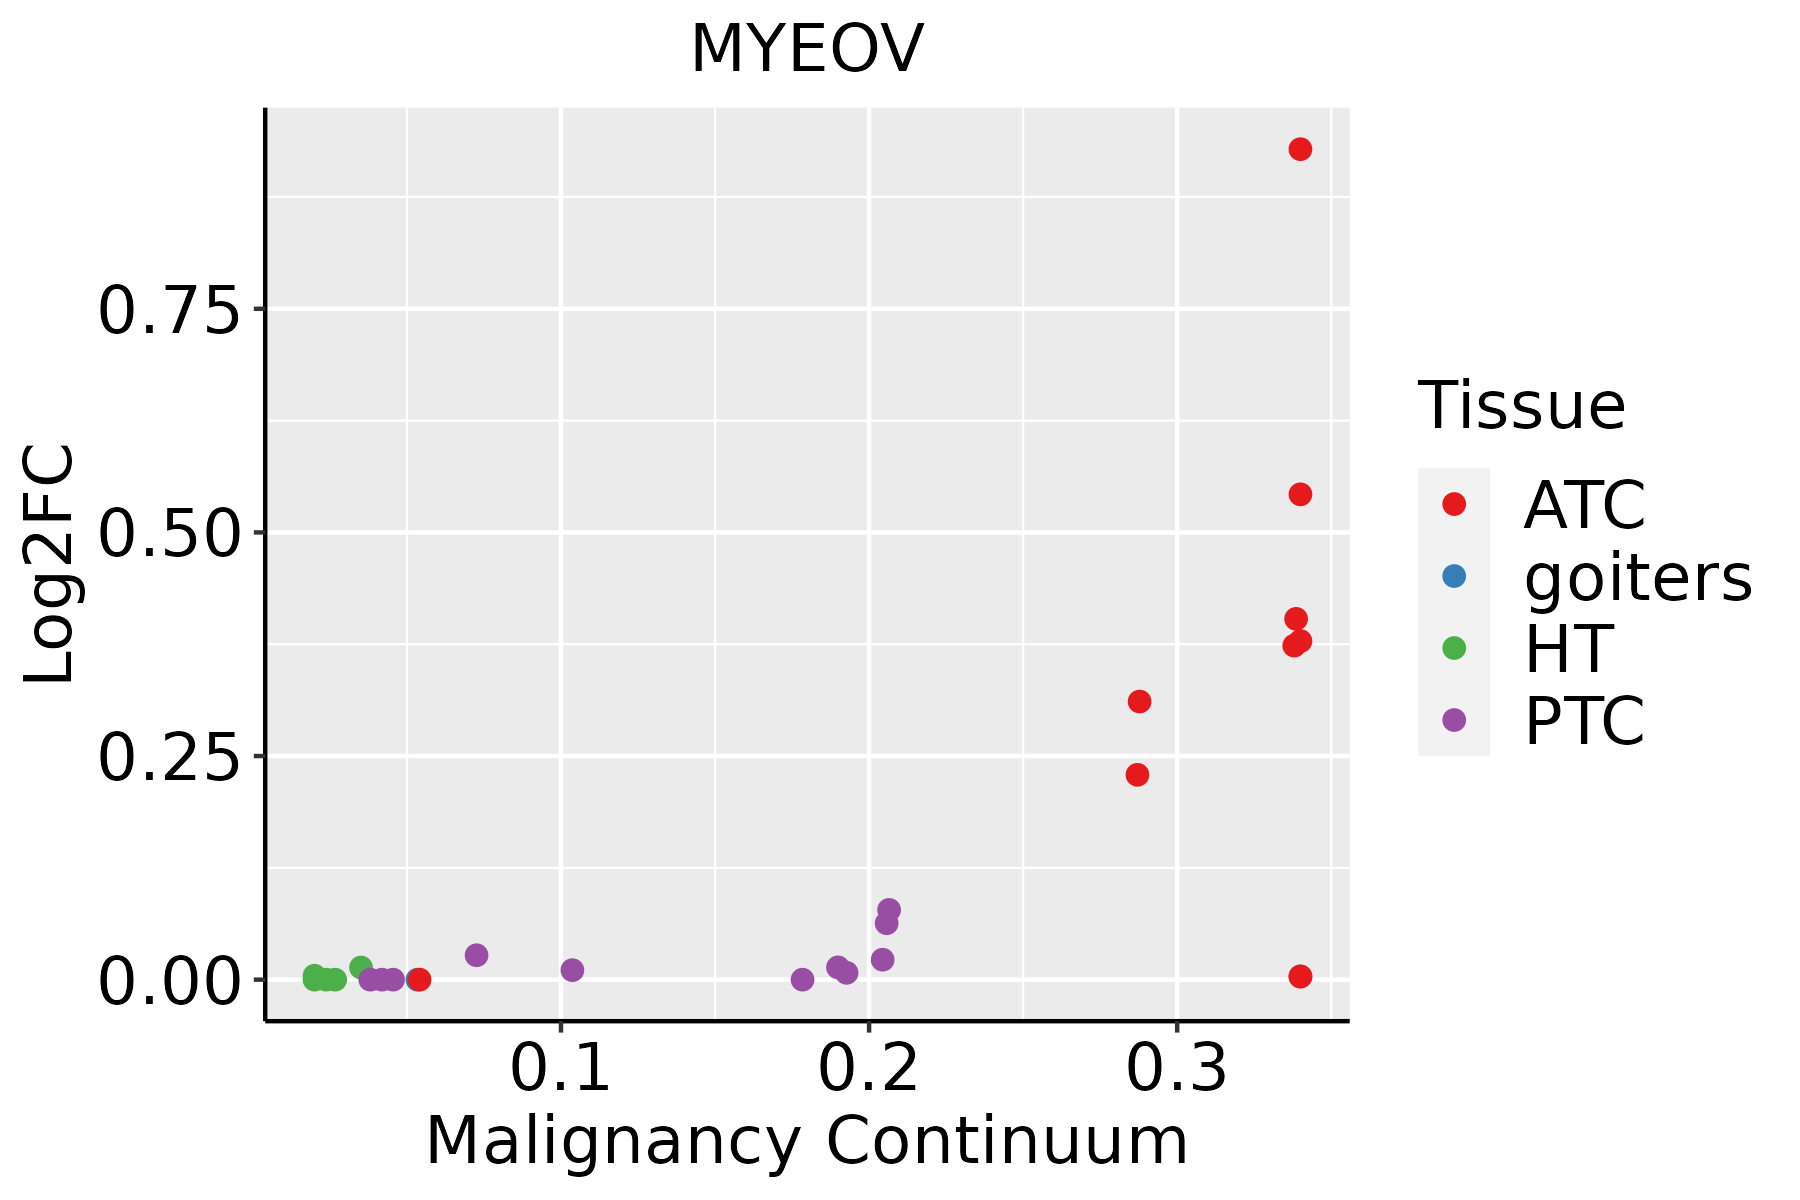 | ATC: Anaplastic thyroid cancer |
| HT: Hashimoto's thyroiditis | ||
| PTC: Papillary thyroid cancer |
| ∗log2FC in expression of this searched gene in stem-like cells from each diseased tissue sample relative to stem-like cells in normal samples in each tissue plotted against the malignancy continuum. Samples are colored based on if they are from different disease stage. |
Top |
Malignant transformation related pathway analysis |
| Find out the enriched GO biological processes and KEGG pathways involved in transition from healthy to precancer to cancer |
| Tissue | Disease Stage | Enriched GO biological Processes |
| Colorectum | AD |  |
| Colorectum | SER |  |
| Colorectum | MSS |  |
| Colorectum | MSI-H |  |
| Colorectum | FAP |  |
| ∗Top 15 enriched GO BP terms are showed in the bar plot of each disease state in each tissue. Each row represents a significant GO biological process which is colored according to the -log10(p.adjust). |
| Page: 1 2 3 4 5 6 7 8 9 |
| GO ID | Tissue | Disease Stage | Description | Gene Ratio | Bg Ratio | pvalue | p.adjust | Count |
| Page: 1 |
| Pathway ID | Tissue | Disease Stage | Description | Gene Ratio | Bg Ratio | pvalue | p.adjust | qvalue | Count |
| Page: 1 |
Top |
Cell-cell communication analysis |
| Identification of potential cell-cell interactions between two cell types and their ligand-receptor pairs for different disease states |
| Ligand | Receptor | LRpair | Pathway | Tissue | Disease Stage |
| Page: 1 |
Top |
Single-cell gene regulatory network inference analysis |
| Find out the significant the regulons (TFs) and the target genes of each regulon across cell types for different disease states |
| TF | Cell Type | Tissue | Disease Stage | Target Gene | RSS | Regulon Activity |
| ∗The dot plots of a searched regulon are shown for all cell subpopulations in each disease state of each tissue based on the regulon specific score inferred using pySCENIC and by calculating the average expression. |
| Page: 1 |
Top |
Somatic mutation of malignant transformation related genes |
| Annotation of somatic variants for genes involved in malignant transformation |
| Hugo Symbol | Variant Class | Variant Classification | dbSNP RS | HGVSc | HGVSp | HGVSp Short | SWISSPROT | BIOTYPE | SIFT | PolyPhen | Tumor Sample Barcode | Tissue | Histology | Sex | Age | Stage | Therapy Types | Drugs | Outcome |
| MYEOV | SNV | Missense_Mutation | c.490C>T | p.His164Tyr | p.H164Y | Q96EZ4 | protein_coding | tolerated_low_confidence(0.35) | benign(0.029) | TCGA-AC-A23H-01 | Breast | breast invasive carcinoma | Female | >=65 | I/II | Unknown | Unknown | PD | |
| MYEOV | SNV | Missense_Mutation | novel | c.454N>A | p.Ser152Thr | p.S152T | Q96EZ4 | protein_coding | deleterious_low_confidence(0) | possibly_damaging(0.583) | TCGA-AC-A2BK-01 | Breast | breast invasive carcinoma | Female | >=65 | III/IV | Chemotherapy | cytoxan | CR |
| MYEOV | SNV | Missense_Mutation | novel | c.904C>A | p.Leu302Ile | p.L302I | Q96EZ4 | protein_coding | benign(0.011) | TCGA-AA-3811-01 | Colorectum | colon adenocarcinoma | Female | >=65 | III/IV | Unknown | Unknown | PD | |
| MYEOV | SNV | Missense_Mutation | c.487N>A | p.Ala163Thr | p.A163T | Q96EZ4 | protein_coding | deleterious_low_confidence(0.02) | benign(0.06) | TCGA-AD-6889-01 | Colorectum | colon adenocarcinoma | Male | >=65 | I/II | Chemotherapy | xeloda | PD | |
| MYEOV | SNV | Missense_Mutation | c.577G>A | p.Glu193Lys | p.E193K | Q96EZ4 | protein_coding | deleterious_low_confidence(0) | possibly_damaging(0.896) | TCGA-EI-6507-01 | Colorectum | rectum adenocarcinoma | Male | <65 | I/II | Unknown | Unknown | SD | |
| MYEOV | SNV | Missense_Mutation | novel | c.802G>T | p.Ala268Ser | p.A268S | Q96EZ4 | protein_coding | deleterious_low_confidence(0) | benign(0.266) | TCGA-A5-A0G1-01 | Endometrium | uterine corpus endometrioid carcinoma | Female | >=65 | I/II | Unknown | Unknown | SD |
| MYEOV | SNV | Missense_Mutation | novel | c.578N>T | p.Glu193Val | p.E193V | Q96EZ4 | protein_coding | deleterious_low_confidence(0) | probably_damaging(0.979) | TCGA-A5-A2K5-01 | Endometrium | uterine corpus endometrioid carcinoma | Female | >=65 | I/II | Unknown | Unknown | SD |
| MYEOV | SNV | Missense_Mutation | rs754058415 | c.484N>A | p.Val162Ile | p.V162I | Q96EZ4 | protein_coding | tolerated_low_confidence(1) | benign(0) | TCGA-AX-A2HD-01 | Endometrium | uterine corpus endometrioid carcinoma | Female | >=65 | III/IV | Unknown | Unknown | SD |
| MYEOV | SNV | Missense_Mutation | rs543791821 | c.611G>A | p.Arg204His | p.R204H | Q96EZ4 | protein_coding | tolerated_low_confidence(0.21) | benign(0) | TCGA-D1-A103-01 | Endometrium | uterine corpus endometrioid carcinoma | Female | >=65 | I/II | Unknown | Unknown | SD |
| MYEOV | SNV | Missense_Mutation | novel | c.623G>A | p.Arg208Gln | p.R208Q | Q96EZ4 | protein_coding | tolerated_low_confidence(0.25) | benign(0.031) | TCGA-FI-A2D0-01 | Endometrium | uterine corpus endometrioid carcinoma | Female | <65 | I/II | Unknown | Unknown | SD |
| Page: 1 2 3 4 |
Top |
Related drugs of malignant transformation related genes |
| Identification of chemicals and drugs interact with genes involved in malignant transfromation |
| (DGIdb 4.0) |
| Entrez ID | Symbol | Category | Interaction Types | Drug Claim Name | Drug Name | PMIDs |
| Page: 1 |

Copyright 2023-Present -The University of Texas Health Science Center at Houston |