
|
|||||
|
 | |
| |
| |
| |
| |
| |
|
Gene: MYEF2 |
Gene summary for MYEF2 |
| Gene information | Species | Human | Gene symbol | MYEF2 | Gene ID | 50804 |
| Gene name | myelin expression factor 2 | |
| Gene Alias | HsT18564 | |
| Cytomap | 15q21.1 | |
| Gene Type | protein-coding | GO ID | GO:0006139 | UniProtAcc | Q9P2K5 |
Top |
Malignant transformation analysis |
| Identification of the aberrant gene expression in precancerous and cancerous lesions by comparing the gene expression of stem-like cells in diseased tissues with normal stem cells |
| Entrez ID | Symbol | Replicates | Species | Organ | Tissue | Adj P-value | Log2FC | Malignancy |
| 50804 | MYEF2 | HCC1_Meng | Human | Liver | HCC | 3.62e-14 | -6.18e-03 | 0.0246 |
| 50804 | MYEF2 | HCC2_Meng | Human | Liver | HCC | 7.53e-04 | 6.25e-03 | 0.0107 |
| 50804 | MYEF2 | S014 | Human | Liver | HCC | 2.50e-08 | 4.81e-01 | 0.2254 |
| 50804 | MYEF2 | S015 | Human | Liver | HCC | 1.26e-17 | 7.19e-01 | 0.2375 |
| 50804 | MYEF2 | S016 | Human | Liver | HCC | 2.81e-16 | 6.43e-01 | 0.2243 |
| 50804 | MYEF2 | HTA12-23-1 | Human | Pancreas | PDAC | 6.67e-08 | 7.62e-01 | 0.3405 |
| 50804 | MYEF2 | HTA12-25-1 | Human | Pancreas | PDAC | 2.31e-07 | 6.29e-01 | 0.313 |
| 50804 | MYEF2 | HTA12-26-1 | Human | Pancreas | PDAC | 3.72e-17 | 8.39e-01 | 0.3728 |
| 50804 | MYEF2 | HTA12-29-1 | Human | Pancreas | PDAC | 5.68e-44 | 8.78e-01 | 0.3722 |
| 50804 | MYEF2 | HTA12-30-1 | Human | Pancreas | PDAC | 3.65e-03 | 9.56e-01 | 0.3671 |
| 50804 | MYEF2 | male-WTA | Human | Thyroid | PTC | 1.21e-18 | 2.15e-01 | 0.1037 |
| 50804 | MYEF2 | PTC01 | Human | Thyroid | PTC | 8.67e-14 | 2.77e-01 | 0.1899 |
| 50804 | MYEF2 | PTC03 | Human | Thyroid | PTC | 3.42e-09 | 6.27e-01 | 0.1784 |
| 50804 | MYEF2 | PTC04 | Human | Thyroid | PTC | 2.94e-24 | 5.21e-01 | 0.1927 |
| 50804 | MYEF2 | PTC05 | Human | Thyroid | PTC | 7.28e-25 | 7.27e-01 | 0.2065 |
| 50804 | MYEF2 | PTC06 | Human | Thyroid | PTC | 9.63e-36 | 8.49e-01 | 0.2057 |
| 50804 | MYEF2 | PTC07 | Human | Thyroid | PTC | 2.68e-42 | 7.09e-01 | 0.2044 |
| 50804 | MYEF2 | ATC09 | Human | Thyroid | ATC | 3.00e-11 | 2.93e-01 | 0.2871 |
| 50804 | MYEF2 | ATC13 | Human | Thyroid | ATC | 6.60e-47 | 8.56e-01 | 0.34 |
| 50804 | MYEF2 | ATC1 | Human | Thyroid | ATC | 1.16e-09 | 3.58e-01 | 0.2878 |
| Page: 1 2 |
| Tissue | Expression Dynamics | Abbreviation |
| Liver | 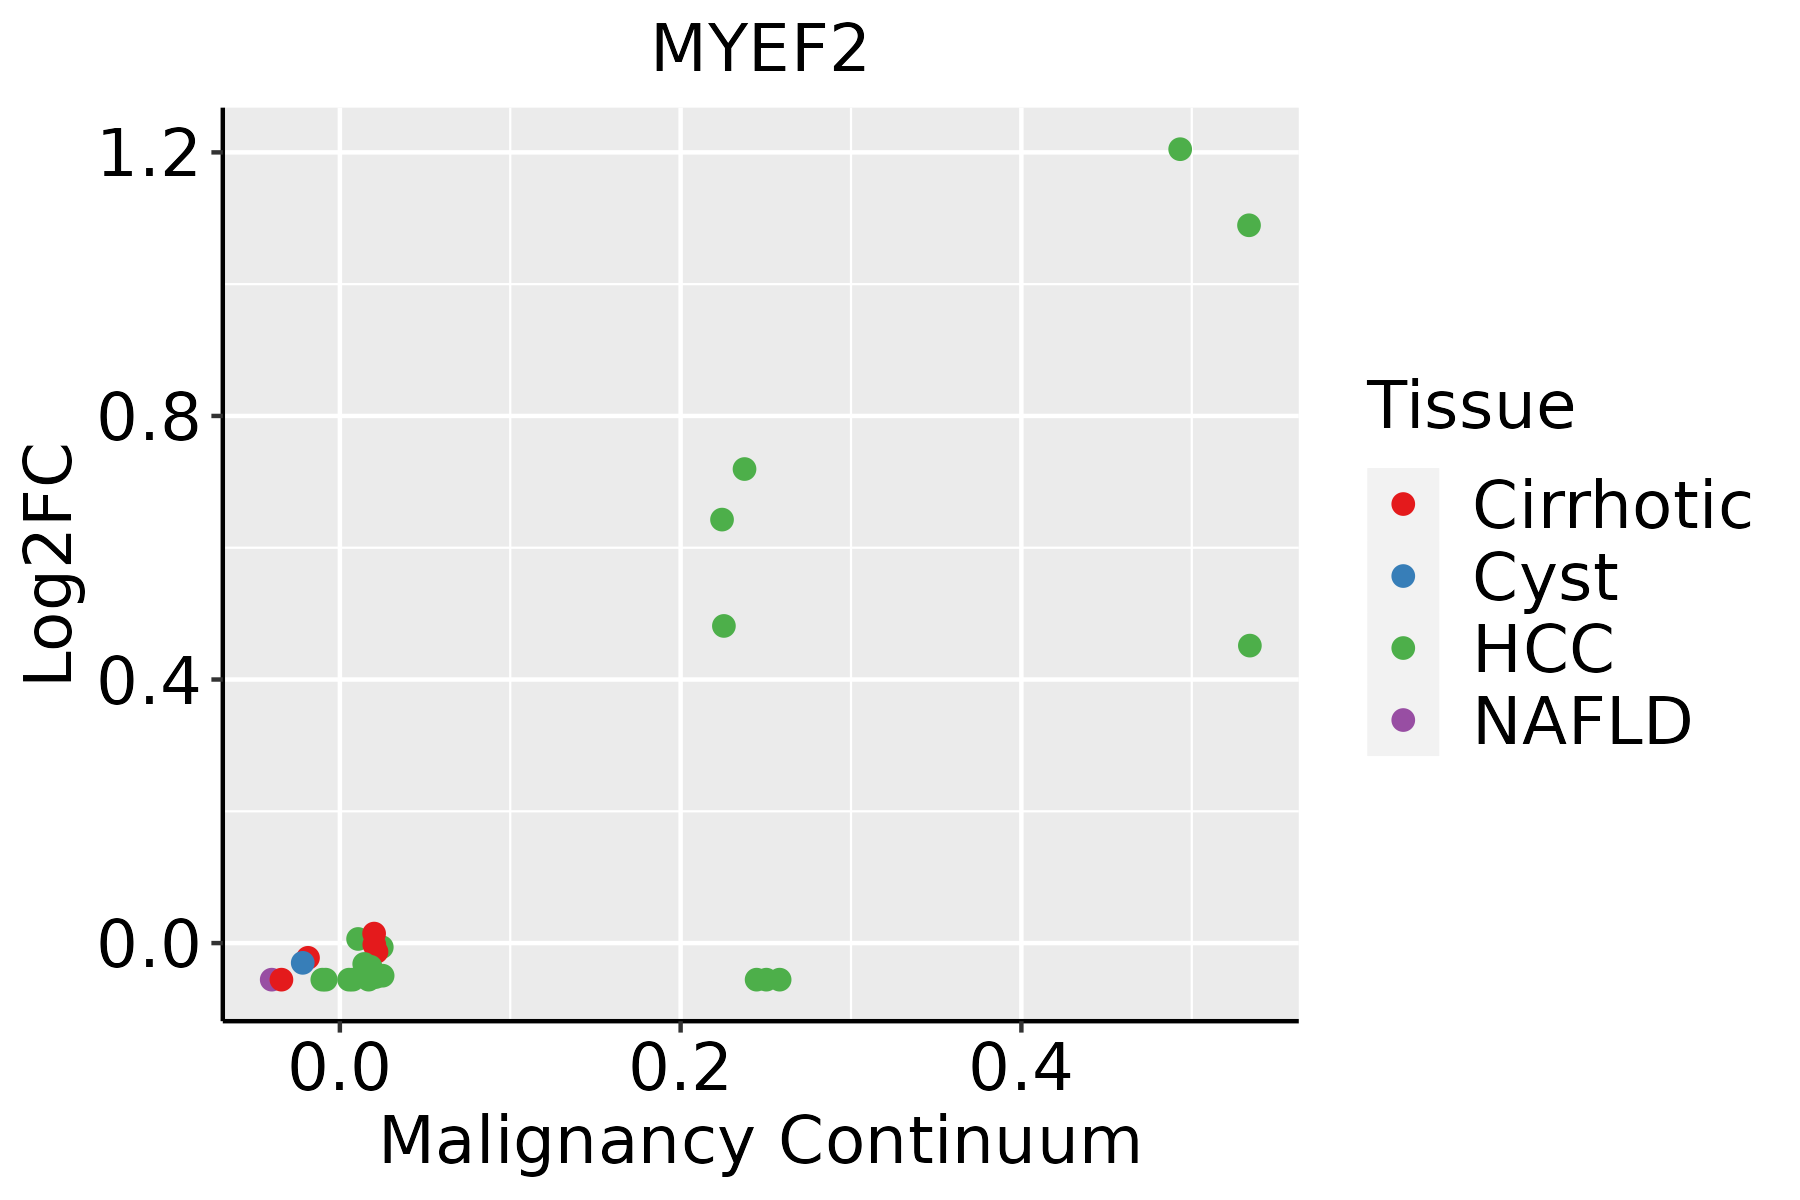 | HCC: Hepatocellular carcinoma |
| NAFLD: Non-alcoholic fatty liver disease | ||
| Thyroid |  | ATC: Anaplastic thyroid cancer |
| HT: Hashimoto's thyroiditis | ||
| PTC: Papillary thyroid cancer |
| ∗log2FC in expression of this searched gene in stem-like cells from each diseased tissue sample relative to stem-like cells in normal samples in each tissue plotted against the malignancy continuum. Samples are colored based on if they are from different disease stage. |
Top |
Malignant transformation related pathway analysis |
| Find out the enriched GO biological processes and KEGG pathways involved in transition from healthy to precancer to cancer |
| Tissue | Disease Stage | Enriched GO biological Processes |
| Colorectum | AD |  |
| Colorectum | SER |  |
| Colorectum | MSS |  |
| Colorectum | MSI-H |  |
| Colorectum | FAP |  |
| ∗Top 15 enriched GO BP terms are showed in the bar plot of each disease state in each tissue. Each row represents a significant GO biological process which is colored according to the -log10(p.adjust). |
| Page: 1 2 3 4 5 6 7 8 9 |
| GO ID | Tissue | Disease Stage | Description | Gene Ratio | Bg Ratio | pvalue | p.adjust | Count |
| GO:004427021 | Liver | HCC | cellular nitrogen compound catabolic process | 303/7958 | 451/18723 | 9.76e-27 | 3.64e-24 | 303 |
| GO:004670021 | Liver | HCC | heterocycle catabolic process | 299/7958 | 445/18723 | 2.07e-26 | 7.29e-24 | 299 |
| GO:190136121 | Liver | HCC | organic cyclic compound catabolic process | 325/7958 | 495/18723 | 6.52e-26 | 2.18e-23 | 325 |
| GO:001943921 | Liver | HCC | aromatic compound catabolic process | 309/7958 | 467/18723 | 1.56e-25 | 4.94e-23 | 309 |
| GO:000640121 | Liver | HCC | RNA catabolic process | 201/7958 | 278/18723 | 3.88e-24 | 1.02e-21 | 201 |
| GO:003465521 | Liver | HCC | nucleobase-containing compound catabolic process | 273/7958 | 407/18723 | 4.84e-24 | 1.23e-21 | 273 |
| GO:190331121 | Liver | HCC | regulation of mRNA metabolic process | 205/7958 | 288/18723 | 3.38e-23 | 6.90e-21 | 205 |
| GO:000640221 | Liver | HCC | mRNA catabolic process | 169/7958 | 232/18723 | 4.50e-21 | 6.96e-19 | 169 |
| GO:000697922 | Liver | HCC | response to oxidative stress | 281/7958 | 446/18723 | 9.75e-19 | 1.24e-16 | 281 |
| GO:004348721 | Liver | HCC | regulation of RNA stability | 119/7958 | 170/18723 | 3.20e-13 | 1.71e-11 | 119 |
| GO:004348821 | Liver | HCC | regulation of mRNA stability | 110/7958 | 158/18723 | 4.36e-12 | 1.93e-10 | 110 |
| GO:006101321 | Liver | HCC | regulation of mRNA catabolic process | 114/7958 | 166/18723 | 7.38e-12 | 3.12e-10 | 114 |
| GO:1903311112 | Thyroid | PTC | regulation of mRNA metabolic process | 181/5968 | 288/18723 | 1.60e-27 | 5.94e-25 | 181 |
| GO:0006401112 | Thyroid | PTC | RNA catabolic process | 163/5968 | 278/18723 | 2.13e-20 | 3.27e-18 | 163 |
| GO:0006979113 | Thyroid | PTC | response to oxidative stress | 234/5968 | 446/18723 | 6.97e-20 | 9.77e-18 | 234 |
| GO:0006402112 | Thyroid | PTC | mRNA catabolic process | 139/5968 | 232/18723 | 9.59e-19 | 1.12e-16 | 139 |
| GO:0034655112 | Thyroid | PTC | nucleobase-containing compound catabolic process | 211/5968 | 407/18723 | 2.72e-17 | 2.52e-15 | 211 |
| GO:0046700111 | Thyroid | PTC | heterocycle catabolic process | 221/5968 | 445/18723 | 2.43e-15 | 1.72e-13 | 221 |
| GO:0044270111 | Thyroid | PTC | cellular nitrogen compound catabolic process | 223/5968 | 451/18723 | 3.34e-15 | 2.31e-13 | 223 |
| GO:0019439111 | Thyroid | PTC | aromatic compound catabolic process | 225/5968 | 467/18723 | 8.51e-14 | 4.71e-12 | 225 |
| Page: 1 2 |
| Pathway ID | Tissue | Disease Stage | Description | Gene Ratio | Bg Ratio | pvalue | p.adjust | qvalue | Count |
| Page: 1 |
Top |
Cell-cell communication analysis |
| Identification of potential cell-cell interactions between two cell types and their ligand-receptor pairs for different disease states |
| Ligand | Receptor | LRpair | Pathway | Tissue | Disease Stage |
| Page: 1 |
Top |
Single-cell gene regulatory network inference analysis |
| Find out the significant the regulons (TFs) and the target genes of each regulon across cell types for different disease states |
| TF | Cell Type | Tissue | Disease Stage | Target Gene | RSS | Regulon Activity |
| MYEF2 | TFH | Cervix | ADJ | CLNK,RGS18,VCPIP1, etc. | 1.61e-02 |  |
| MYEF2 | NK | Cervix | N_HPV | CLNK,RGS18,VCPIP1, etc. | 7.36e-02 |  |
| MYEF2 | TAC | Colorectum | AD | BNIP3,RNF180,ZNF14, etc. | 1.05e-01 |  |
| MYEF2 | TAC | Colorectum | MSI-H | BNIP3,RNF180,ZNF14, etc. | 2.98e-01 |  |
| MYEF2 | TUF | Colorectum | MSS | BNIP3,RNF180,ZNF14, etc. | 2.25e-02 |  |
| MYEF2 | EE | Colorectum | MSS | BNIP3,RNF180,ZNF14, etc. | 1.26e-02 | |
| MYEF2 | TAC | Colorectum | SER | BNIP3,RNF180,ZNF14, etc. | 1.36e-01 |  |
| MYEF2 | DC | Colorectum | Healthy | CENPE,PRIM1,CEP70, etc. | 4.13e-02 |  |
| MYEF2 | GC | Colorectum | MSI-H | CENPE,PRIM1,CEP70, etc. | 8.81e-02 | |
| MYEF2 | MYOFIB | Colorectum | ADJ | USP16,TTLL7,GRIPAP1, etc. | 3.08e-01 |  |
| ∗The dot plots of a searched regulon are shown for all cell subpopulations in each disease state of each tissue based on the regulon specific score inferred using pySCENIC and by calculating the average expression. |
| Page: 1 2 3 4 |
Top |
Somatic mutation of malignant transformation related genes |
| Annotation of somatic variants for genes involved in malignant transformation |
| Hugo Symbol | Variant Class | Variant Classification | dbSNP RS | HGVSc | HGVSp | HGVSp Short | SWISSPROT | BIOTYPE | SIFT | PolyPhen | Tumor Sample Barcode | Tissue | Histology | Sex | Age | Stage | Therapy Types | Drugs | Outcome |
| MYEF2 | SNV | Missense_Mutation | rs759813289 | c.1664N>C | p.Lys555Thr | p.K555T | protein_coding | deleterious(0.01) | possibly_damaging(0.465) | TCGA-A8-A08C-01 | Breast | breast invasive carcinoma | Female | >=65 | I/II | Chemotherapy | 5-fluorouracil | CR | |
| MYEF2 | SNV | Missense_Mutation | novel | c.261G>T | p.Lys87Asn | p.K87N | protein_coding | deleterious(0.02) | probably_damaging(0.995) | TCGA-AN-A046-01 | Breast | breast invasive carcinoma | Female | >=65 | I/II | Unknown | Unknown | SD | |
| MYEF2 | SNV | Missense_Mutation | c.1370N>G | p.Ser457Cys | p.S457C | protein_coding | tolerated(0.06) | benign(0.001) | TCGA-BH-A0DZ-01 | Breast | breast invasive carcinoma | Female | <65 | I/II | Chemotherapy | docetaxel | SD | ||
| MYEF2 | insertion | Nonsense_Mutation | novel | c.892_893insGATAGACTATTATACTACCAATAAAAA | p.Leu298delinsTer | p.L298delins* | protein_coding | TCGA-AR-A0U0-01 | Breast | breast invasive carcinoma | Female | >=65 | I/II | Unknown | Unknown | SD | |||
| MYEF2 | SNV | Missense_Mutation | novel | c.733G>C | p.Gly245Arg | p.G245R | protein_coding | deleterious(0) | probably_damaging(1) | TCGA-C5-A3HE-01 | Cervix | cervical & endocervical cancer | Female | <65 | I/II | Unknown | Unknown | PD | |
| MYEF2 | SNV | Missense_Mutation | novel | c.1258N>A | p.Gly420Ser | p.G420S | protein_coding | tolerated(0.34) | benign(0.025) | TCGA-C5-A7UI-01 | Cervix | cervical & endocervical cancer | Female | <65 | I/II | Unknown | Unknown | SD | |
| MYEF2 | SNV | Missense_Mutation | c.841N>C | p.Glu281Gln | p.E281Q | protein_coding | deleterious(0) | probably_damaging(0.991) | TCGA-EK-A2PL-01 | Cervix | cervical & endocervical cancer | Female | <65 | III/IV | Unknown | Unknown | SD | ||
| MYEF2 | SNV | Missense_Mutation | c.98C>T | p.Pro33Leu | p.P33L | protein_coding | deleterious_low_confidence(0.05) | benign(0.001) | TCGA-A6-2686-01 | Colorectum | colon adenocarcinoma | Female | >=65 | I/II | Unknown | Unknown | SD | ||
| MYEF2 | SNV | Missense_Mutation | c.1381G>T | p.Gly461Cys | p.G461C | protein_coding | deleterious(0.05) | probably_damaging(0.997) | TCGA-AA-3663-01 | Colorectum | colon adenocarcinoma | Male | <65 | I/II | Unknown | Unknown | SD | ||
| MYEF2 | SNV | Missense_Mutation | rs372821159 | c.407C>T | p.Ala136Val | p.A136V | protein_coding | deleterious(0.01) | probably_damaging(0.996) | TCGA-AA-3672-01 | Colorectum | colon adenocarcinoma | Female | >=65 | III/IV | Unknown | Unknown | SD |
| Page: 1 2 3 4 5 6 7 |
Top |
Related drugs of malignant transformation related genes |
| Identification of chemicals and drugs interact with genes involved in malignant transfromation |
| (DGIdb 4.0) |
| Entrez ID | Symbol | Category | Interaction Types | Drug Claim Name | Drug Name | PMIDs |
| Page: 1 |

Copyright 2023-Present -The University of Texas Health Science Center at Houston |