
|
|||||
|
 | |
| |
| |
| |
| |
| |
|
Gene: MYCBP |
Gene summary for MYCBP |
| Gene information | Species | Human | Gene symbol | MYCBP | Gene ID | 26292 |
| Gene name | MYC binding protein | |
| Gene Alias | AMY-1 | |
| Cytomap | 1p34.3 | |
| Gene Type | protein-coding | GO ID | GO:0000003 | UniProtAcc | Q99417 |
Top |
Malignant transformation analysis |
| Identification of the aberrant gene expression in precancerous and cancerous lesions by comparing the gene expression of stem-like cells in diseased tissues with normal stem cells |
| Entrez ID | Symbol | Replicates | Species | Organ | Tissue | Adj P-value | Log2FC | Malignancy |
| 26292 | MYCBP | LZE2T | Human | Esophagus | ESCC | 2.03e-08 | 7.81e-01 | 0.082 |
| 26292 | MYCBP | LZE4T | Human | Esophagus | ESCC | 2.57e-07 | 1.67e-01 | 0.0811 |
| 26292 | MYCBP | LZE7T | Human | Esophagus | ESCC | 9.32e-13 | 5.42e-01 | 0.0667 |
| 26292 | MYCBP | LZE8T | Human | Esophagus | ESCC | 6.76e-09 | 3.31e-01 | 0.067 |
| 26292 | MYCBP | LZE20T | Human | Esophagus | ESCC | 5.08e-12 | 4.72e-01 | 0.0662 |
| 26292 | MYCBP | LZE22D1 | Human | Esophagus | HGIN | 3.33e-08 | 3.07e-01 | 0.0595 |
| 26292 | MYCBP | LZE22T | Human | Esophagus | ESCC | 2.21e-11 | 7.21e-01 | 0.068 |
| 26292 | MYCBP | LZE24T | Human | Esophagus | ESCC | 8.02e-25 | 7.93e-01 | 0.0596 |
| 26292 | MYCBP | LZE21T | Human | Esophagus | ESCC | 5.30e-06 | 4.53e-01 | 0.0655 |
| 26292 | MYCBP | LZE6T | Human | Esophagus | ESCC | 1.10e-15 | 5.31e-01 | 0.0845 |
| 26292 | MYCBP | P1T-E | Human | Esophagus | ESCC | 1.26e-12 | 6.20e-01 | 0.0875 |
| 26292 | MYCBP | P2T-E | Human | Esophagus | ESCC | 5.97e-27 | 4.52e-01 | 0.1177 |
| 26292 | MYCBP | P4T-E | Human | Esophagus | ESCC | 3.84e-30 | 7.93e-01 | 0.1323 |
| 26292 | MYCBP | P5T-E | Human | Esophagus | ESCC | 3.75e-45 | 8.35e-01 | 0.1327 |
| 26292 | MYCBP | P8T-E | Human | Esophagus | ESCC | 1.58e-46 | 8.73e-01 | 0.0889 |
| 26292 | MYCBP | P9T-E | Human | Esophagus | ESCC | 8.46e-16 | 3.94e-01 | 0.1131 |
| 26292 | MYCBP | P10T-E | Human | Esophagus | ESCC | 6.41e-26 | 4.44e-01 | 0.116 |
| 26292 | MYCBP | P11T-E | Human | Esophagus | ESCC | 5.64e-11 | 4.17e-01 | 0.1426 |
| 26292 | MYCBP | P12T-E | Human | Esophagus | ESCC | 5.40e-18 | 2.90e-01 | 0.1122 |
| 26292 | MYCBP | P15T-E | Human | Esophagus | ESCC | 1.55e-33 | 6.86e-01 | 0.1149 |
| Page: 1 2 3 4 5 6 |
| Tissue | Expression Dynamics | Abbreviation |
| Esophagus | 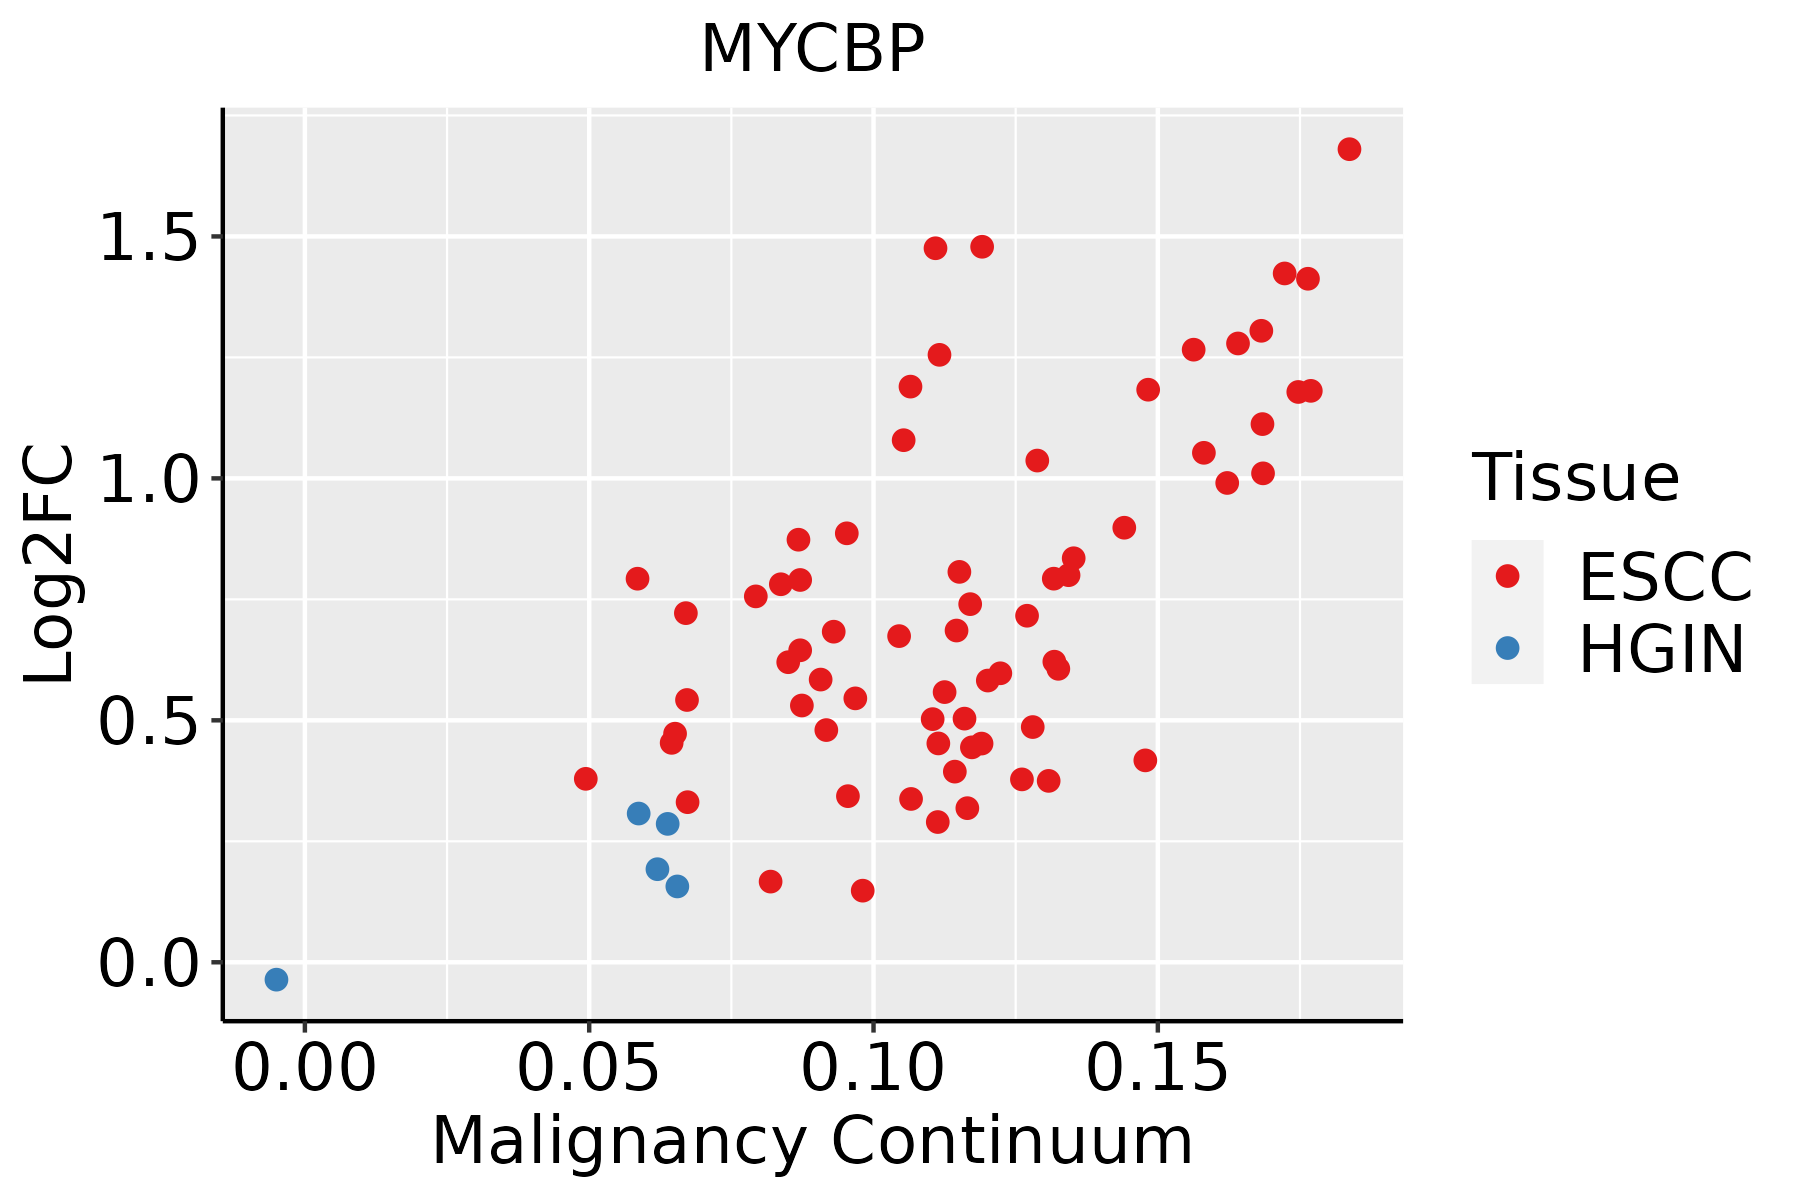 | ESCC: Esophageal squamous cell carcinoma |
| HGIN: High-grade intraepithelial neoplasias | ||
| LGIN: Low-grade intraepithelial neoplasias | ||
| Liver | 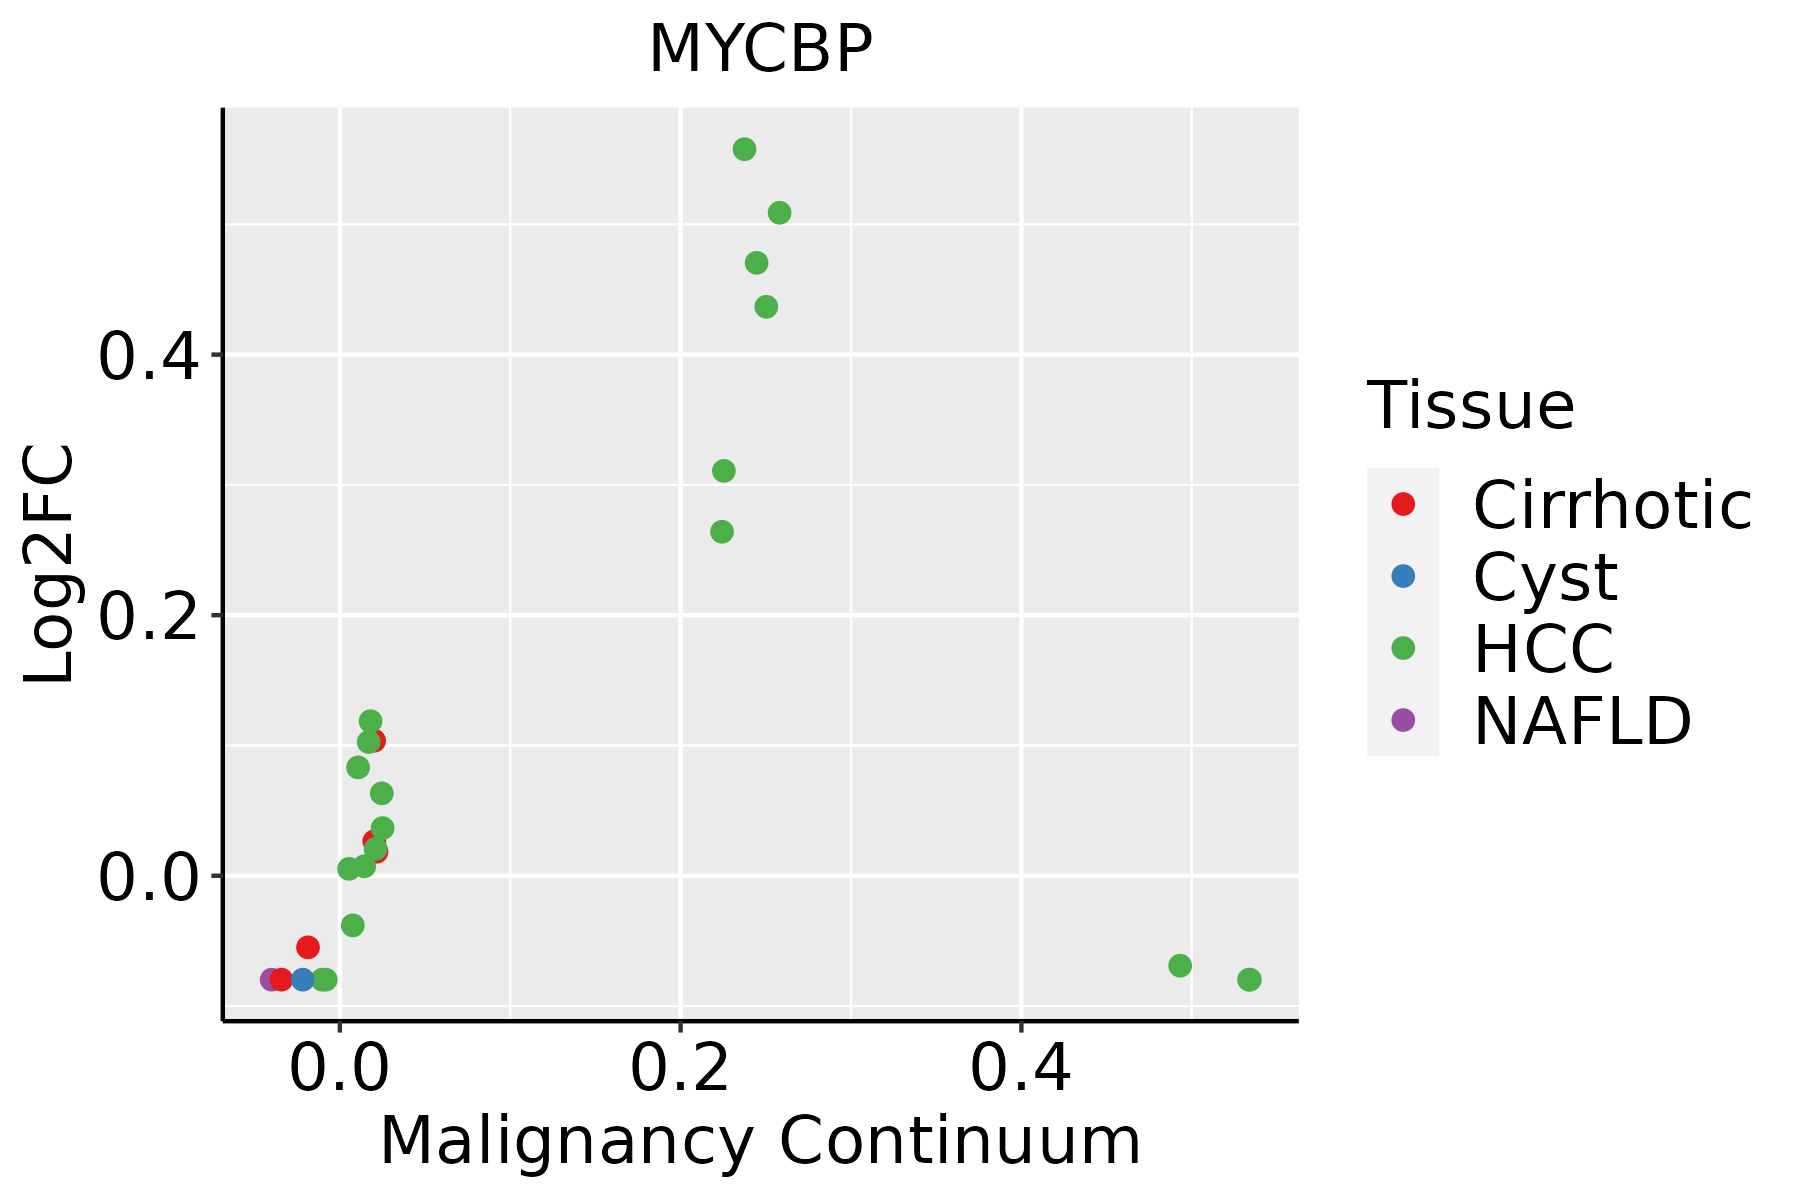 | HCC: Hepatocellular carcinoma |
| NAFLD: Non-alcoholic fatty liver disease | ||
| Oral Cavity |  | EOLP: Erosive Oral lichen planus |
| LP: leukoplakia | ||
| NEOLP: Non-erosive oral lichen planus | ||
| OSCC: Oral squamous cell carcinoma | ||
| Skin |  | AK: Actinic keratosis |
| cSCC: Cutaneous squamous cell carcinoma | ||
| SCCIS:squamous cell carcinoma in situ |
| ∗log2FC in expression of this searched gene in stem-like cells from each diseased tissue sample relative to stem-like cells in normal samples in each tissue plotted against the malignancy continuum. Samples are colored based on if they are from different disease stage. |
Top |
Malignant transformation related pathway analysis |
| Find out the enriched GO biological processes and KEGG pathways involved in transition from healthy to precancer to cancer |
| Tissue | Disease Stage | Enriched GO biological Processes |
| Colorectum | AD |  |
| Colorectum | SER |  |
| Colorectum | MSS |  |
| Colorectum | MSI-H |  |
| Colorectum | FAP |  |
| ∗Top 15 enriched GO BP terms are showed in the bar plot of each disease state in each tissue. Each row represents a significant GO biological process which is colored according to the -log10(p.adjust). |
| Page: 1 2 3 4 5 6 7 8 9 |
| GO ID | Tissue | Disease Stage | Description | Gene Ratio | Bg Ratio | pvalue | p.adjust | Count |
| GO:004217610 | Cervix | CC | regulation of protein catabolic process | 104/2311 | 391/18723 | 9.39e-15 | 9.36e-12 | 104 |
| GO:190332010 | Cervix | CC | regulation of protein modification by small protein conjugation or removal | 66/2311 | 242/18723 | 2.31e-10 | 3.46e-08 | 66 |
| GO:003139610 | Cervix | CC | regulation of protein ubiquitination | 59/2311 | 210/18723 | 5.90e-10 | 7.51e-08 | 59 |
| GO:000989510 | Cervix | CC | negative regulation of catabolic process | 69/2311 | 320/18723 | 2.15e-06 | 6.55e-05 | 69 |
| GO:00485118 | Cervix | CC | rhythmic process | 65/2311 | 298/18723 | 2.79e-06 | 8.04e-05 | 65 |
| GO:00509203 | Cervix | CC | regulation of chemotaxis | 51/2311 | 223/18723 | 8.03e-06 | 1.86e-04 | 51 |
| GO:00615647 | Cervix | CC | axon development | 89/2311 | 467/18723 | 1.71e-05 | 3.27e-04 | 89 |
| GO:00076238 | Cervix | CC | circadian rhythm | 46/2311 | 210/18723 | 6.76e-05 | 9.60e-04 | 46 |
| GO:00074097 | Cervix | CC | axonogenesis | 78/2311 | 418/18723 | 1.14e-04 | 1.43e-03 | 78 |
| GO:004217710 | Cervix | CC | negative regulation of protein catabolic process | 30/2311 | 121/18723 | 1.23e-04 | 1.53e-03 | 30 |
| GO:00329226 | Cervix | CC | circadian regulation of gene expression | 18/2311 | 68/18723 | 1.18e-03 | 9.56e-03 | 18 |
| GO:00219541 | Cervix | CC | central nervous system neuron development | 19/2311 | 81/18723 | 3.96e-03 | 2.48e-02 | 19 |
| GO:00313983 | Cervix | CC | positive regulation of protein ubiquitination | 25/2311 | 119/18723 | 5.09e-03 | 3.01e-02 | 25 |
| GO:19033224 | Cervix | CC | positive regulation of protein modification by small protein conjugation or removal | 28/2311 | 138/18723 | 5.26e-03 | 3.08e-02 | 28 |
| GO:003139625 | Cervix | N_HPV | regulation of protein ubiquitination | 24/534 | 210/18723 | 8.06e-09 | 1.60e-06 | 24 |
| GO:190332025 | Cervix | N_HPV | regulation of protein modification by small protein conjugation or removal | 25/534 | 242/18723 | 3.05e-08 | 3.66e-06 | 25 |
| GO:004217625 | Cervix | N_HPV | regulation of protein catabolic process | 28/534 | 391/18723 | 8.41e-06 | 2.92e-04 | 28 |
| GO:00509202 | Cervix | N_HPV | regulation of chemotaxis | 19/534 | 223/18723 | 2.29e-05 | 6.37e-04 | 19 |
| GO:00219531 | Cervix | N_HPV | central nervous system neuron differentiation | 11/534 | 162/18723 | 6.86e-03 | 4.55e-02 | 11 |
| GO:0042176 | Colorectum | AD | regulation of protein catabolic process | 160/3918 | 391/18723 | 1.06e-19 | 7.34e-17 | 160 |
| Page: 1 2 3 4 5 6 7 8 9 10 11 12 13 14 15 |
| Pathway ID | Tissue | Disease Stage | Description | Gene Ratio | Bg Ratio | pvalue | p.adjust | qvalue | Count |
| Page: 1 |
Top |
Cell-cell communication analysis |
| Identification of potential cell-cell interactions between two cell types and their ligand-receptor pairs for different disease states |
| Ligand | Receptor | LRpair | Pathway | Tissue | Disease Stage |
| Page: 1 |
Top |
Single-cell gene regulatory network inference analysis |
| Find out the significant the regulons (TFs) and the target genes of each regulon across cell types for different disease states |
| TF | Cell Type | Tissue | Disease Stage | Target Gene | RSS | Regulon Activity |
| ∗The dot plots of a searched regulon are shown for all cell subpopulations in each disease state of each tissue based on the regulon specific score inferred using pySCENIC and by calculating the average expression. |
| Page: 1 |
Top |
Somatic mutation of malignant transformation related genes |
| Annotation of somatic variants for genes involved in malignant transformation |
| Hugo Symbol | Variant Class | Variant Classification | dbSNP RS | HGVSc | HGVSp | HGVSp Short | SWISSPROT | BIOTYPE | SIFT | PolyPhen | Tumor Sample Barcode | Tissue | Histology | Sex | Age | Stage | Therapy Types | Drugs | Outcome |
| MYCBP | SNV | Missense_Mutation | c.106G>A | p.Glu36Lys | p.E36K | Q99417 | protein_coding | deleterious(0.03) | benign(0.132) | TCGA-C5-A1BI-01 | Cervix | cervical & endocervical cancer | Female | <65 | III/IV | Chemotherapy | cisplatin | SD | |
| MYCBP | SNV | Missense_Mutation | rs769601729 | c.211G>A | p.Glu71Lys | p.E71K | Q99417 | protein_coding | deleterious(0.03) | benign(0.395) | TCGA-AG-A002-01 | Colorectum | rectum adenocarcinoma | Male | <65 | I/II | Unknown | Unknown | SD |
| MYCBP | SNV | Missense_Mutation | rs769601729 | c.211N>A | p.Glu71Lys | p.E71K | Q99417 | protein_coding | deleterious(0.03) | benign(0.395) | TCGA-EI-6917-01 | Colorectum | rectum adenocarcinoma | Male | <65 | III/IV | Chemotherapy | 5fluorouracil+oxaciplatina+l-folinian | SD |
| MYCBP | SNV | Missense_Mutation | c.19N>A | p.Ala7Thr | p.A7T | Q99417 | protein_coding | tolerated(0.28) | benign(0.131) | TCGA-AP-A059-01 | Endometrium | uterine corpus endometrioid carcinoma | Female | >=65 | I/II | Unknown | Unknown | SD | |
| MYCBP | SNV | Missense_Mutation | rs764697452 | c.197G>A | p.Arg66His | p.R66H | Q99417 | protein_coding | tolerated(0.1) | benign(0.009) | TCGA-AX-A1CE-01 | Endometrium | uterine corpus endometrioid carcinoma | Female | <65 | I/II | Unspecific | Paclitaxel | SD |
| MYCBP | SNV | Missense_Mutation | novel | c.271G>A | p.Ala91Thr | p.A91T | Q99417 | protein_coding | tolerated(0.34) | benign(0.026) | TCGA-E6-A2P9-01 | Endometrium | uterine corpus endometrioid carcinoma | Female | >=65 | I/II | Unknown | Unknown | SD |
| MYCBP | SNV | Missense_Mutation | rs769601729 | c.211N>A | p.Glu71Lys | p.E71K | Q99417 | protein_coding | deleterious(0.03) | benign(0.395) | TCGA-EO-A3B0-01 | Endometrium | uterine corpus endometrioid carcinoma | Female | <65 | III/IV | Unknown | Unknown | SD |
| MYCBP | SNV | Missense_Mutation | novel | c.93G>T | p.Leu31Phe | p.L31F | Q99417 | protein_coding | tolerated(0.06) | benign(0.352) | TCGA-55-6981-01 | Lung | lung adenocarcinoma | Female | <65 | III/IV | Chemotherapy | chemo | CR |
| Page: 1 |
Top |
Related drugs of malignant transformation related genes |
| Identification of chemicals and drugs interact with genes involved in malignant transfromation |
| (DGIdb 4.0) |
| Entrez ID | Symbol | Category | Interaction Types | Drug Claim Name | Drug Name | PMIDs |
| Page: 1 |

Copyright 2023-Present -The University of Texas Health Science Center at Houston |