
|
|||||
|
 | |
| |
| |
| |
| |
| |
|
Gene: MYBBP1A |
Gene summary for MYBBP1A |
| Gene information | Species | Human | Gene symbol | MYBBP1A | Gene ID | 10514 |
| Gene name | MYB binding protein 1a | |
| Gene Alias | P160 | |
| Cytomap | 17p13.2 | |
| Gene Type | protein-coding | GO ID | GO:0001503 | UniProtAcc | Q9BQG0 |
Top |
Malignant transformation analysis |
| Identification of the aberrant gene expression in precancerous and cancerous lesions by comparing the gene expression of stem-like cells in diseased tissues with normal stem cells |
| Entrez ID | Symbol | Replicates | Species | Organ | Tissue | Adj P-value | Log2FC | Malignancy |
| 10514 | MYBBP1A | LZE4T | Human | Esophagus | ESCC | 1.21e-02 | 1.99e-01 | 0.0811 |
| 10514 | MYBBP1A | LZE7T | Human | Esophagus | ESCC | 2.96e-10 | 4.14e-01 | 0.0667 |
| 10514 | MYBBP1A | LZE8T | Human | Esophagus | ESCC | 1.83e-05 | 1.49e-01 | 0.067 |
| 10514 | MYBBP1A | LZE22T | Human | Esophagus | ESCC | 1.13e-02 | 1.89e-01 | 0.068 |
| 10514 | MYBBP1A | LZE24T | Human | Esophagus | ESCC | 1.78e-07 | 2.68e-01 | 0.0596 |
| 10514 | MYBBP1A | LZE6T | Human | Esophagus | ESCC | 1.46e-02 | 1.10e-01 | 0.0845 |
| 10514 | MYBBP1A | P2T-E | Human | Esophagus | ESCC | 1.03e-13 | 3.37e-01 | 0.1177 |
| 10514 | MYBBP1A | P4T-E | Human | Esophagus | ESCC | 2.35e-15 | 3.36e-01 | 0.1323 |
| 10514 | MYBBP1A | P5T-E | Human | Esophagus | ESCC | 7.06e-08 | 1.26e-01 | 0.1327 |
| 10514 | MYBBP1A | P8T-E | Human | Esophagus | ESCC | 3.46e-10 | 1.68e-01 | 0.0889 |
| 10514 | MYBBP1A | P9T-E | Human | Esophagus | ESCC | 4.50e-09 | 1.59e-01 | 0.1131 |
| 10514 | MYBBP1A | P10T-E | Human | Esophagus | ESCC | 8.33e-08 | 1.64e-01 | 0.116 |
| 10514 | MYBBP1A | P11T-E | Human | Esophagus | ESCC | 4.71e-05 | 2.32e-01 | 0.1426 |
| 10514 | MYBBP1A | P12T-E | Human | Esophagus | ESCC | 4.30e-12 | 2.79e-01 | 0.1122 |
| 10514 | MYBBP1A | P15T-E | Human | Esophagus | ESCC | 6.95e-14 | 2.01e-01 | 0.1149 |
| 10514 | MYBBP1A | P16T-E | Human | Esophagus | ESCC | 5.73e-22 | 4.65e-01 | 0.1153 |
| 10514 | MYBBP1A | P17T-E | Human | Esophagus | ESCC | 1.09e-03 | 3.67e-01 | 0.1278 |
| 10514 | MYBBP1A | P20T-E | Human | Esophagus | ESCC | 4.46e-15 | 3.60e-01 | 0.1124 |
| 10514 | MYBBP1A | P21T-E | Human | Esophagus | ESCC | 3.17e-20 | 4.64e-01 | 0.1617 |
| 10514 | MYBBP1A | P22T-E | Human | Esophagus | ESCC | 3.99e-18 | 3.03e-01 | 0.1236 |
| Page: 1 2 3 4 |
| Tissue | Expression Dynamics | Abbreviation |
| Esophagus | 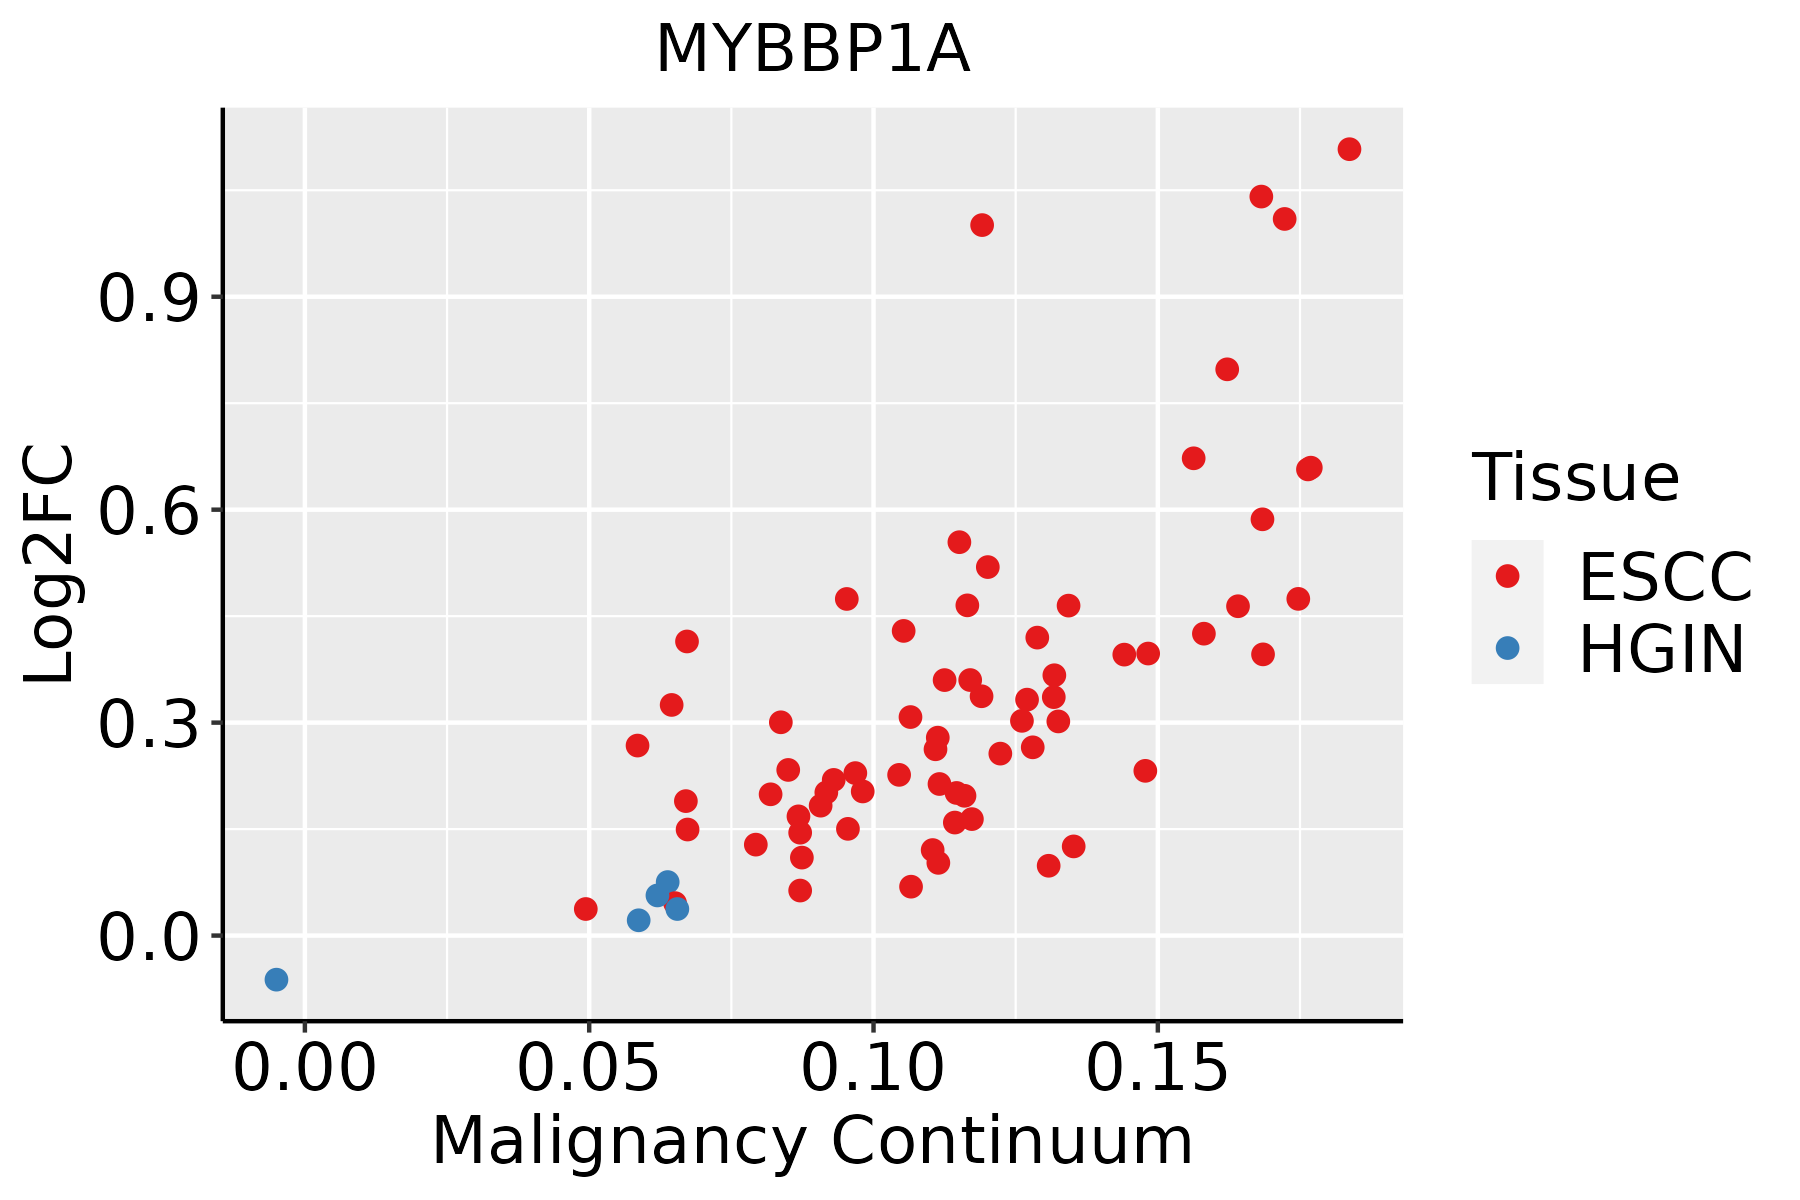 | ESCC: Esophageal squamous cell carcinoma |
| HGIN: High-grade intraepithelial neoplasias | ||
| LGIN: Low-grade intraepithelial neoplasias | ||
| Liver | 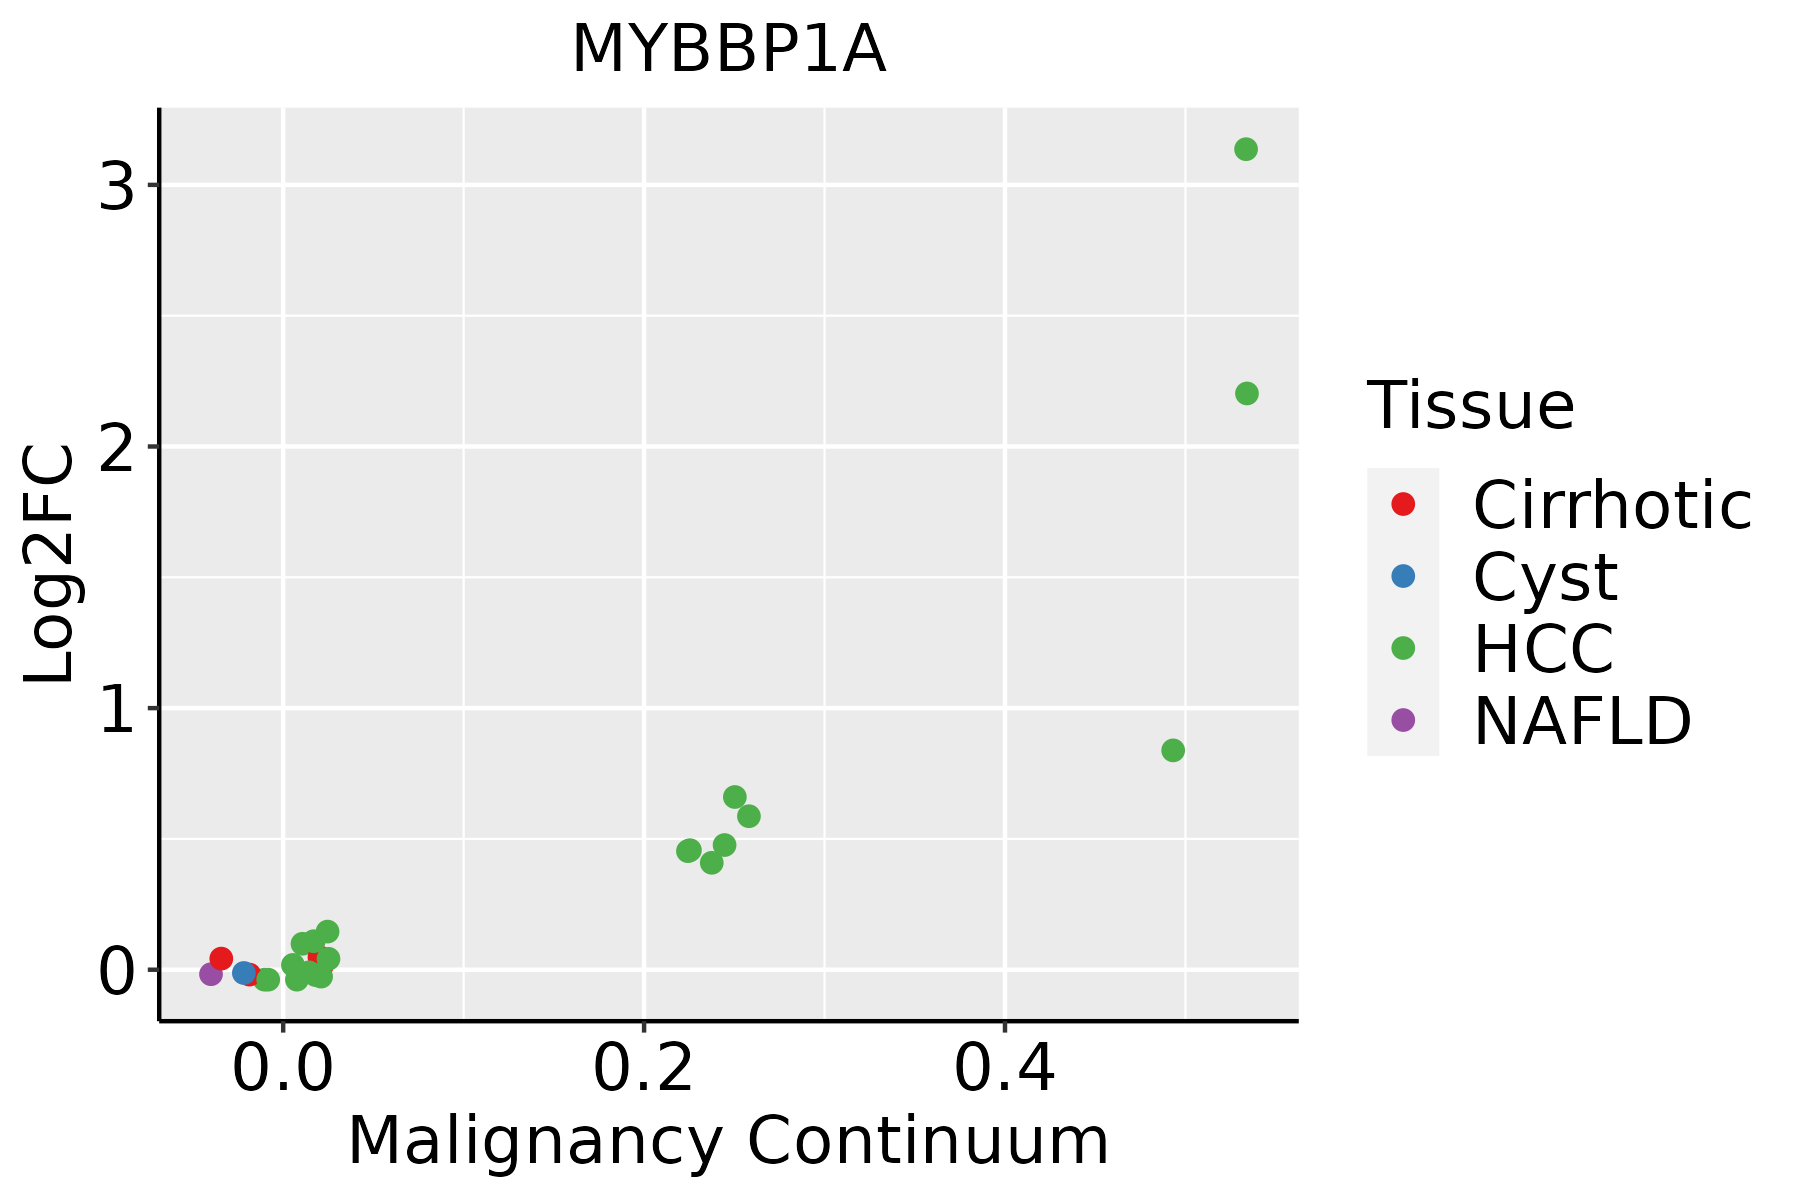 | HCC: Hepatocellular carcinoma |
| NAFLD: Non-alcoholic fatty liver disease | ||
| Oral Cavity | 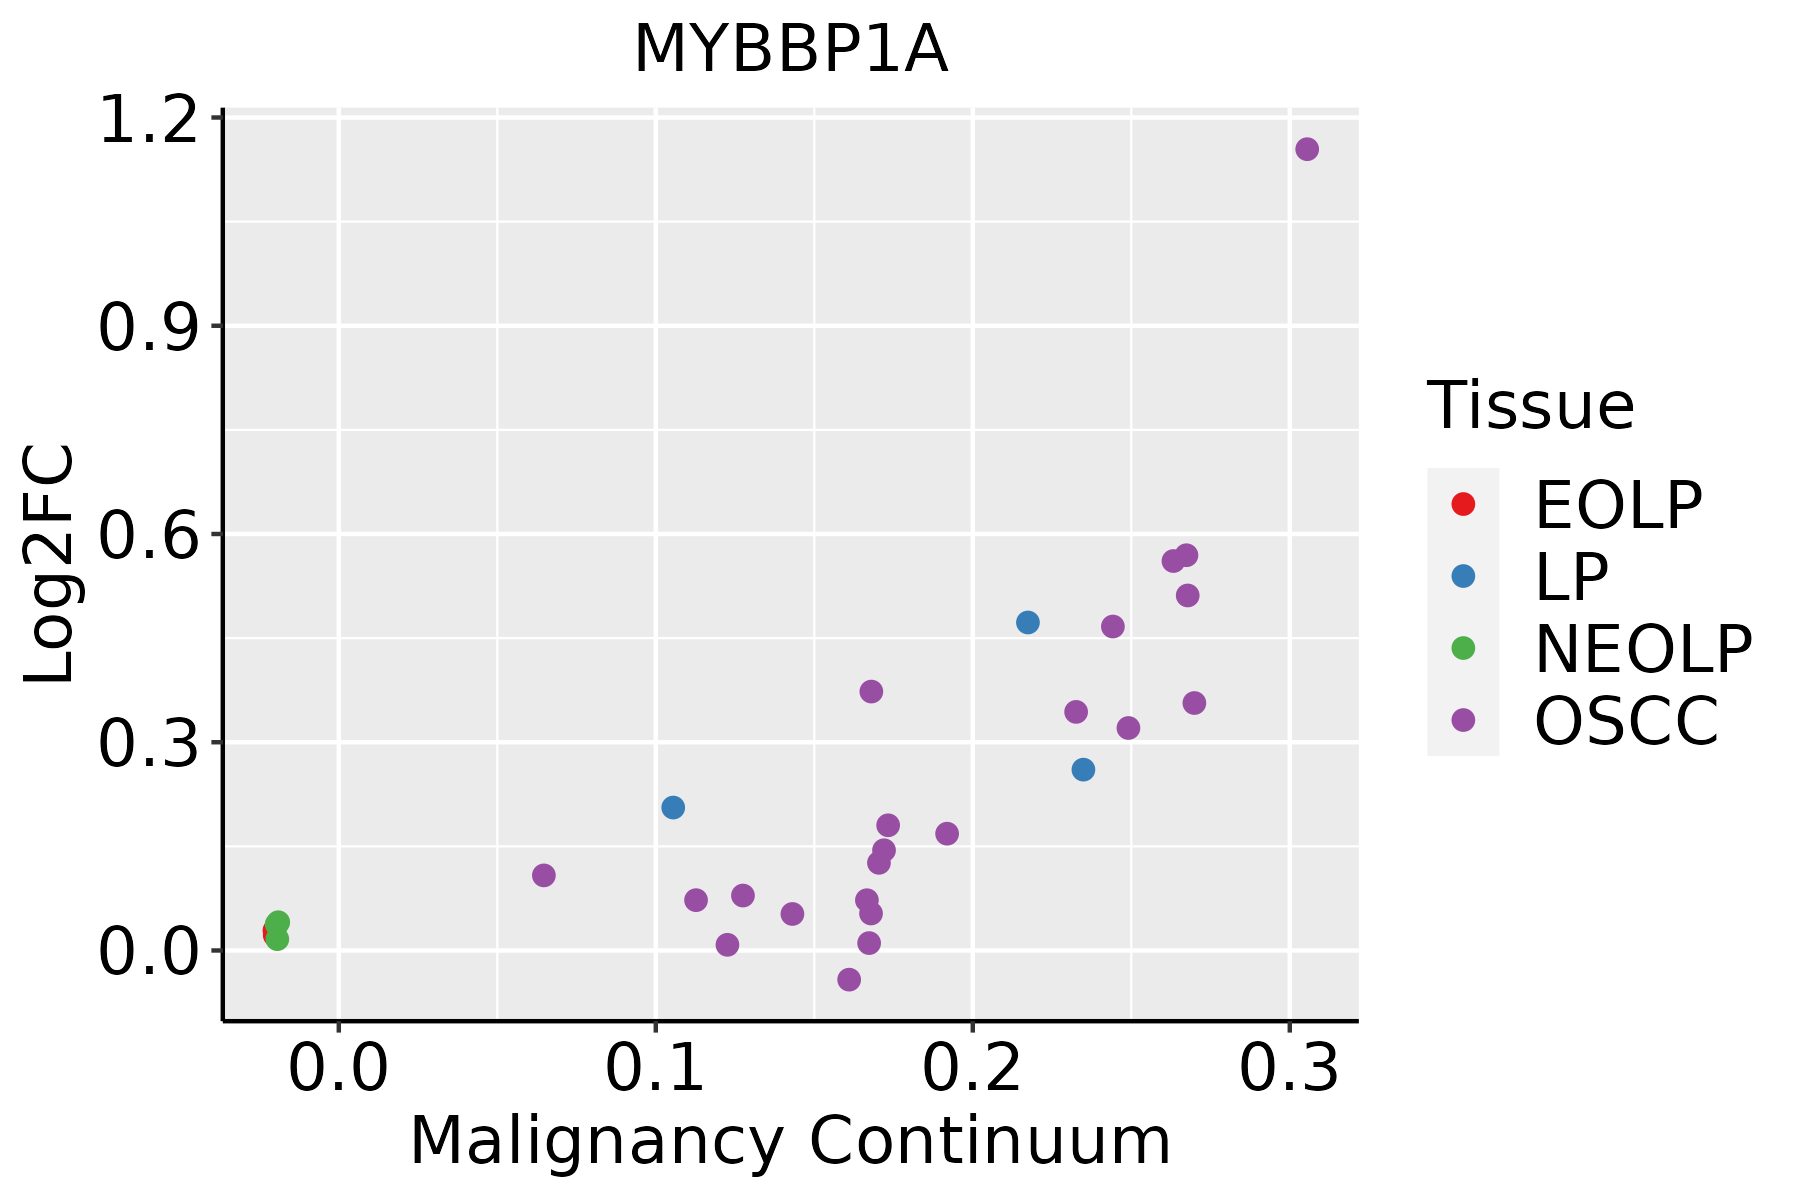 | EOLP: Erosive Oral lichen planus |
| LP: leukoplakia | ||
| NEOLP: Non-erosive oral lichen planus | ||
| OSCC: Oral squamous cell carcinoma |
| ∗log2FC in expression of this searched gene in stem-like cells from each diseased tissue sample relative to stem-like cells in normal samples in each tissue plotted against the malignancy continuum. Samples are colored based on if they are from different disease stage. |
Top |
Malignant transformation related pathway analysis |
| Find out the enriched GO biological processes and KEGG pathways involved in transition from healthy to precancer to cancer |
| Tissue | Disease Stage | Enriched GO biological Processes |
| Colorectum | AD |  |
| Colorectum | SER |  |
| Colorectum | MSS |  |
| Colorectum | MSI-H |  |
| Colorectum | FAP |  |
| ∗Top 15 enriched GO BP terms are showed in the bar plot of each disease state in each tissue. Each row represents a significant GO biological process which is colored according to the -log10(p.adjust). |
| Page: 1 2 3 4 5 6 7 8 9 |
| GO ID | Tissue | Disease Stage | Description | Gene Ratio | Bg Ratio | pvalue | p.adjust | Count |
| GO:0022613111 | Esophagus | ESCC | ribonucleoprotein complex biogenesis | 365/8552 | 463/18723 | 1.74e-49 | 1.11e-45 | 365 |
| GO:0042254111 | Esophagus | ESCC | ribosome biogenesis | 252/8552 | 299/18723 | 3.27e-44 | 1.04e-40 | 252 |
| GO:0097193111 | Esophagus | ESCC | intrinsic apoptotic signaling pathway | 222/8552 | 288/18723 | 5.87e-28 | 2.02e-25 | 222 |
| GO:0006091110 | Esophagus | ESCC | generation of precursor metabolites and energy | 331/8552 | 490/18723 | 3.86e-23 | 8.45e-21 | 331 |
| GO:0045333110 | Esophagus | ESCC | cellular respiration | 173/8552 | 230/18723 | 4.53e-20 | 5.99e-18 | 173 |
| GO:0015980110 | Esophagus | ESCC | energy derivation by oxidation of organic compounds | 220/8552 | 318/18723 | 1.20e-17 | 1.09e-15 | 220 |
| GO:0022900110 | Esophagus | ESCC | electron transport chain | 133/8552 | 175/18723 | 2.18e-16 | 1.67e-14 | 133 |
| GO:0071496111 | Esophagus | ESCC | cellular response to external stimulus | 215/8552 | 320/18723 | 4.29e-15 | 2.43e-13 | 215 |
| GO:0072331111 | Esophagus | ESCC | signal transduction by p53 class mediator | 121/8552 | 163/18723 | 9.61e-14 | 4.69e-12 | 121 |
| GO:0031668111 | Esophagus | ESCC | cellular response to extracellular stimulus | 168/8552 | 246/18723 | 4.93e-13 | 2.23e-11 | 168 |
| GO:0022904110 | Esophagus | ESCC | respiratory electron transport chain | 89/8552 | 114/18723 | 1.36e-12 | 5.80e-11 | 89 |
| GO:0031669110 | Esophagus | ESCC | cellular response to nutrient levels | 148/8552 | 215/18723 | 4.58e-12 | 1.76e-10 | 148 |
| GO:0031667111 | Esophagus | ESCC | response to nutrient levels | 289/8552 | 474/18723 | 9.25e-12 | 3.47e-10 | 289 |
| GO:0009267110 | Esophagus | ESCC | cellular response to starvation | 110/8552 | 156/18723 | 2.63e-10 | 7.37e-09 | 110 |
| GO:004259419 | Esophagus | ESCC | response to starvation | 133/8552 | 197/18723 | 4.31e-10 | 1.14e-08 | 133 |
| GO:0072332111 | Esophagus | ESCC | intrinsic apoptotic signaling pathway by p53 class mediator | 59/8552 | 76/18723 | 1.22e-08 | 2.42e-07 | 59 |
| GO:000164918 | Esophagus | ESCC | osteoblast differentiation | 140/8552 | 229/18723 | 1.63e-06 | 1.95e-05 | 140 |
| GO:000150317 | Esophagus | ESCC | ossification | 232/8552 | 408/18723 | 3.00e-06 | 3.40e-05 | 232 |
| GO:003292215 | Esophagus | ESCC | circadian regulation of gene expression | 48/8552 | 68/18723 | 2.76e-05 | 2.30e-04 | 48 |
| GO:00421492 | Esophagus | ESCC | cellular response to glucose starvation | 36/8552 | 48/18723 | 3.43e-05 | 2.80e-04 | 36 |
| Page: 1 2 3 4 |
| Pathway ID | Tissue | Disease Stage | Description | Gene Ratio | Bg Ratio | pvalue | p.adjust | qvalue | Count |
| Page: 1 |
Top |
Cell-cell communication analysis |
| Identification of potential cell-cell interactions between two cell types and their ligand-receptor pairs for different disease states |
| Ligand | Receptor | LRpair | Pathway | Tissue | Disease Stage |
| Page: 1 |
Top |
Single-cell gene regulatory network inference analysis |
| Find out the significant the regulons (TFs) and the target genes of each regulon across cell types for different disease states |
| TF | Cell Type | Tissue | Disease Stage | Target Gene | RSS | Regulon Activity |
| ∗The dot plots of a searched regulon are shown for all cell subpopulations in each disease state of each tissue based on the regulon specific score inferred using pySCENIC and by calculating the average expression. |
| Page: 1 |
Top |
Somatic mutation of malignant transformation related genes |
| Annotation of somatic variants for genes involved in malignant transformation |
| Hugo Symbol | Variant Class | Variant Classification | dbSNP RS | HGVSc | HGVSp | HGVSp Short | SWISSPROT | BIOTYPE | SIFT | PolyPhen | Tumor Sample Barcode | Tissue | Histology | Sex | Age | Stage | Therapy Types | Drugs | Outcome |
| MYBBP1A | SNV | Missense_Mutation | novel | c.3713N>A | p.Pro1238His | p.P1238H | Q9BQG0 | protein_coding | deleterious(0.05) | possibly_damaging(0.891) | TCGA-A7-A0DB-01 | Breast | breast invasive carcinoma | Female | <65 | I/II | Hormone Therapy | arimidex | SD |
| MYBBP1A | SNV | Missense_Mutation | c.2338N>A | p.Glu780Lys | p.E780K | Q9BQG0 | protein_coding | deleterious(0.01) | probably_damaging(0.983) | TCGA-AC-A23H-01 | Breast | breast invasive carcinoma | Female | >=65 | I/II | Unknown | Unknown | PD | |
| MYBBP1A | SNV | Missense_Mutation | c.2288N>C | p.Val763Ala | p.V763A | Q9BQG0 | protein_coding | tolerated(0.06) | probably_damaging(0.911) | TCGA-AN-A0FZ-01 | Breast | breast invasive carcinoma | Female | <65 | III/IV | Unknown | Unknown | SD | |
| MYBBP1A | SNV | Missense_Mutation | rs759177585 | c.449N>G | p.Val150Gly | p.V150G | Q9BQG0 | protein_coding | deleterious(0.01) | benign(0.364) | TCGA-AQ-A04H-01 | Breast | breast invasive carcinoma | Female | <65 | III/IV | Chemotherapy | taxotere | SD |
| MYBBP1A | SNV | Missense_Mutation | rs141257590 | c.985N>A | p.Val329Met | p.V329M | Q9BQG0 | protein_coding | deleterious(0) | possibly_damaging(0.627) | TCGA-BH-A18G-01 | Breast | breast invasive carcinoma | Female | >=65 | I/II | Unknown | Unknown | SD |
| MYBBP1A | deletion | Frame_Shift_Del | novel | c.2341delC | p.Leu781TrpfsTer6 | p.L781Wfs*6 | Q9BQG0 | protein_coding | TCGA-EW-A2FV-01 | Breast | breast invasive carcinoma | Female | <65 | III/IV | Chemotherapy | docetaxel | SD | ||
| MYBBP1A | SNV | Missense_Mutation | novel | c.929N>A | p.Gly310Asp | p.G310D | Q9BQG0 | protein_coding | deleterious(0.02) | probably_damaging(0.998) | TCGA-2W-A8YY-01 | Cervix | cervical & endocervical cancer | Female | <65 | I/II | Chemotherapy | cisplatin | CR |
| MYBBP1A | SNV | Missense_Mutation | c.3417G>A | p.Met1139Ile | p.M1139I | Q9BQG0 | protein_coding | deleterious(0) | possibly_damaging(0.623) | TCGA-DG-A2KL-01 | Cervix | cervical & endocervical cancer | Female | <65 | I/II | Chemotherapy | cisplatin | SD | |
| MYBBP1A | SNV | Missense_Mutation | c.701N>A | p.Gly234Glu | p.G234E | Q9BQG0 | protein_coding | deleterious(0) | probably_damaging(1) | TCGA-IR-A3LA-01 | Cervix | cervical & endocervical cancer | Female | <65 | I/II | Chemotherapy | cisplatin | CR | |
| MYBBP1A | SNV | Missense_Mutation | c.3929N>T | p.Ser1310Ile | p.S1310I | Q9BQG0 | protein_coding | deleterious_low_confidence(0) | benign(0.153) | TCGA-Q1-A73O-01 | Cervix | cervical & endocervical cancer | Female | <65 | I/II | Chemotherapy | cisplatin | CR |
| Page: 1 2 3 4 5 6 7 8 9 |
Top |
Related drugs of malignant transformation related genes |
| Identification of chemicals and drugs interact with genes involved in malignant transfromation |
| (DGIdb 4.0) |
| Entrez ID | Symbol | Category | Interaction Types | Drug Claim Name | Drug Name | PMIDs |
| Page: 1 |

Copyright 2023-Present -The University of Texas Health Science Center at Houston |