
|
|||||
|
 | |
| |
| |
| |
| |
| |
|
Gene: MYADM |
Gene summary for MYADM |
| Gene information | Species | Human | Gene symbol | MYADM | Gene ID | 91663 |
| Gene name | myeloid associated differentiation marker | |
| Gene Alias | SB135 | |
| Cytomap | 19q13.42 | |
| Gene Type | protein-coding | GO ID | GO:0000902 | UniProtAcc | A0A024R4N0 |
Top |
Malignant transformation analysis |
| Identification of the aberrant gene expression in precancerous and cancerous lesions by comparing the gene expression of stem-like cells in diseased tissues with normal stem cells |
| Entrez ID | Symbol | Replicates | Species | Organ | Tissue | Adj P-value | Log2FC | Malignancy |
| 91663 | MYADM | CA_HPV_2 | Human | Cervix | CC | 2.85e-08 | 5.29e-01 | 0.0391 |
| 91663 | MYADM | HSIL_HPV_2 | Human | Cervix | HSIL_HPV | 2.38e-02 | -2.78e-01 | 0.0208 |
| 91663 | MYADM | N_HPV_1 | Human | Cervix | N_HPV | 9.61e-03 | 3.15e-01 | 0.0079 |
| 91663 | MYADM | CCI_1 | Human | Cervix | CC | 1.25e-03 | -4.65e-01 | 0.528 |
| 91663 | MYADM | CCI_2 | Human | Cervix | CC | 2.44e-05 | -4.85e-01 | 0.5249 |
| 91663 | MYADM | CCI_3 | Human | Cervix | CC | 2.45e-08 | -4.85e-01 | 0.516 |
| 91663 | MYADM | CCII_1 | Human | Cervix | CC | 1.91e-09 | -4.74e-01 | 0.3249 |
| 91663 | MYADM | Tumor | Human | Cervix | CC | 6.17e-26 | -4.85e-01 | 0.1241 |
| 91663 | MYADM | sample1 | Human | Cervix | CC | 3.13e-07 | -4.63e-01 | 0.0959 |
| 91663 | MYADM | sample3 | Human | Cervix | CC | 7.30e-28 | -4.84e-01 | 0.1387 |
| 91663 | MYADM | H2 | Human | Cervix | HSIL_HPV | 1.55e-03 | -3.41e-01 | 0.0632 |
| 91663 | MYADM | L1 | Human | Cervix | CC | 7.01e-06 | -3.75e-01 | 0.0802 |
| 91663 | MYADM | T1 | Human | Cervix | CC | 1.16e-22 | -4.85e-01 | 0.0918 |
| 91663 | MYADM | T3 | Human | Cervix | CC | 1.05e-26 | -4.85e-01 | 0.1389 |
| 91663 | MYADM | HTA11_3410_2000001011 | Human | Colorectum | AD | 1.38e-04 | 1.73e-01 | 0.0155 |
| 91663 | MYADM | HTA11_2951_2000001011 | Human | Colorectum | AD | 1.37e-04 | 3.64e-01 | 0.0216 |
| 91663 | MYADM | HTA11_1938_2000001011 | Human | Colorectum | AD | 5.11e-07 | 3.26e-01 | -0.0811 |
| 91663 | MYADM | HTA11_78_2000001011 | Human | Colorectum | AD | 1.31e-03 | 2.17e-01 | -0.1088 |
| 91663 | MYADM | HTA11_347_2000001011 | Human | Colorectum | AD | 3.38e-17 | 5.08e-01 | -0.1954 |
| 91663 | MYADM | HTA11_411_2000001011 | Human | Colorectum | SER | 2.08e-03 | 6.35e-01 | -0.2602 |
| Page: 1 2 3 4 5 6 7 8 9 |
| Tissue | Expression Dynamics | Abbreviation |
| Cervix | 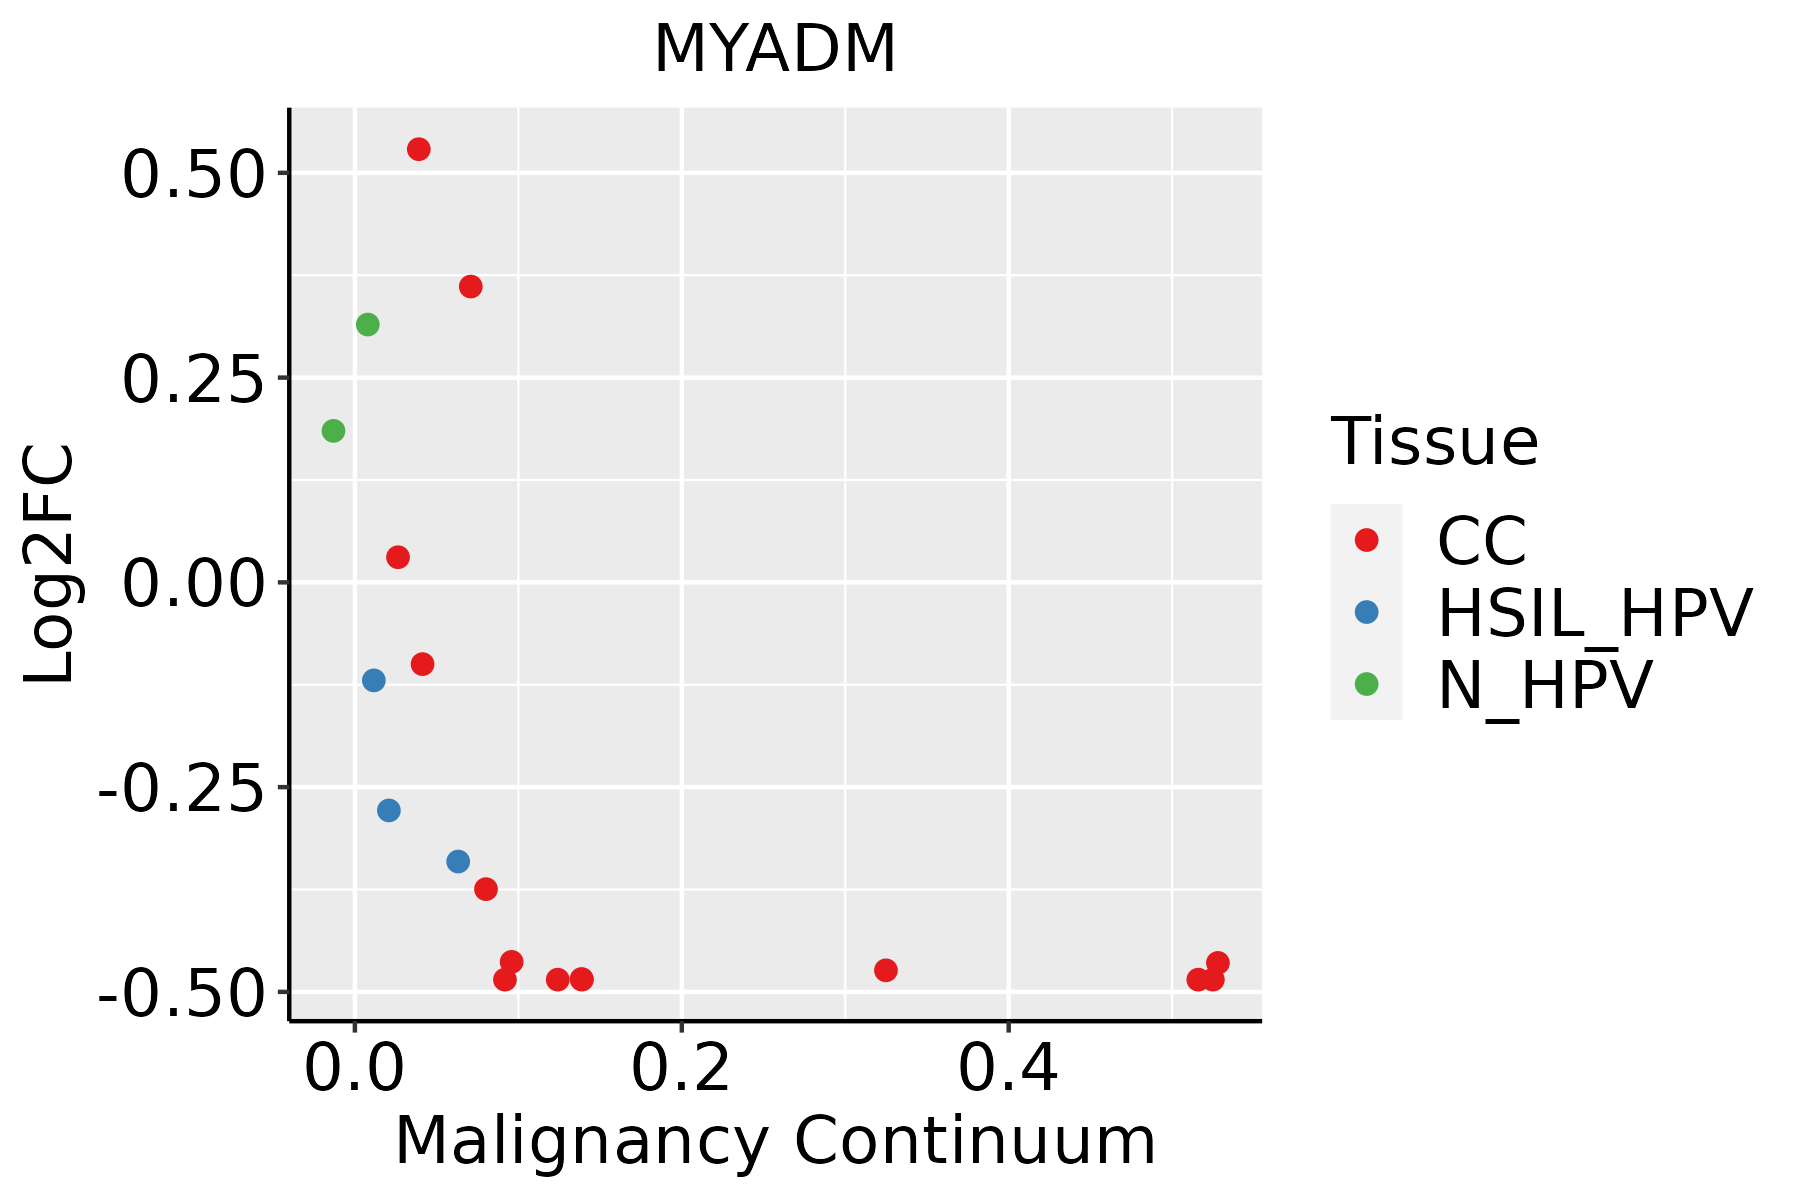 | CC: Cervix cancer |
| HSIL_HPV: HPV-infected high-grade squamous intraepithelial lesions | ||
| N_HPV: HPV-infected normal cervix | ||
| Colorectum (GSE201348) |  | FAP: Familial adenomatous polyposis |
| CRC: Colorectal cancer | ||
| Colorectum (HTA11) |  | AD: Adenomas |
| SER: Sessile serrated lesions | ||
| MSI-H: Microsatellite-high colorectal cancer | ||
| MSS: Microsatellite stable colorectal cancer | ||
| Endometrium | 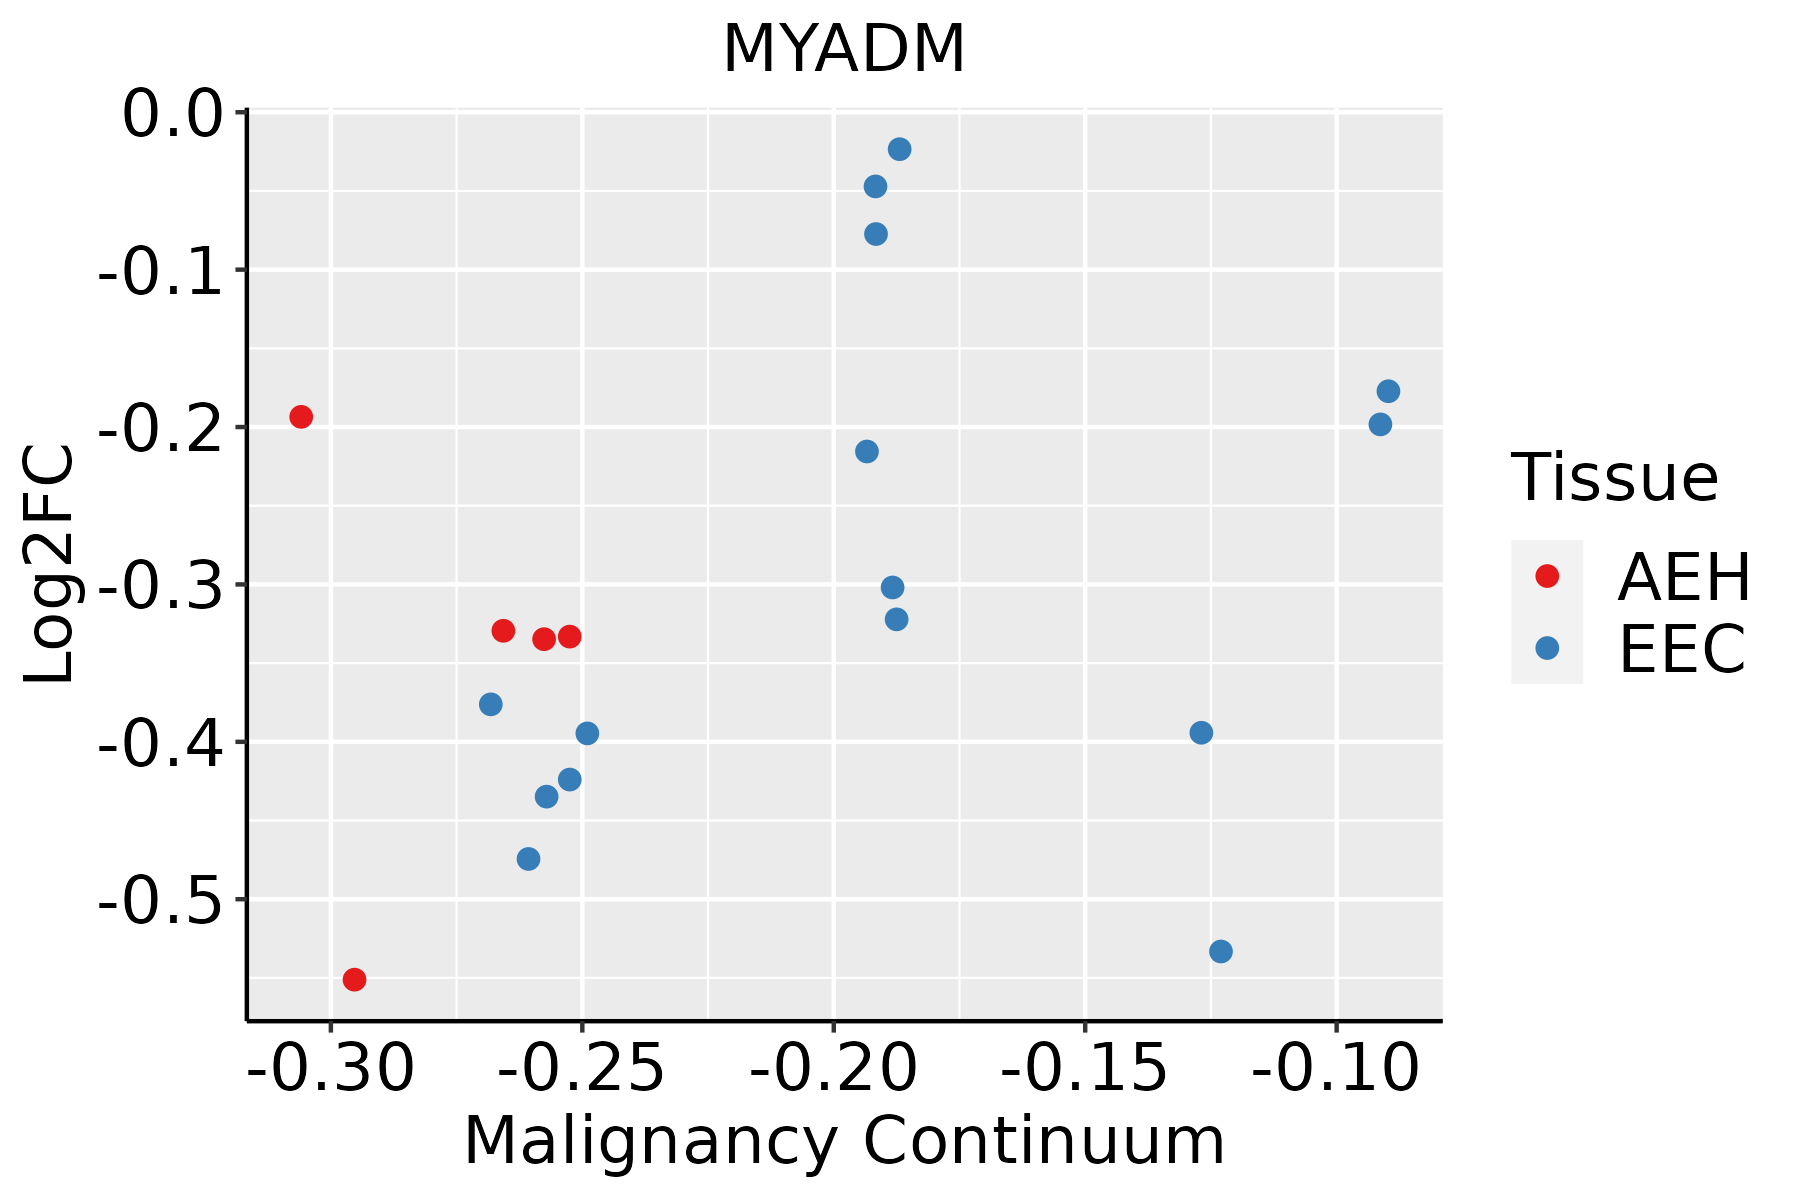 | AEH: Atypical endometrial hyperplasia |
| EEC: Endometrioid Cancer | ||
| Esophagus | 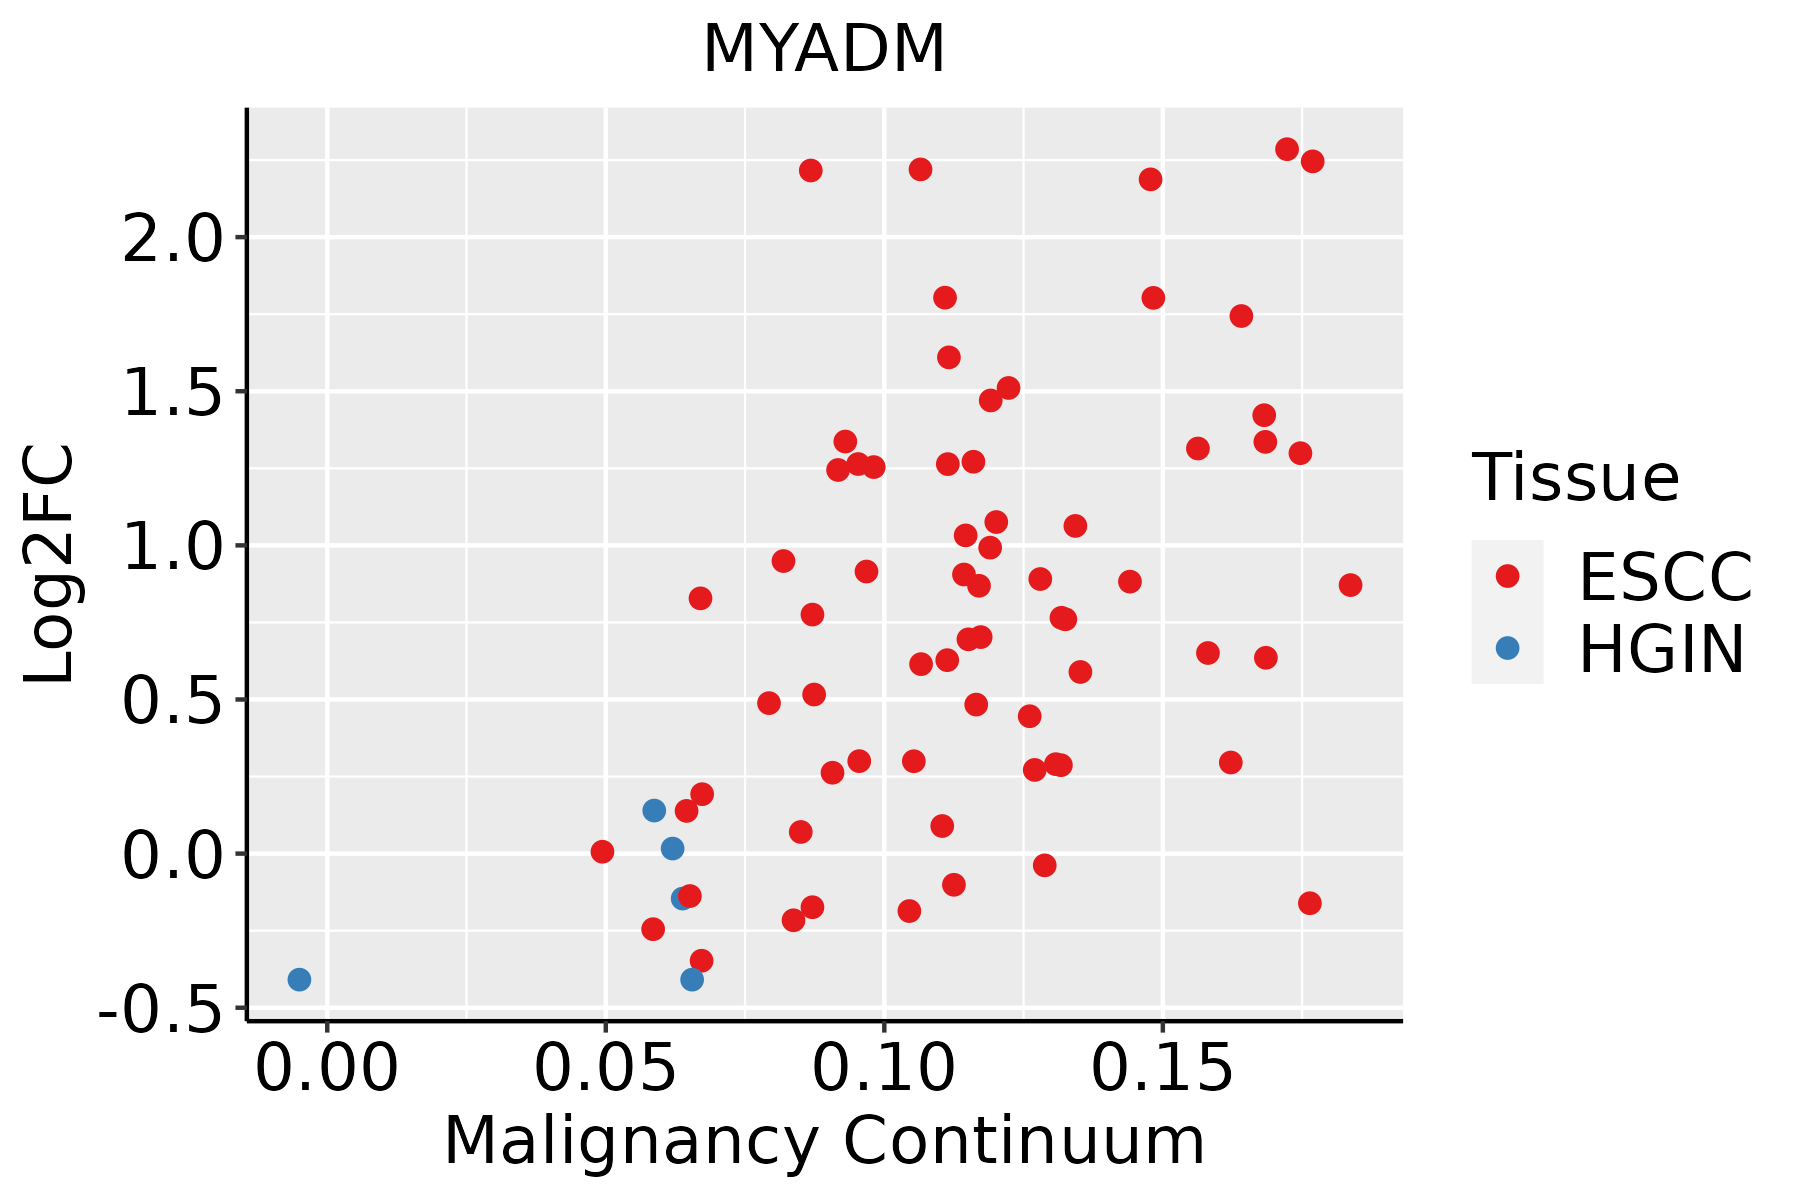 | ESCC: Esophageal squamous cell carcinoma |
| HGIN: High-grade intraepithelial neoplasias | ||
| LGIN: Low-grade intraepithelial neoplasias | ||
| Liver |  | HCC: Hepatocellular carcinoma |
| NAFLD: Non-alcoholic fatty liver disease | ||
| Oral Cavity | 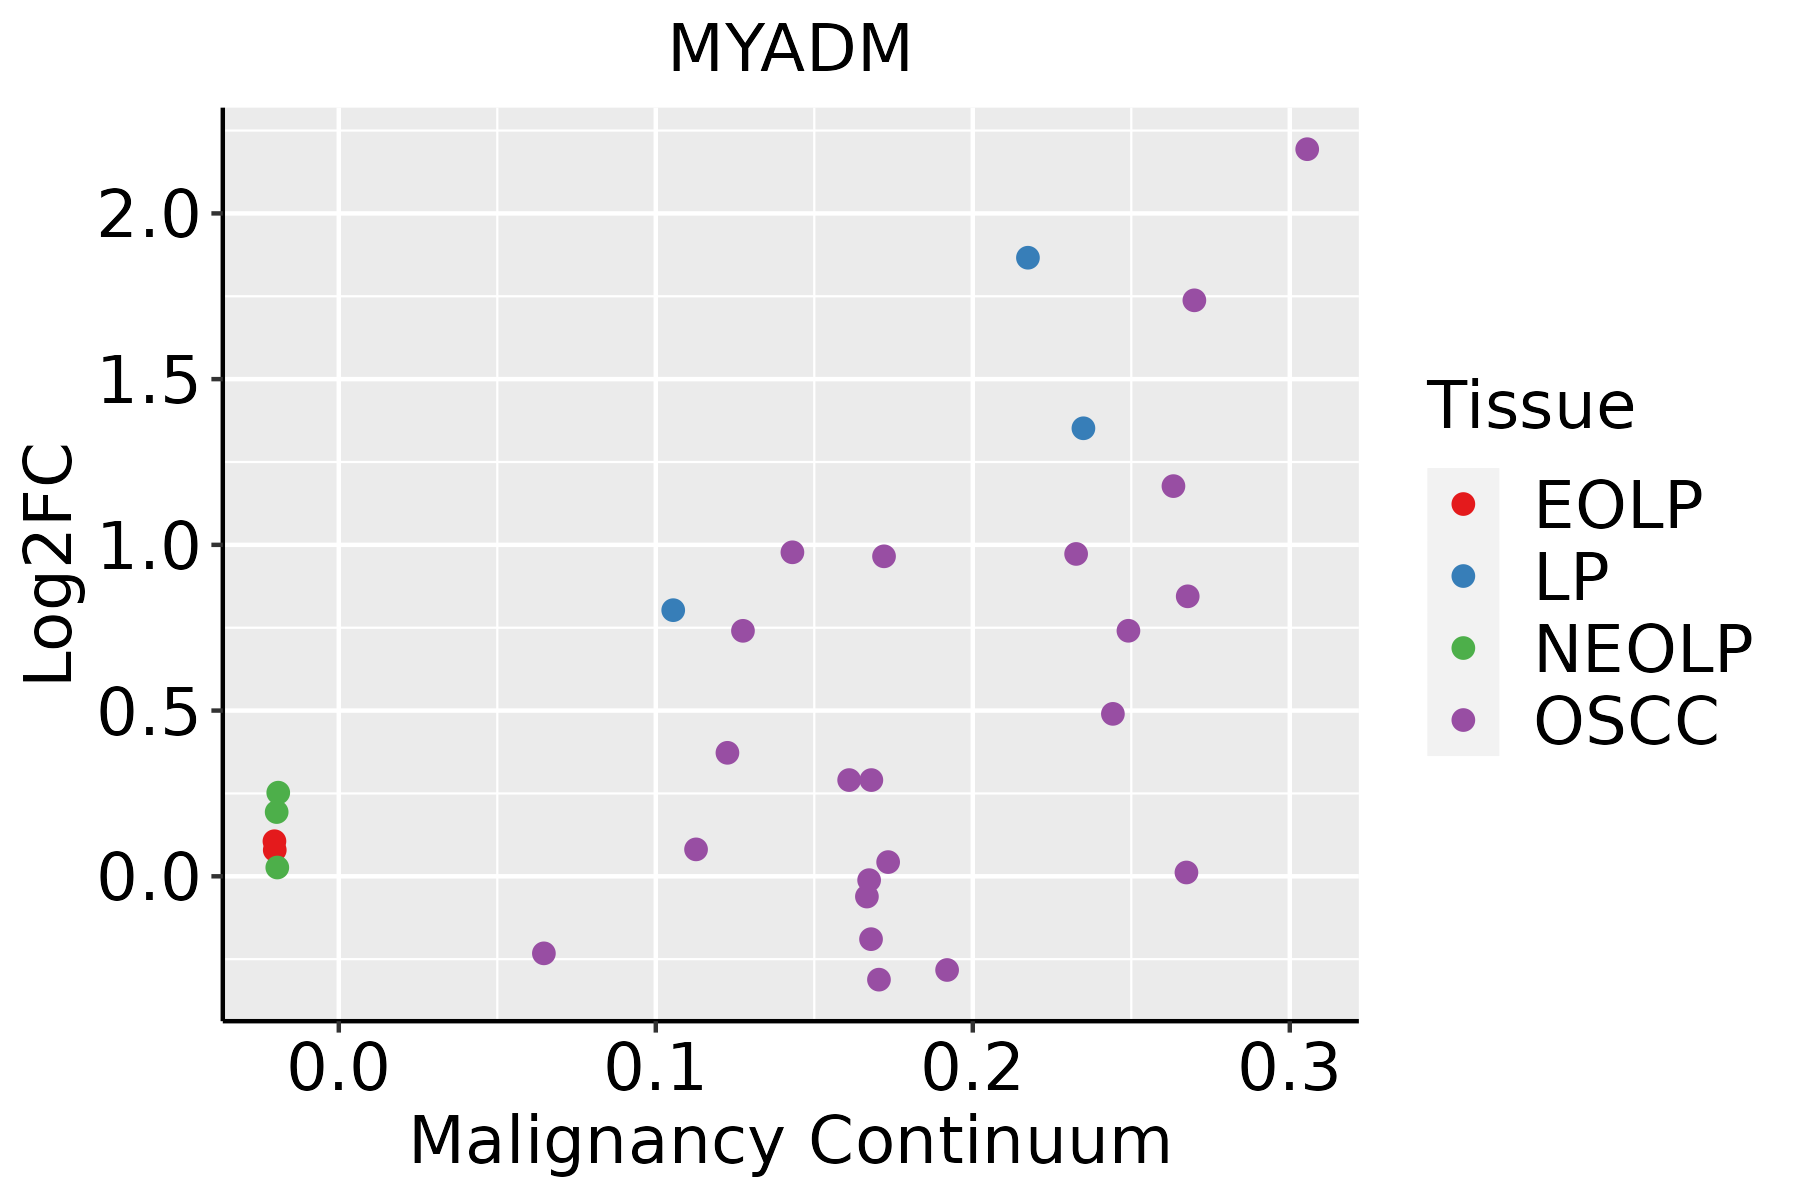 | EOLP: Erosive Oral lichen planus |
| LP: leukoplakia | ||
| NEOLP: Non-erosive oral lichen planus | ||
| OSCC: Oral squamous cell carcinoma | ||
| Prostate | 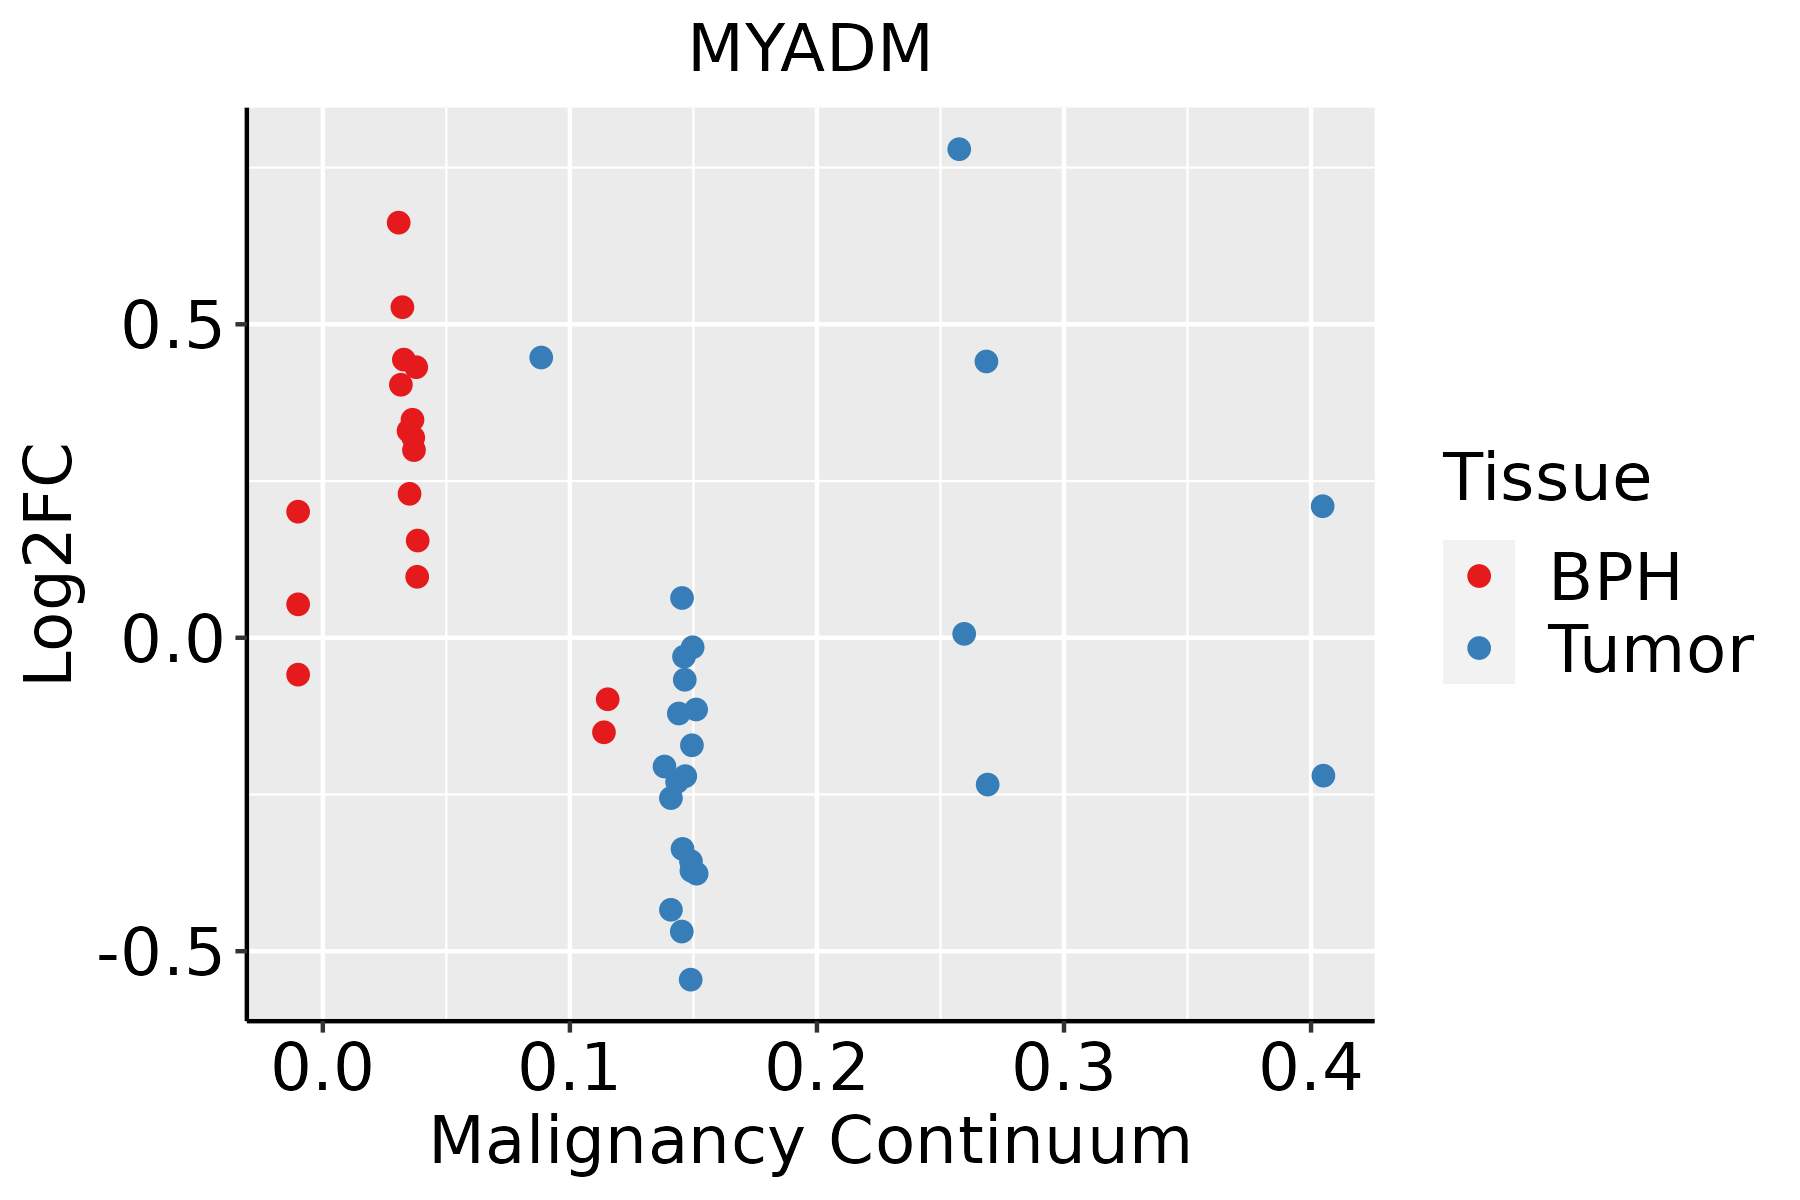 | BPH: Benign Prostatic Hyperplasia |
| Thyroid |  | ATC: Anaplastic thyroid cancer |
| HT: Hashimoto's thyroiditis | ||
| PTC: Papillary thyroid cancer |
| ∗log2FC in expression of this searched gene in stem-like cells from each diseased tissue sample relative to stem-like cells in normal samples in each tissue plotted against the malignancy continuum. Samples are colored based on if they are from different disease stage. |
Top |
Malignant transformation related pathway analysis |
| Find out the enriched GO biological processes and KEGG pathways involved in transition from healthy to precancer to cancer |
| Tissue | Disease Stage | Enriched GO biological Processes |
| Colorectum | AD |  |
| Colorectum | SER |  |
| Colorectum | MSS |  |
| Colorectum | MSI-H |  |
| Colorectum | FAP |  |
| ∗Top 15 enriched GO BP terms are showed in the bar plot of each disease state in each tissue. Each row represents a significant GO biological process which is colored according to the -log10(p.adjust). |
| Page: 1 2 3 4 5 6 7 8 9 |
| GO ID | Tissue | Disease Stage | Description | Gene Ratio | Bg Ratio | pvalue | p.adjust | Count |
| GO:001081010 | Cervix | CC | regulation of cell-substrate adhesion | 69/2311 | 221/18723 | 8.57e-14 | 5.69e-11 | 69 |
| GO:00315898 | Cervix | CC | cell-substrate adhesion | 96/2311 | 363/18723 | 1.48e-13 | 8.85e-11 | 96 |
| GO:000701510 | Cervix | CC | actin filament organization | 109/2311 | 442/18723 | 4.92e-13 | 2.45e-10 | 109 |
| GO:002260410 | Cervix | CC | regulation of cell morphogenesis | 84/2311 | 309/18723 | 1.00e-12 | 4.29e-10 | 84 |
| GO:003297010 | Cervix | CC | regulation of actin filament-based process | 96/2311 | 397/18723 | 4.00e-11 | 8.54e-09 | 96 |
| GO:190290310 | Cervix | CC | regulation of supramolecular fiber organization | 92/2311 | 383/18723 | 1.49e-10 | 2.48e-08 | 92 |
| GO:002240710 | Cervix | CC | regulation of cell-cell adhesion | 103/2311 | 448/18723 | 1.78e-10 | 2.87e-08 | 103 |
| GO:004578510 | Cervix | CC | positive regulation of cell adhesion | 101/2311 | 437/18723 | 1.96e-10 | 3.08e-08 | 101 |
| GO:007265910 | Cervix | CC | protein localization to plasma membrane | 73/2311 | 284/18723 | 4.95e-10 | 6.73e-08 | 73 |
| GO:003295610 | Cervix | CC | regulation of actin cytoskeleton organization | 86/2311 | 358/18723 | 5.90e-10 | 7.51e-08 | 86 |
| GO:004325410 | Cervix | CC | regulation of protein-containing complex assembly | 96/2311 | 428/18723 | 2.91e-09 | 3.05e-07 | 96 |
| GO:19907788 | Cervix | CC | protein localization to cell periphery | 78/2311 | 333/18723 | 1.22e-08 | 9.73e-07 | 78 |
| GO:00071626 | Cervix | CC | negative regulation of cell adhesion | 72/2311 | 303/18723 | 2.36e-08 | 1.70e-06 | 72 |
| GO:011005310 | Cervix | CC | regulation of actin filament organization | 67/2311 | 278/18723 | 4.01e-08 | 2.54e-06 | 67 |
| GO:005125810 | Cervix | CC | protein polymerization | 70/2311 | 297/18723 | 5.20e-08 | 3.11e-06 | 70 |
| GO:19000249 | Cervix | CC | regulation of substrate adhesion-dependent cell spreading | 23/2311 | 57/18723 | 8.94e-08 | 5.04e-06 | 23 |
| GO:003227110 | Cervix | CC | regulation of protein polymerization | 57/2311 | 233/18723 | 2.37e-07 | 1.03e-05 | 57 |
| GO:00107699 | Cervix | CC | regulation of cell morphogenesis involved in differentiation | 31/2311 | 96/18723 | 2.43e-07 | 1.05e-05 | 31 |
| GO:00344469 | Cervix | CC | substrate adhesion-dependent cell spreading | 32/2311 | 108/18723 | 1.36e-06 | 4.55e-05 | 32 |
| GO:00224084 | Cervix | CC | negative regulation of cell-cell adhesion | 48/2311 | 196/18723 | 1.99e-06 | 6.18e-05 | 48 |
| Page: 1 2 3 4 5 6 7 8 9 10 11 12 13 14 15 16 17 18 19 20 21 22 23 24 25 26 27 28 29 30 31 32 33 34 35 36 37 38 39 40 41 42 43 |
| Pathway ID | Tissue | Disease Stage | Description | Gene Ratio | Bg Ratio | pvalue | p.adjust | qvalue | Count |
| Page: 1 |
Top |
Cell-cell communication analysis |
| Identification of potential cell-cell interactions between two cell types and their ligand-receptor pairs for different disease states |
| Ligand | Receptor | LRpair | Pathway | Tissue | Disease Stage |
| Page: 1 |
Top |
Single-cell gene regulatory network inference analysis |
| Find out the significant the regulons (TFs) and the target genes of each regulon across cell types for different disease states |
| TF | Cell Type | Tissue | Disease Stage | Target Gene | RSS | Regulon Activity |
| ∗The dot plots of a searched regulon are shown for all cell subpopulations in each disease state of each tissue based on the regulon specific score inferred using pySCENIC and by calculating the average expression. |
| Page: 1 |
Top |
Somatic mutation of malignant transformation related genes |
| Annotation of somatic variants for genes involved in malignant transformation |
| Hugo Symbol | Variant Class | Variant Classification | dbSNP RS | HGVSc | HGVSp | HGVSp Short | SWISSPROT | BIOTYPE | SIFT | PolyPhen | Tumor Sample Barcode | Tissue | Histology | Sex | Age | Stage | Therapy Types | Drugs | Outcome |
| MYADM | SNV | Missense_Mutation | c.884N>T | p.Ala295Val | p.A295V | Q96S97 | protein_coding | tolerated(0.08) | possibly_damaging(0.589) | TCGA-BH-A0HF-01 | Breast | breast invasive carcinoma | Female | >=65 | I/II | Hormone Therapy | arimidex | SD | |
| MYADM | insertion | Frame_Shift_Ins | novel | c.148_149insACCACACCCGG | p.Ala50AspfsTer33 | p.A50Dfs*33 | Q96S97 | protein_coding | TCGA-B6-A0RE-01 | Breast | breast invasive carcinoma | Female | <65 | I/II | Unknown | Unknown | SD | ||
| MYADM | SNV | Missense_Mutation | c.7G>A | p.Val3Met | p.V3M | Q96S97 | protein_coding | tolerated_low_confidence(0.17) | benign(0.295) | TCGA-C5-A1MQ-01 | Cervix | cervical & endocervical cancer | Female | <65 | I/II | Chemotherapy | cisplatin | SD | |
| MYADM | SNV | Missense_Mutation | novel | c.415G>A | p.Ala139Thr | p.A139T | Q96S97 | protein_coding | tolerated(0.33) | possibly_damaging(0.68) | TCGA-AA-A00N-01 | Colorectum | colon adenocarcinoma | Male | >=65 | I/II | Unknown | Unknown | PD |
| MYADM | SNV | Missense_Mutation | rs775841521 | c.398N>T | p.Ser133Leu | p.S133L | Q96S97 | protein_coding | tolerated(0.63) | benign(0.092) | TCGA-AZ-4315-01 | Colorectum | colon adenocarcinoma | Male | <65 | I/II | Unknown | Unknown | SD |
| MYADM | SNV | Missense_Mutation | novel | c.136N>G | p.Ser46Ala | p.S46A | Q96S97 | protein_coding | tolerated(0.13) | probably_damaging(0.989) | TCGA-D5-6928-01 | Colorectum | colon adenocarcinoma | Male | >=65 | I/II | Unknown | Unknown | SD |
| MYADM | SNV | Missense_Mutation | c.410N>T | p.Ala137Val | p.A137V | Q96S97 | protein_coding | tolerated(0.1) | possibly_damaging(0.657) | TCGA-D5-6928-01 | Colorectum | colon adenocarcinoma | Male | >=65 | I/II | Unknown | Unknown | SD | |
| MYADM | SNV | Missense_Mutation | rs776582147 | c.899N>T | p.Thr300Met | p.T300M | Q96S97 | protein_coding | deleterious(0) | probably_damaging(1) | TCGA-G4-6628-01 | Colorectum | colon adenocarcinoma | Male | >=65 | I/II | Unknown | Unknown | SD |
| MYADM | SNV | Missense_Mutation | c.584N>G | p.Asn195Ser | p.N195S | Q96S97 | protein_coding | tolerated(0.63) | benign(0) | TCGA-NH-A5IV-01 | Colorectum | colon adenocarcinoma | Female | >=65 | I/II | Unknown | Unknown | SD | |
| MYADM | SNV | Missense_Mutation | c.805N>A | p.Gly269Ser | p.G269S | Q96S97 | protein_coding | deleterious(0.01) | benign(0.164) | TCGA-NH-A5IV-01 | Colorectum | colon adenocarcinoma | Female | >=65 | I/II | Unknown | Unknown | SD |
| Page: 1 2 3 4 5 |
Top |
Related drugs of malignant transformation related genes |
| Identification of chemicals and drugs interact with genes involved in malignant transfromation |
| (DGIdb 4.0) |
| Entrez ID | Symbol | Category | Interaction Types | Drug Claim Name | Drug Name | PMIDs |
| Page: 1 |

Copyright 2023-Present -The University of Texas Health Science Center at Houston |